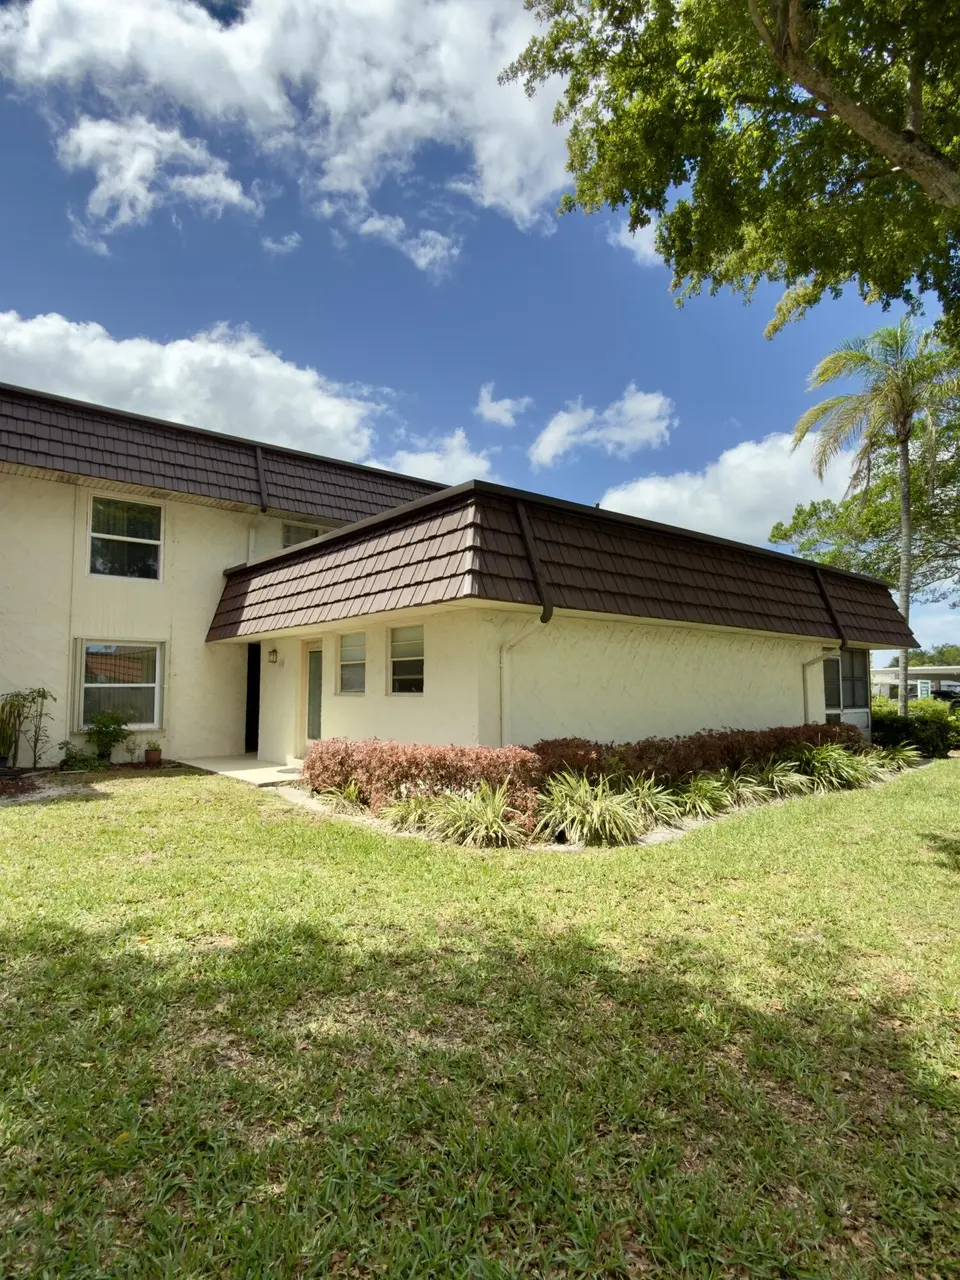
12005 Poinciana Blvd #103 · Royal Palm Beach, FL
Flood risk 1/10 · Minimal
- FEMA flood zone
- X (unshaded)
- Chance of flooding over 30 yrs
- 0.0%
- Est. flood insurance / yr
- $507 – $1,088
Fire risk 1/10 · Minimal
- Est. fire insurance / yr
- $947 – $1,759
Heat risk 10/10 · Severe
- Hot days now (above 107°F)
- 7 days/yr
- Hot days in 30 yrs
- 25 days/yr
Wind risk 10/10 · Severe
- Chance of severe wind over 30 yrs
- 99.0%
Air-quality risk 2/10 · Minimal
- Unhealthy air days now
- 0 days/yr
- Unhealthy air days in 30 yrs
- 1 days/yr
Risk factors via First Street. Map © Google.
Why this score? — see what drove the C- grade
The composite is a weighted blend of 9 inputs, each scored 0–100. Each bar is that input's sub-score; the figure is the points it added to the 100-point composite (weight × sub-score).
- 1% rule +10.0/10.0
- Appreciation +10.0/10.0
- Cash flow +9.4/30.0
- ARV discount +7.5/15.0
- Schools +4.3/10.0
- Livability +4.0/5.0
- Rent growth +2.7/5.0
- DSCR +2.6/10.0
- Condition / age +2.5/5.0
$102,000
🖨 Deal sheet 📄 Offer letter ✓ Due diligence
Listing remarks
Greenway Village 1 bedroom, 1.5 bath condominium, on the ground floor, with no one on three sides or above. This charming end unit, in need of updating, is bright, roomy and has an enclosed lanai. The community has pools, shuffleboard and a clubhouse with fitness facility. Royal Palm Beach Commons Park across the street, offers disc golf, driving range, bike and walking paths and hosts numerous events and concerts throughout the year. Close to shopping, Wellington mall, restaurants and entertainment.
Key facts
- Wellington mall
- Ground floor
- Close to shopping
Tags
Property features AI
Finance
- Other: Pets allowed with restrictions (breed, number, and size limits)
- HOA & community: Community association: Greenway Village South Condo 1; Monthly association fee; Association amenities include: billiard room, clubhouse, fitness center, laundry, parking, pool, sauna, shuffleboard court, storage, bocce ball, community room, library, sidewalks, street lights, and maintenance; Association covers maintenance of grounds, sewer, trash, common areas, recreation facility, and pool service; Senior community
Exterior
- Parking: Open guest parking (asphalt); One parking space
- Utilities: Public water; Public sewer; Electricity available (circuit breakers, three phase); Cable available; Phone available
- Home design: Condominium; One story; Resale condition; Faces south
- Construction: Stucco and concrete block construction with stucco finish; Flat and mansard roof; Slab foundation
- Exterior features: Glass-enclosed patio/porch; Asphalt road frontage; Publicly maintained road; Not waterfront
Interior
- Kitchen: Electric range; Microwave; Refrigerator
- Bedrooms: One main-level bedroom
- Flooring: Ceramic tile; Tile
- Bathrooms: One full bathroom; One half bathroom
- Heating & cooling: Electric heating; Central air; Ceiling fan(s)
- Interior features: High ceilings; Walk-in closet(s); Sliding windows
- Laundry & utility: Laundry facilities in the community
Neighborhood map
What this means for you Summary
Snapshot
- This is a 1-bed/1.5-bath condo listed at $102k.
Deal economics
- At list price, monthly cash flow is $-74 ($-883/yr) — negative.
- To cash-flow at today's rent, offer at most $89k (12.7% below list).
- Meets the 1% rule at list price ($2k rent vs $102k).
- Recommended offer: $89k (12.7% below list) — sets the bar for cash-flow.
Location & tenants
- Location reads 79/100 on livability (#135 in FL, #2,039 nationally) — a middle-class / working-renter tenant base. Strengths: employment A+, housing A+, health & safety A+; Watch: cost of living C-, amenities F, commute F.
- Palm Beach (suburban): math 46% / reading 53% proficiency, ranked #34 of 73 in FL (top 47%) — families likely to look elsewhere, expect single-tenant / working-renter base with shorter leases.
- Zoned schools: Cypress Trails Elementary School (math 52% / reading 62%, grade C+, #781 of 2,144 statewide, top 38%, 492 students, 53% FRL); Crestwood Community Middle (math 49% / reading 52%, grade C, #246 of 571 statewide, top 44%, 724 students, 50% FRL); Royal Palm Beach High School (math 22% / reading 38%, grade F, #441 of 667 statewide, top 67%, 2,343 students, 57% FRL) — zoned schools at 54% FRL track the district average.
- Market conditions: Rents flat; 574 active listings in the ZIP; 4 comparable units currently listed for rent nearby; rentals at typical pace (median 24d on market — plan ~3-4 weeks tenant-placement turnaround); solid renter incomes; 3,974 units permitted in Palm Beach County in 2024 (1,012 in 5+ unit buildings).
Forward outlook
- In year one you build about $11k of equity ($705 loan paydown + $10k appreciation (10.0% local appreciation)).
- Palm Beach County population projected at +30% by 2050 — long-run rental-demand tailwind backs the buy-and-hold thesis.
- At projected returns (10.0% appreciation + 0.8% rent growth), your $29k cash investment doubles in ~3 years — after that, you're playing with house money.
- By year 4, paydown + projected appreciation supports a ~$39k cash-out refi (75% LTV) — recoverable capital for the next deal without selling this one.
Negotiation context
- It's been on market 36 days — a 3% lower offer ($99k) is reasonable based on typical stale-listing flexibility.
- 12 sale attempts since 27y ago with the ask held roughly flat each time — persistent listings suggest the price (not the market) is what's stuck; bring a comps-based counter.
- Current owner paid $25k; list at $102k implies a 308% gain — meaningful room to come down on a strong offer.
Risks & watch-outs
- Watch-outs: HOA is 41% of rent.
- Climate carrying-cost: severe wind risk, 99% chance of damaging wind over 30y; extreme-heat days projected 7→25/yr by 2055 (HVAC capex compounding) — expect insurance premiums to compound above CPI over the hold.
Questions for the listing agent
- What do current leases actually rent for vs. the listed asking? Can we see a recent rent roll and the last 12 months of T-12 income?
- It's been on market 36 days. Have you received any prior offers? Is the seller open to a 13% concession, seller financing, or rate buy-down credit?
- Built in 1972 — when were the roof, HVAC, electrical panel, plumbing, and water heater last replaced?
- What does the HOA fee cover, when was the last increase, and are there any pending special assessments or reserve-fund shortfalls?
- Any open or pending special assessments — roof, HVAC, plumbing, elevator, façade? What's the per-unit balance and payoff schedule, and is the seller paying it off at close or rolling it to the buyer?
- Is there a deadline driving the sale (1031 exchange, divorce, estate, relocation)? That informs how much negotiation room exists.
- Schools are B-rated — typically a magnet for longer-tenancy family renters. What's the average tenant stay here, and is there a school-zone premium baked into asking?
- What's the average days-on-market for RENTAL listings here right now (not sales)? A rising rental-DOM trend means longer vacancies and softer asking-rent achievability than the comps imply.
- What's the recent tenant-quality profile in this submarket — average credit score on applications, eviction rate, late-payment / NSF rate, and stable-employment percentage? A property-management company in the area should have these aggregated.
- How much new apartment / multifamily construction is in the pipeline within 1–3 miles? Heavy new supply (>2% of stock underway) typically softens rents 12–24 months out; light construction supports rent growth.
Investment metrics
- 1% rule
- 1.62% ✓
- Cap rate
- 5.43%
- Cash-on-cash
- -3.09%
- DSCR
- 0.86
- GRM
- 5.1
CMA / ARV
No comps found within radius.
Projected returns pro-forma
10.0% appreciation · 0.85% rent growth · sell at horizon
- IRR
- 20.9%
- Equity multiple
- 2.67×
- Total profit
- $47,804
- Equity at exit
- $91,890
- IRR
- 18.2%
- Equity multiple
- 5.86×
- Total profit
- $138,839
- Equity at exit
- $198,164
Cash invested: $28,560 (down + closing). Projections, not guarantees.
Landlord ↔ Tenant lean methodology
- Overall (STATE)
- 87 Strongly Landlord-Friendly
- State Florida
- 87 Strongly Landlord-Friendly · R+3
- County
- — inherits STATE
- City
- — inherits STATE
ZIP-level market 33411
- Home prices YoY
- 1.9%
- Rents YoY
- 0.8%
- Active inventory
- 574
- Price-to-rent
- 5.1×
Monthly cashflow live
- Estimated rent
- $1,652 medium interval (Pro) →
- Mortgage (P&I)
- −$535
- Tax from tax record
- −$122 /mo · $1,460/yr
- Insurance
- −$42
- HOA
- −$680
- Vacancy / Maint / Mgmt
- −$347
- Net cashflow
- $-74
Break-even live
UW: 25.0% down · 7.5% · 30yr · 1.5% tax · 5.0% vac · 8.0% maint · 8.0% mgmt
Financing live
Cash to close
- Down payment
- $25,500
- Closing costs
- $3,060
- Reserves months
- —
- Total cash needed
- —
Loan-product check · same deal, 3 products live
Conventional
25% down · 7.5% · 30yr
- Down + closing
- —
- Monthly P&I
- —
- Monthly cashflow
- —
- DSCR
- —
- Eligible?
- —
Personal DTI + credit; lowest rate.
DSCR
20% down · 8.5% · 30yr
- Down + closing
- —
- Monthly P&I
- —
- Monthly cashflow
- —
- DSCR
- —
- Eligible?
- —
No personal income docs; deal must DSCR.
Hard money
10% down · 12.0% · 12mo
- Down + closing
- —
- Monthly P&I
- —
- Monthly cashflow
- —
- DSCR
- —
- Eligible?
- —
Short-term bridge; refi at stabilization.
Rent comps 4 comps
| Address | Beds | Baths | Sqft | Rent | $/sqft | DOM | Units | Dist |
|---|---|---|---|---|---|---|---|---|
| 149 West Ct Royal Palm Beach, FL | 1.0 | 1.0 | 648 | $1,800 | $2.78 | 10d | 1 | 0.07mi |
| 12009 Poinciana Blvd #102 Royal Palm Beach, FL | 1.0 | 1.0 | 660 | $1,500 | $2.27 | 24d | 1 | 0.08mi |
| 12021 W Greenway Dr #101 Royal Palm Beach, FL | 1.0 | 1.5 | 660 | $1,400 | $2.12 | 24d | 1 | 0.12mi |
| 11020 Town Cir Wellington, FL | 1.0–3.0 | 1.0–2.0 | 1013 | $2,146 | $2.12 | 1d | 14 | 1.42mi |
HOA detail condo
- Monthly dues
- $680 · $8,160/yr
- Likely covers
- pool
- Assessments
- None detected in remarks — confirm with the listing agent.
Listing history 49 events
-
2026-06-18days on market $102,000 Active 36 DOM
-
2026-06-17days on market $102,000 Active 35 DOM
-
2026-06-16days on market $102,000 Active 34 DOM
-
2026-06-15days on market $102,000 Active 33 DOM
-
2026-06-13days on market $102,000 Active 31 DOM
-
2026-06-09days on market $102,000 Active 27 DOM
-
2026-06-08remarks 505-char remark
-
2026-06-08pricedays on market $102,000 Active 26 DOM
-
2026-06-07days on market $105,259 Active 25 DOM
-
2026-06-04days on market $105,259 Active 22 DOM
-
2026-06-03days on market $105,259 Active 21 DOM
-
2026-06-02days on market $105,259 Active 20 DOM
-
2026-06-01days on market $105,259 Active 19 DOM
-
2026-05-31days on market $105,259 Active 18 DOM
-
2026-05-15status Active
-
2026-04-27historical
-
2026-04-25$105,259 Active
-
2025-12-11historical
-
2025-09-29price $89,900
-
2025-09-03price $99,900
-
2025-05-12$109,900 Active
-
2025-05-10historical
-
2025-02-16historical
-
2025-01-17historical
-
2025-01-17$110,000 Active
-
2024-11-25historical Active Under Contract
-
2024-10-18price $110,000
-
2024-09-11status Active
-
2024-09-11historical
-
2024-08-01price $125,000
-
2024-04-12$135,000 Active
-
2023-10-27historical
-
2023-10-27status Active
-
2023-09-27historical Active Under Contract
-
2023-08-24$135,000 Active
-
2014-10-19historical
-
2011-06-21soldstatus $25,000
-
2011-06-15soldstatus $25,000
-
2011-06-01historical
-
2010-11-05$24,900
-
2010-10-16historical
-
2009-10-16$34,900
-
2005-10-28$121,000
-
2000-03-21soldstatus $26,000
-
2000-03-17soldstatus $26,000
-
2000-03-14historical
-
1999-11-02$29,900
-
1986-04-01soldstatus $29,000
-
1983-05-01soldstatus $33,600
ⓘ Source: listings_history table (triggers on properties + properties_extension) + one-shot
backfill from property_details.listing_events for pre-trigger history.
Tax reassessment forecast FL · Resets to sale price
- Current annual tax
- $1,460 · $122/mo
- Projected year-2 tax
- $1,460 · $122/mo
- Expected delta
- $0/yr ($0/mo · 0.0%)
ⓘ Screening estimate from a state-policy table — verify with the county assessor before closing.
Climate risk First Street
- Flood 1/10 Low FEMA zone X (unshaded) · 0% chance over 30 yrs
- Wildfire 1/10 Low
- Heat 10/10 Extreme 7 d/yr ≥107°F today · 25 d/yr by 30 yrs out
- Wind 10/10 Extreme 99% chance of damaging wind over 30 yrs
- Air quality 2/10 Low 0 unhealthy d/yr today · 1 by 30 yrs out
Nearby sold comps map
Loading sold comps map…
Walkable amenities ~0.75 mi
Loading nearby amenities…
Taxation est. · year 1
- Rental income
- $19,830
- − Mortgage interest
- −$5,714
- − Property taxes
- −$1,460
- − Insurance
- −$510
- − Repairs & maintenance
- −$1,586
- − Management
- −$1,586
- − HOA
- −$8,160
- − Depreciation
- −$2,967
- Taxable loss
- −$2,154
- Est. tax savings @ 24.0%
- +$517
- After-tax cash flow
- $-366/yr
For passive investors: Depreciation is non-cash, so a rental often shows a tax loss while cash-flowing — sheltering income. Rental losses are passive: they offset passive income freely, and up to $25,000/yr can offset ordinary (W-2) income if you actively participate and your MAGI is under $100k (phasing out to $0 by $150k); unused losses carry forward. On sale, claimed depreciation is recaptured at up to 25%, and gains may owe capital-gains tax (a 1031 exchange can defer both). Figures are a year-1 estimate at your 24.0% rate — not tax advice; consult a CPA.
Schools (NCES district)
- District
- Palm Beach
- NCES district ID
- 1201500
- Math proficiency
- 46% ▼ -16.00%
- Reading proficiency
- 53% ▼ -4.00%
- Median HH income
- $53,943
- Composite
- 42.72/100
- National rank
- #3160
- State rank
- #34 of 73 in FL
Livability — Royal Palm Beach
- Score
- 79/100
- State rank
- #135
- US rank
- #2039
Category grades
Schools grade is shown separately in the Schools card above.
Census & demographics
- Census place
- Royal Palm Beach, FL
- County
- Palm Beach County · 1,438,312 people
- City population
- 222,012
- Metro
- Miami-Fort Lauderdale-Pompano Beach, FL
- Population (ZIP)
- 76,863
- Household income
- $92,591
- Rent vs Own
- Severe rent burden
- 1870.0
Population outlook (Palm Beach County) Hauer SSP2
- Today (2025)
- 1,637,487 people
- By 2030
- 1,743,255 · +6.5%
- By 2040
- 1,948,712 · +19.0%
- By 2050
- 2,132,979 · +30.3%
- By 2075
- 2,530,027 · +54.5%
- By 2100
- 2,706,979 · +65.3%
Race, ethnicity, and origin ACS 2023
- Neighborhood character
- Diverse neighborhood (Simpson 0.70)
- Race & ethnicity
- White 44% Hispanic / Latino 24% Black 23% Two or more races 16% Asian 5%
- Hispanic origin (detail)
- Mexican 2% Puerto Rican 5% Cuban 4% Dominican 2%
- Common ancestry
- Hispanic 6% Romanian 2% Italian 1%
- Foreign-born
- 26% · Canada, Jamaica, China
- Languages at home
- 73% English-only · Spanish 17% French/Haitian/Cajun 4% Other Indo-European 2%
Political lean MEDSL · Palm Beach
- 2024 margin
- Toss-up / Even · D 50.0% · R 49.2%
- 2008→2024 swing
- -22.1pp toward R · 2008: 22.9pp · 2024: 0.8pp
- All cycles
- 2024: D+0.8 2020: D+12.8 2016: D+15.3 2012: D+17.0 2008: D+22.9
Not yet ingested
- Civics
- —
Market trends
- HPI YoY
- ▲ 17.04%
- Current HPI
- 903.78
- Rent YoY
- ▲ 0.85%
- Metro
- Miami-Fort Lauderdale-Pompano Beach, FL
- State GDP YoY
- ▲ 3.28%
- F500 in state
- 36
Industry mix (Fortune 500 HQ in FL)
| Industry | F500 HQs | Revenue |
|---|---|---|
| Industrial Technology | 2 | $29B |
|
||
| Insurance | 2 | $17B |
|
||
| Retail | 1 | $60B |
|
||
| Technology Distribution | 1 | $58B |
|
||
| Homebuilding | 1 | $35B |
|
||
| Technology Manufacturing | 1 | $35B |
|
||
Price history
+213.3% since first listed35 events — show timeline
- 2026-05-15 Relisted — Beaches MLS
- 2026-04-27 Listing Removed — Beaches MLS
- 2026-04-25 Listed $105,259 Beaches MLS
- 2025-12-11 Listing Removed — Beaches MLS
- 2025-09-29 Price Changed $89,900 Beaches MLS
- 2025-09-03 Price Changed $99,900 Beaches MLS
- 2025-05-12 Listed $109,900 Beaches MLS
- 2025-05-10 Coming Soon — Beaches MLS
- 2025-02-16 Listing Removed — Beaches MLS
- 2025-01-17 Listing Removed — Beaches MLS
- 2025-01-17 Listed $110,000 Beaches MLS
- 2024-11-25 Contingent — Beaches MLS
- 2024-10-18 Price Changed $110,000 Beaches MLS
- 2024-09-11 Relisted — Beaches MLS
- 2024-09-11 Listing Removed — Beaches MLS
- 2024-08-01 Price Changed $125,000 Beaches MLS
- 2024-04-12 Listed $135,000 Beaches MLS
- 2023-10-27 Listing Removed — Beaches MLS
- 2023-10-27 Relisted — Beaches MLS
- 2023-09-27 Contingent — Beaches MLS
- 2023-08-24 Listed $135,000 Beaches MLS
- 2014-10-19 Listing Removed — Beaches MLS
- 2011-06-21 Sold (Public Records) $25,000 Public Records
- 2011-06-15 Sold (MLS) $25,000 Beaches MLS
- 2011-06-01 Listing Removed — Beaches MLS
- 2010-11-05 Listed $24,900 Beaches MLS
- 2010-10-16 Listing Removed — Beaches MLS
- 2009-10-16 Listed $34,900 Beaches MLS
- 2005-10-28 Listed $121,000 Beaches MLS
- 2000-03-21 Sold (Public Records) $26,000 Public Records
- 2000-03-17 Sold (MLS) $26,000 Beaches MLS
- 2000-03-14 Listing Removed — Beaches MLS
- 1999-11-02 Listed $29,900 Beaches MLS
- 1986-04-01 Sold (Public Records) $29,000 Public Records
- 1983-05-01 Sold (Public Records) $33,600 Public Records
Property tax history
+7.1%/yrLatest (2025): $1,460 · +5.0% YoY. Source: county tax records.
Cash-flow waterfall
monthlySold comps — $/sqft
last 12 mo · ≤1 miLoading sold comps…