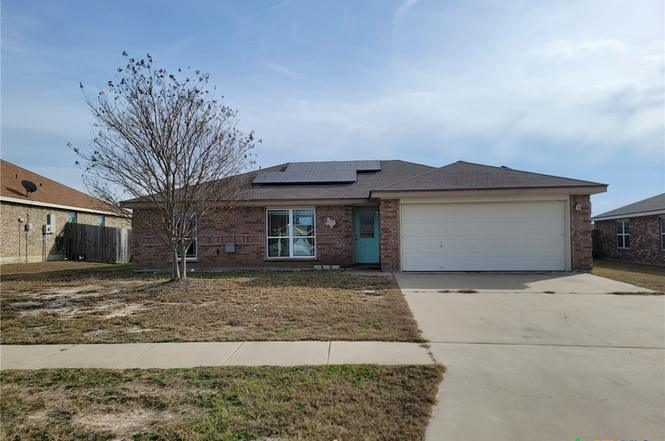
3505 Logsdon St · Copperas Cove, TX
Flood risk 1/10 · Minimal
- FEMA flood zone
- X
- Chance of flooding over 30 yrs
- 0.0%
- Est. flood insurance / yr
- $507 – $1,088
Fire risk 6/10 · Moderate
- Est. fire insurance / yr
- $1,222 – $2,270
Heat risk 8/10 · Major
- Hot days now (above 106°F)
- 7 days/yr
- Hot days in 30 yrs
- 26 days/yr
Wind risk 6/10 · Moderate
- Chance of severe wind over 30 yrs
- 54.0%
Air-quality risk 1/10 · Minimal
- Unhealthy air days now
- 0 days/yr
- Unhealthy air days in 30 yrs
- 0 days/yr
Risk factors via First Street. Map © Google.
Why this score? — see what drove the D+ grade
The composite is a weighted blend of 9 inputs, each scored 0–100. Each bar is that input's sub-score; the figure is the points it added to the 100-point composite (weight × sub-score).
- ARV discount +15.0/15.0
- Cash flow +11.9/30.0
- 1% rule +5.1/10.0
- Schools +3.8/10.0
- DSCR +3.5/10.0
- Livability +3.2/5.0
- Condition / age +2.5/5.0
- Rent growth +2.4/5.0
- Appreciation +0.0/10.0
$165,000
🖨 Deal sheet (PDF) 📄 Offer letter ✓ Due diligence
Listing remarks
Ask about $100 down program, HUD homes are sold AS IS. HUD case number 513-254553, Lovely 3 bedroom, 2 bathroom home in the Skyline subdivision offering 1,557 sqft of space. Open floorplan concept, The living room is open to the breakfast/dining area. Family room features electric fireplace with custom surround mantel, The kitchen includes a full complement of appliances and a pantry. The master suite offers a dual vanity, walk in closet, and garden style tub. Enjoy the energy efficiency this home has to offer with solar panels!
Key facts
- Pantry
- Dual vanity
- Electric fireplace
Tags
Neighborhood map
What this means for you Summary
Snapshot
- This is a 3-bed/2.0-bath single-family listed at $165k.
Deal economics
- At list price, monthly cash flow is $-42 ($-502/yr) — negative.
- To cash-flow at today's rent, offer at most $158k (4.5% below list).
- Meets the 1% rule at list price ($2k rent vs $165k).
- Recommended offer: $155k (6.0% below list) — sets the bar for market timing.
- Cap rate 6.0% vs local median 3.5% in Copperas Cove — top-decile yield for the area; either an underpriced asset or a hidden risk that comps aren't pricing in. Stress-test before assuming the spread holds.
Location & tenants
- Location reads 65/100 on livability (#706 in TX) — a middle-class / working-renter tenant base. Strengths: cost of living A+, housing A+; Watch: employment D+, amenities F, commute F.
- Lampasas ISD (rural): math 42% / reading 46% proficiency, ranked #278 of 826 in TX (top 34%) — families likely to look elsewhere, expect single-tenant / working-renter base with shorter leases.
- Zoned schools: Taylor Creek El (math 30% / reading 32%, grade F, #2,429 of 4,322 statewide, top 57%, 527 students, 54% FRL); Lampasas Middle (math 45% / reading 47%, grade D+, #462 of 1,662 statewide, top 28%, 800 students, 52% FRL); Lampasas H S (math 36% / reading 55%, grade D-, #634 of 1,632 statewide, top 39%, 1,095 students, 45% FRL).
- Market conditions: Rents soft (-0.2%/yr); 610 active listings in the ZIP; 9 comparable units currently listed for rent nearby; rentals lingering (median 46d on market — plan ~5-8 weeks vacancy on turnover, expect pricing pressure); 56% of comp listings sitting > 30 days — soft ceiling on asking rent; 18 units permitted in Lampasas County in 2024 (0 in 5+ unit buildings).
Forward outlook
- Local home prices are declining (-3.0%/yr); year-one equity from $1k of loan paydown is wiped out by about $5k of value loss. Plan a longer hold.
- Lampasas County population projected at +10% by 2050 — modest demand growth; plan on rents tracking national, not racing it.
Negotiation context
- It's been on market 88 days — a 6% lower offer ($155k) is reasonable based on typical stale-listing flexibility.
- 4 sale attempts since 14y ago; this cycle's ask has dropped $76k (32%) from the opening price — seller is motivated, your offer sets the floor, not the list.
Risks & watch-outs
- Watch-outs: property tax is 3.1% of price.
- Climate carrying-cost: major wind risk, 54% chance of damaging wind over 30y; major wildfire risk; extreme-heat days projected 7→26/yr by 2055 (HVAC capex compounding) — expect insurance premiums to compound above CPI over the hold.
Questions for the listing agent
- What do current leases actually rent for vs. the listed asking? Can we see a recent rent roll and the last 12 months of T-12 income?
- It's been on market 88 days. Have you received any prior offers? Is the seller open to a 6% concession, seller financing, or rate buy-down credit?
- Property tax is high relative to price — has the assessment been appealed recently, and will the sale trigger a re-assessment?
- Why hasn't it sold? Are there any deal-killer items the seller is aware of (foundation, flood, title, zoning, code violations)?
- Is there a deadline driving the sale (1031 exchange, divorce, estate, relocation)? That informs how much negotiation room exists.
- The area grade is low — what's the realistic commute time and amenity access for the typical tenant pool here? Any planned neighborhood developments (good or bad) we should know about?
- What's the average days-on-market for RENTAL listings here right now (not sales)? A rising rental-DOM trend means longer vacancies and softer asking-rent achievability than the comps imply.
- What's the recent tenant-quality profile in this submarket — average credit score on applications, eviction rate, late-payment / NSF rate, and stable-employment percentage? A property-management company in the area should have these aggregated.
- How much new for-sale + rental construction is in the pipeline within 1–3 miles? Heavy new supply typically softens prices + rents 12–24 months out; constrained supply supports both.
Investment metrics
- 1% rule
- 1.01% ✓
- Cap rate
- 5.99%
- Cash-on-cash
- -1.09%
- DSCR
- 0.95
- GRM
- 8.3
CMA / ARV
- ARV (on-the-fly)
- $228,879
- Comps found
- 10
Show comp detail 10 sales within ~0.75 mi
| Address | Dist | Beds/Ba | Sqft | Sold | Price | $/sf | Match |
|---|---|---|---|---|---|---|---|
| 3505 Logsdon St | 0.00mi | 3/2.0 | 1,557 (0%) | 1mo | $158,500 | $102 | 99 |
| 3433 Plateau St | 0.18mi | 4/2.0 (+1) | 1,746 (+12%) | 1mo | $248,000 | $142 | 66 |
| 3401 Lucas St | 0.55mi | 4/2.0 (+1) | 1,539 (-1%) | 3mo | $223,000 | $145 | 65 |
| 2511 Heartland Ave | 0.16mi | 4/2.0 (+1) | 1,769 (+14%) | 2mo | $259,900 | $147 | 64 |
| 2710 Settlement Rd | 0.09mi | 4/2.0 (+1) | 1,769 (+14%) | 7mo | $259,900 | $147 | 62 |
| 2749 Settlement Rd | 0.22mi | 4/2.0 (+1) | 1,628 (+5%) | 21mo | $250,000 | $154 | 60 |
| 3508 Lucas St | 0.59mi | 4/2.0 (+1) | 1,656 (+6%) | 6mo | $239,000 | $144 | 52 |
| 3434 Horizon St | 0.26mi | 4/2.0 (+1) | 1,770 (+14%) | 11mo | $251,600 | $142 | 51 |
| 3402 Lauren St | 0.63mi | 4/2.0 (+1) | 1,772 (+14%) | 5mo | $267,000 | $151 | 38 |
| 3408 Lucas St | 0.58mi | 4/2.0 (+1) | 1,691 (+9%) | 23mo | $250,000 | $148 | 34 |
Match score weights: distance 35% · size 25% · config 20% · recency 20%. Top-matched comps best support the ARV.
Projected returns pro-forma
-3.0% appreciation · 0.0% rent growth · sell at horizon
- IRR
- -22.1%
- Equity multiple
- 0.26×
- Total profit
- $-34,114
- Equity at exit
- $24,602
- IRR
- -28.6%
- Equity multiple
- -0.11×
- Total profit
- $-51,317
- Equity at exit
- $14,266
Cash invested: $46,200 (down + closing). Projections, not guarantees.
Landlord ↔ Tenant lean methodology
- Overall (STATE)
- 87 Strongly Landlord-Friendly
- State Texas
- 87 Strongly Landlord-Friendly · R+5
- County
- — inherits STATE
- City
- — inherits STATE
ZIP-level market 76522
- Home prices YoY
- -22.4%
- Rents YoY
- -0.2%
- Active inventory
- 610
- Price-to-rent
- 8.3×
Monthly cashflow live
- Estimated rent
- $1,661 high interval (Pro) →
- Mortgage (P&I)
- −$865
- Tax from tax record
- −$420 /mo · $5,044/yr
- Insurance
- −$69
- HOA
- −$0
- Vacancy / Maint / Mgmt
- −$349
- Net cashflow
- $-42
Break-even live
Sensitivity live
| Price | -10% $52 | -5% $5 | +0% $-42 | +5% $-89 | +10% $-135 |
|---|---|---|---|---|---|
| Rent | -10% $-173 | -5% $-107 | +0% $-42 | +5% $24 | +10% $89 |
| Rate | -1.0pp $41 | -0.5pp $0 | base $-42 | +0.5pp $-85 | +1.0pp $-128 |
UW: 25.0% down · 7.5% · 30yr · 1.5% tax · 5.0% vac · 8.0% maint · 8.0% mgmt
Financing live
Cash to close
- Down payment
- $41,250
- Closing costs
- $4,950
- Reserves months
- —
- Total cash needed
- —
Loan-product check · same deal, 3 products live
Conventional
25% down · 7.5% · 30yr
- Down + closing
- —
- Monthly P&I
- —
- Monthly cashflow
- —
- DSCR
- —
- Eligible?
- —
Personal DTI + credit; lowest rate.
DSCR
20% down · 8.5% · 30yr
- Down + closing
- —
- Monthly P&I
- —
- Monthly cashflow
- —
- DSCR
- —
- Eligible?
- —
No personal income docs; deal must DSCR.
Hard money
10% down · 12.0% · 12mo
- Down + closing
- —
- Monthly P&I
- —
- Monthly cashflow
- —
- DSCR
- —
- Eligible?
- —
Short-term bridge; refi at stabilization.
Rent comps 9 comps
| Address | Beds | Baths | Sqft | Rent | $/sqft | DOM | Units | Dist |
|---|---|---|---|---|---|---|---|---|
| 3410 Plateau St Copperas Cove, TX | 4.0 | 2.0 | 1720 | $1,795 | $1.04 | 16d | 1 | 0.19mi |
| 2813 Settlement Rd Copperas Cove, TX | 4.0 | 2.0 | 1536 | $1,550 | $1.01 | 16d | 1 | 0.25mi |
| 3507 Jacob St Copperas Cove, TX | 4.0 | 2.0 | 1794 | $1,800 | $1.00 | 46d | 1 | 0.49mi |
| 3517 Settlement Rd Copperas Cove, TX | 3.0 | 2.0 | 1788 | $1,695 | $0.95 | 46d | 1 | 0.52mi |
| 3404 Jacob St Copperas Cove, TX | 4.0 | 2.0 | 1977 | $1,700 | $0.86 | 46d | 1 | 0.52mi |
| 3004 Sundown Ln Copperas Cove, TX | 4.0 | 2.0 | 1608 | $1,895 | $1.18 | 25d | 1 | 0.80mi |
| 507 Skyline Dr Copperas Cove, TX | 3.0 | 2.0 | 1889 | $2,200 | $1.16 | 46d | 1 | 0.81mi |
| 1122 Rhonda Lee St Copperas Cove, TX | 3.0 | 2.0 | 1349 | $1,300 | $0.96 | 25d | 1 | 1.12mi |
| 1217 Craig St Copperas Cove, TX | 3.0 | 2.0 | 1341 | $1,575 | $1.17 | 46d | 1 | 1.21mi |
Listing history 14 events
-
2026-04-21status Pending
-
2026-04-13price $165,000
-
2026-03-16price $183,500
-
2026-02-26price $204,850
-
2026-01-23$241,000 Active
-
2025-12-30soldstatus
-
2022-09-27soldstatus
-
2022-08-26status Pending
-
2022-08-24price $225,000
-
2022-08-13status Active
-
2022-07-18status Pending
-
2022-07-15$235,000 Active
-
2019-09-06soldstatus
-
2012-04-16$104,900
ⓘ Source: listings_history table (triggers on properties + properties_extension) + one-shot
backfill from property_details.listing_events for pre-trigger history.
Tax reassessment forecast TX · Resets to sale price
- Current annual tax
- $5,044 · $420/mo
- Projected year-2 tax
- $5,044 · $420/mo
- Expected delta
- $0/yr ($0/mo · 0.0%)
ⓘ Screening estimate from a state-policy table — verify with the county assessor before closing.
Climate risk First Street
- Flood 1/10 Low FEMA zone X · 0% chance over 30 yrs
- Wildfire 6/10 Major
- Heat 8/10 Severe 7 d/yr ≥106°F today · 26 d/yr by 30 yrs out
- Wind 6/10 Major 54% chance of damaging wind over 30 yrs
- Air quality 1/10 Low 0 unhealthy d/yr today · 0 by 30 yrs out
Nearby sold comps map
Loading sold comps map…
Walkable amenities ~0.75 mi
Loading nearby amenities…
Taxation est. · year 1
- Rental income
- $19,937
- − Mortgage interest
- −$9,243
- − Property taxes
- −$5,044
- − Insurance
- −$825
- − Repairs & maintenance
- −$1,595
- − Management
- −$1,595
- − Depreciation
- −$4,800
- Taxable loss
- −$3,164
- Est. tax savings @ 24.0%
- +$759
- After-tax cash flow
- $257/yr
For passive investors: Depreciation is non-cash, so a rental often shows a tax loss while cash-flowing — sheltering income. Rental losses are passive: they offset passive income freely, and up to $25,000/yr can offset ordinary (W-2) income if you actively participate and your MAGI is under $100k (phasing out to $0 by $150k); unused losses carry forward. On sale, claimed depreciation is recaptured at up to 25%, and gains may owe capital-gains tax (a 1031 exchange can defer both). Figures are a year-1 estimate at your 24.0% rate — not tax advice; consult a CPA.
Schools (NCES district)
- District
- Lampasas ISD
- NCES district ID
- 4826640
- Math proficiency
- 42% ▼ -3.00%
- Reading proficiency
- 46% ▬ 0.00%
- Median HH income
- $51,042
- Composite
- 37.9/100
- National rank
- #4314
- State rank
- #278 of 826 in TX
Livability — Copperas Cove
- Score
- 65/100
- State rank
- #706
- US rank
- #13158
Category grades
Schools grade is shown separately in the Schools card above.
Census & demographics
- Census place
- Copperas Cove, TX
- County
- Coryell County · 61,053 people
- City population
- 42,118
- Metro
- Killeen-Temple, TX
- Population (ZIP)
- 42,118
- Household income
- $72,206
- Rent vs Own
- Severe rent burden
- 1019.0
Population outlook (Lampasas County) Hauer SSP2
- Today (2025)
- 22,114 people
- By 2030
- 22,779 · +3.0%
- By 2040
- 23,812 · +7.7%
- By 2050
- 24,403 · +10.4%
- By 2075
- 25,713 · +16.3%
- By 2100
- 25,053 · +13.3%
Race, ethnicity, and origin ACS 2023
- Neighborhood character
- Diverse neighborhood (Simpson 0.66)
- Race & ethnicity
- White 53% Hispanic / Latino 21% Two or more races 20% Black 14% Asian 2%
- Hispanic origin (detail)
- Mexican 11% Puerto Rican 6%
- Common ancestry
- Romanian 2% Italian 2% Lithuanian 2%
- Foreign-born
- 7% · Canada, South Korea
- Languages at home
- 85% English-only · Spanish 10% German/W. Germanic 2% Other Asian/Pacific 1%
Political lean MEDSL · Lampasas
- 2024 margin
- Solid R (+59.6) · D 19.8% · R 79.3%
- 2008→2024 swing
- -10.5pp toward R · 2008: -49.1pp · 2024: -59.6pp
- All cycles
- 2024: R+59.6 2020: R+57.1 2016: R+60.0 2012: R+57.8 2008: R+49.1
Not yet ingested
- Civics
- —
Market trends
- HPI YoY
- ▼ -53.11%
- Current HPI
- 183.9452
- Rent YoY
- ▼ -0.25%
- Metro
- Killeen-Temple, TX
- State GDP YoY
- ▲ 3.95%
- F500 in state
- 110
Industry mix (Fortune 500 HQ in TX)
| Industry | F500 HQs | Revenue |
|---|---|---|
| Energy | 16 | $1,198B |
|
||
| Technology | 5 | $198B |
|
||
| Engineering / Construction | 4 | $72B |
|
||
| Energy Services | 3 | $60B |
|
||
| Utilities | 3 | $41B |
|
||
| Healthcare | 2 | $330B |
|
||
Price history
+57.3% since first listed14 events — show timeline
- 2026-04-21 Pending — CTXMLS
- 2026-04-13 Price Changed $165,000 CTXMLS
- 2026-03-16 Price Changed $183,500 CTXMLS
- 2026-02-26 Price Changed $204,850 CTXMLS
- 2026-01-23 Listed $241,000 CTXMLS
- 2025-12-30 Sold (Public Records) — Public Records
- 2022-09-27 Sold (Public Records) — Public Records
- 2022-08-26 Pending — CTXMLS
- 2022-08-24 Price Changed $225,000 CTXMLS
- 2022-08-13 Relisted — CTXMLS
- 2022-07-18 Pending — CTXMLS
- 2022-07-15 Listed $235,000 CTXMLS
- 2019-09-06 Sold (Public Records) — Public Records
- 2012-04-16 Listed $104,900 CTXMLS
Property tax history
+3.8%/yrLatest (2025): $5,044 · +0.7% YoY. Source: county tax records.
Cash-flow waterfall
monthlySold comps — $/sqft
last 12 mo · ≤1 miLoading sold comps…