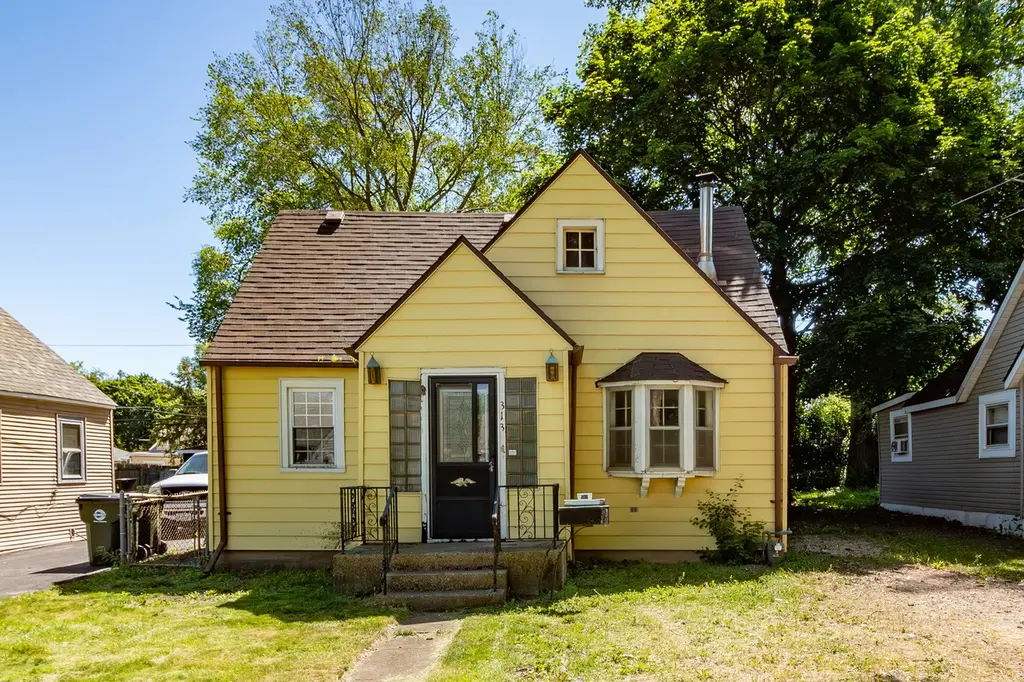
313 Highmoor Dr · Round Lake Park, IL
Flood risk 1/10 · Minimal
- FEMA flood zone
- X (unshaded)
- Chance of flooding over 30 yrs
- 0.0%
- Est. flood insurance / yr
- $507 – $1,088
Fire risk 1/10 · Minimal
- Est. fire insurance / yr
- $804 – $1,492
Heat risk 2/10 · Minimal
- Hot days now (above 100°F)
- 7 days/yr
- Hot days in 30 yrs
- 14 days/yr
Wind risk 2/10 · Minimal
- Chance of severe wind over 30 yrs
- —
Air-quality risk 3/10 · Minor
- Unhealthy air days now
- 2 days/yr
- Unhealthy air days in 30 yrs
- 3 days/yr
Risk factors via First Street. Map © Google.
Why this score? — see what drove the B+ grade
The composite is a weighted blend of 9 inputs, each scored 0–100. Each bar is that input's sub-score; the figure is the points it added to the 100-point composite (weight × sub-score).
- Cash flow +30.0/30.0
- ARV discount +15.0/15.0
- 1% rule +10.0/10.0
- DSCR +10.0/10.0
- Livability +3.5/5.0
- Rent growth +3.2/5.0
- Condition / age +2.5/5.0
- Schools +1.0/10.0
- Appreciation +0.0/10.0
$130,000
🖨 Deal sheet (PDF) 📄 Offer letter ✓ Due diligence
Listing remarks
* * MULTIPLE OFFERS RECEIVED * * HIGHEST AND BEST DUE BY 12PM ON FRIDAY, JUNE 5TH. Opportunity knocks in Round Lake Park! This 3-bedroom, 1-bath home is ready for your vision and offers incredible potential for investors or rehabbers looking to bring it back to life. The main level features a living room with a wood-burning stove, a primary bedroom and a full bathroom. A convenient laundry room sits just off the kitchen and leads to the backyard, where you'll find a detached garage. Upstairs, you'll find two additional bedrooms, providing a flexible layout for future design possibilities. With solid bones and a functional floor plan, this property is the perfect canvas for a full renovat
Key facts
- Flexible layout
- Wood burning stove
- Detached garage
Tags
Property features AI
Finance
- Other: Possession at closing; Earnest money required; Directions provided to property
- HOA & community: No master association fee required
Exterior
- Parking: Detached garage (owned), 2 parking spaces, 2 garage spaces
- Utilities: Public water; Public sewer
- Home design: Detached single-family home; 1.5-story design; Fee simple ownership; Built before 1978
- Construction: Aluminum siding; 81–90 years old
- Exterior features: Lot dimensions approximately 40 x 104.7 x 40 x 104.7; Less than 0.25 acre
Interior
- Kitchen: Kitchen on main level (approx. 9 x 11)
- Bedrooms: 3 bedrooms (master on main level; other bedrooms on second level)
- Bathrooms: 1 full bathroom
- Heating & cooling: Natural gas forced air heating; Window air conditioning units
- Interior features: 6 total rooms; Crawl space basement; School bus service
- Laundry & utility: In-unit laundry (main level, approx. 8 x 11)
Neighborhood map
What this means for you Summary
Snapshot
- This is a 2-bed/1.0-bath single-family listed at $130k.
Deal economics
- At list price, monthly cash flow is $703 ($8k/yr) — positive.
- The deal already cash-flows at list — no discount required.
- Meets the 1% rule at list price ($2k rent vs $130k).
- Cap rate 12.8% vs local median 4.5% in Round Lake Park — top-decile yield for the area; either an underpriced asset or a hidden risk that comps aren't pricing in. Stress-test before assuming the spread holds.
Location & tenants
- Location reads 69/100 on livability (#422 in IL) — a middle-class / working-renter tenant base. Strengths: crime A+, cost of living A+, housing A+; Watch: amenities F, employment D-.
- Round Lake CUSD 116 (suburban): math 7% / reading 14% proficiency, ranked #560 of 620 in IL (top 90%) — low school quality limits family demand, transient renter base, plan for 1-2y turnover; 67% free/reduced lunch — lower-income household profile, screen leases tightly.
- Zoned schools: W J Murphy Elem School (math 8% / reading 17%, grade F, #1,371 of 2,056 statewide, top 68%, 454 students, 0% FRL); Magee Middle School (math 8% / reading 21%, grade F, #517 of 665 statewide, top 79%, 673 students, 0% FRL); Round Lake Senior High School (math 9% / reading 13%, grade F, #522 of 693 statewide, top 76%, 2,258 students, 0% FRL) — zoned schools average 0% FRL vs 67% district-wide (67 pts lower); this property's tenant base skews higher-income than the district average.
- Market conditions: Rents rising (+2.9%/yr); 97 active listings in the ZIP; 1 comparable units currently listed for rent nearby; solid renter incomes; 948 units permitted in Lake County in 2024 (424 in 5+ unit buildings).
Forward outlook
- Local home prices are declining (-3.0%/yr); year-one equity from $899 of loan paydown is wiped out by about $4k of value loss. Plan a longer hold.
- Lake County population projected to shrink 8% by 2050 — rents likely to lag national; underwrite the cash flow, not the appreciation.
- At projected returns (-3.0% appreciation + 2.9% rent growth), your $36k cash investment doubles in ~6 years — after that, you're playing with house money.
Negotiation context
- Only 8 days on market — expect competitive offers; lowballing is unlikely to land.
Risks & watch-outs
- Watch-outs: built in 1938 — expect roof / HVAC / electrical / plumbing capex.
Questions for the listing agent
- Built in 1938 — when were the roof, HVAC, electrical panel, plumbing, and water heater last replaced?
- Is there a deadline driving the sale (1031 exchange, divorce, estate, relocation)? That informs how much negotiation room exists.
- Schools are F-rated, which usually means shorter tenancies and higher turnover. Who's the typical renter profile here, and what's been the actual vacancy rate?
- What's the average days-on-market for RENTAL listings here right now (not sales)? A rising rental-DOM trend means longer vacancies and softer asking-rent achievability than the comps imply.
- What's the recent tenant-quality profile in this submarket — average credit score on applications, eviction rate, late-payment / NSF rate, and stable-employment percentage? A property-management company in the area should have these aggregated.
- How much new for-sale + rental construction is in the pipeline within 1–3 miles? Heavy new supply typically softens prices + rents 12–24 months out; constrained supply supports both.
Investment metrics
- 1% rule
- 1.55% ✓
- Cap rate
- 12.78%
- Cash-on-cash
- 23.17%
- DSCR
- 2.03
- GRM
- 5.4
CMA / ARV
- ARV (on-the-fly)
- $201,480
- Comps found
- 12
Show comp detail 12 sales within ~0.75 mi
| Address | Dist | Beds/Ba | Sqft | Sold | Price | $/sf | Match |
|---|---|---|---|---|---|---|---|
| 313 Highmoor Dr | 0.00mi | 3/1.0 (+1) | 920 (0%) | 0mo | $130,000 | $141 | 95 |
| 328 Clifton Dr | 0.10mi | 3/2.0 (+1) | 936 (+2%) | 4mo | $180,000 | $192 | 80 |
| 116 Highmoor Dr | 0.26mi | 2/1.0 | 968 (+5%) | 3mo | $207,000 | $214 | 77 |
| 304 E Willow Dr | 0.21mi | 2/1.0 | 960 (+4%) | 7mo | $200,000 | $208 | 77 |
| 408 Bellevue Dr | 0.11mi | 3/2.0 (+1) | 959 (+4%) | 8mo | $245,000 | $255 | 72 |
| 415 Kenwood Dr | 0.16mi | 3/1.0 (+1) | 1,000 (+9%) | 4mo | $227,000 | $227 | 70 |
| 519 Catalpa Dr | 0.41mi | 3/1.0 (+1) | 974 (+6%) | 8mo | $190,000 | $195 | 60 |
| 532 N Prospect Dr | 0.36mi | 2/1.0 | 1,050 (+14%) | 0mo | $240,000 | $229 | 59 |
| 536 Arbor Dr | 0.44mi | 3/1.0 (+1) | 864 (-6%) | 8mo | $260,000 | $301 | 58 |
| 426 Alpine Dr | 0.58mi | 3/1.0 (+1) | 957 (+4%) | 4mo | $185,000 | $193 | 58 |
| 114 Clifton Dr | 0.27mi | 3/1.0 (+1) | 800 (-13%) | 6mo | $175,000 | $219 | 56 |
| 123 E Pineview Dr | 0.33mi | 3/1.0 (+1) | 788 (-14%) | 8mo | $190,000 | $241 | 50 |
Match score weights: distance 35% · size 25% · config 20% · recency 20%. Top-matched comps best support the ARV.
Projected returns pro-forma
-3.0% appreciation · 2.87% rent growth · sell at horizon
- IRR
- 16.0%
- Equity multiple
- 1.64×
- Total profit
- $23,466
- Equity at exit
- $19,383
- IRR
- 24.6%
- Equity multiple
- 3.12×
- Total profit
- $77,105
- Equity at exit
- $11,240
Cash invested: $36,400 (down + closing). Projections, not guarantees.
Landlord ↔ Tenant lean methodology
- Overall (STATE)
- 43 Moderately Tenant-Leaning
- State Illinois
- 43 Moderately Tenant-Leaning · D+7
- County
- — inherits STATE
- City
- — inherits STATE
ZIP-level market 60073
- Rents YoY
- 2.9%
- Active inventory
- 97
- Price-to-rent
- 5.4×
Monthly cashflow live
- Estimated rent
- $2,016 medium interval (Pro) →
- Mortgage (P&I)
- −$682
- Tax from tax record
- −$154 /mo · $1,845/yr
- Insurance
- −$54
- HOA
- −$0
- Vacancy / Maint / Mgmt
- −$423
- Net cashflow
- $703
Break-even live
Sensitivity live
| Price | -10% $777 | -5% $740 | +0% $703 | +5% $666 | +10% $629 |
|---|---|---|---|---|---|
| Rent | -10% $544 | -5% $623 | +0% $703 | +5% $783 | +10% $862 |
| Rate | -1.0pp $768 | -0.5pp $736 | base $703 | +0.5pp $669 | +1.0pp $635 |
UW: 25.0% down · 7.5% · 30yr · 1.5% tax · 5.0% vac · 8.0% maint · 8.0% mgmt
Financing live
Cash to close
- Down payment
- $32,500
- Closing costs
- $3,900
- Reserves months
- —
- Total cash needed
- —
Loan-product check · same deal, 3 products live
Conventional
25% down · 7.5% · 30yr
- Down + closing
- —
- Monthly P&I
- —
- Monthly cashflow
- —
- DSCR
- —
- Eligible?
- —
Personal DTI + credit; lowest rate.
DSCR
20% down · 8.5% · 30yr
- Down + closing
- —
- Monthly P&I
- —
- Monthly cashflow
- —
- DSCR
- —
- Eligible?
- —
No personal income docs; deal must DSCR.
Hard money
10% down · 12.0% · 12mo
- Down + closing
- —
- Monthly P&I
- —
- Monthly cashflow
- —
- DSCR
- —
- Eligible?
- —
Short-term bridge; refi at stabilization.
Rent comps 1 comps
| Address | Beds | Baths | Sqft | Rent | $/sqft | DOM | Units | Dist |
|---|---|---|---|---|---|---|---|---|
| 426 Alpine Dr Round Lake, IL | 3.0 | 1.0 | 957 | $2,000 | $2.09 | 6d | 1 | 0.56mi |
Listing history 6 events
-
2026-06-13statusdays on market $130,000 Pending 8 DOM
-
2026-06-09days on market $130,000 Contingent - Continue to Show 6 DOM
-
2026-06-08days on market $130,000 Contingent - Continue to Show 5 DOM
-
2026-06-07statusdays on market $130,000 Contingent - Continue to Show 4 DOM
-
2026-06-03remarks 699-char remark
-
2026-06-03$130,000 Active 1 DOM
ⓘ Source: listings_history table (triggers on properties + properties_extension) + one-shot
backfill from property_details.listing_events for pre-trigger history.
Tax reassessment forecast IL · Partial reset (capped growth)
- Current annual tax
- $1,845 · $154/mo
- Projected year-2 tax
- $2,398 · $200/mo
- Expected delta
- +$553/yr (+$46/mo · 30.0%)
ⓘ Screening estimate from a state-policy table — verify with the county assessor before closing.
Climate risk First Street
- Flood 1/10 Low FEMA zone X (unshaded) · 0% chance over 30 yrs
- Wildfire 1/10 Low
- Heat 2/10 Low 7 d/yr ≥100°F today · 14 d/yr by 30 yrs out
- Wind 2/10 Low
- Air quality 3/10 Moderate 2 unhealthy d/yr today · 3 by 30 yrs out
Nearby sold comps map
Loading sold comps map…
Walkable amenities ~0.75 mi
Loading nearby amenities…
Taxation est. · year 1
- Rental income
- $24,191
- − Mortgage interest
- −$7,282
- − Property taxes
- −$1,845
- − Insurance
- −$650
- − Repairs & maintenance
- −$1,935
- − Management
- −$1,935
- − Depreciation
- −$3,782
- Taxable income
- $6,762
- Est. tax owed @ 24.0%
- −$1,623
- After-tax cash flow
- $6,812/yr
For passive investors: Depreciation is non-cash, so a rental often shows a tax loss while cash-flowing — sheltering income. Rental losses are passive: they offset passive income freely, and up to $25,000/yr can offset ordinary (W-2) income if you actively participate and your MAGI is under $100k (phasing out to $0 by $150k); unused losses carry forward. On sale, claimed depreciation is recaptured at up to 25%, and gains may owe capital-gains tax (a 1031 exchange can defer both). Figures are a year-1 estimate at your 24.0% rate — not tax advice; consult a CPA.
Schools (NCES district)
- District
- Round Lake CUSD 116
- NCES district ID
- 1734990
- Math proficiency
- 7% ▼ -6.00%
- Reading proficiency
- 14% ▼ -2.00%
- Median HH income
- $53,477
- Composite
- 10.35/100
- National rank
- #9789
- State rank
- #560 of 620 in IL
Livability — Round Lake Park
- Score
- 69/100
- State rank
- #422
- US rank
- #8626
Category grades
Schools grade is shown separately in the Schools card above.
Census & demographics
- Census place
- Round Lake Park, IL
- County
- Lake County · 591,991 people
- Metro
- Chicago-Naperville-Elgin, IL-IN-WI
- Population (ZIP)
- 62,868
- Household income
- $98,514
- Rent vs Own
- Severe rent burden
- 1225.0
Population outlook (Lake County) Hauer SSP2
- Today (2025)
- 700,217 people
- By 2030
- 693,290 · -1.0%
- By 2040
- 673,588 · -3.8%
- By 2050
- 643,556 · -8.1%
- By 2075
- 562,792 · -19.6%
- By 2100
- 457,715 · -34.6%
Race, ethnicity, and origin ACS 2023
- Neighborhood character
- Diverse neighborhood (Simpson 0.63)
- Race & ethnicity
- Hispanic / Latino 45% White 40% Two or more races 20% Asian 7% Black 4% Native American 2%
- Hispanic origin (detail)
- Mexican 37% Puerto Rican 3%
- Common ancestry
- Romanian 8% Portuguese 1% Lithuanian 1%
- Foreign-born
- 25% · Canada, South Korea, Vietnam
- Languages at home
- 56% English-only · Spanish 35% Russian/Polish/Slavic 2% Other Indo-European 2%
Political lean MEDSL · Lake
- 2024 margin
- Strong D (+20.8) · D 59.7% · R 38.9% · Other 1.4%
- 2008→2024 swing
- +1.1pp toward D · 2008: 19.6pp · 2024: 20.8pp
- All cycles
- 2024: D+20.8 2020: D+24.1 2016: D+20.3 2012: D+8.1 2008: D+19.6
Not yet ingested
- Civics
- —
Market trends
- HPI YoY
- ▼ -140.95%
- Current HPI
- 229.1762
- Rent YoY
- ▲ 2.87%
- Metro
- Chicago-Naperville-Elgin, IL-IN-WI
- State GDP YoY
- ▲ 1.59%
- F500 in state
- 60
Industry mix (Fortune 500 HQ in IL)
| Industry | F500 HQs | Revenue |
|---|---|---|
| Insurance | 4 | $201B |
|
||
| Consumer Goods | 4 | $87B |
|
||
| Industrial Machinery | 3 | $64B |
|
||
| Healthcare | 2 | $55B |
|
||
| Retail / Pharmacy | 1 | $148B |
|
||
| Agriculture / Food | 1 | $86B |
|
||
Price history
1 event — show timeline
- 2026-06-03 Listed $130,000 MRED as Distributed by MLS Grid
Property tax history
-0.3%/yrLatest (2023): $1,845 · +321.8% YoY. Source: county tax records.
Cash-flow waterfall
monthlySold comps — $/sqft
last 12 mo · ≤1 miLoading sold comps…