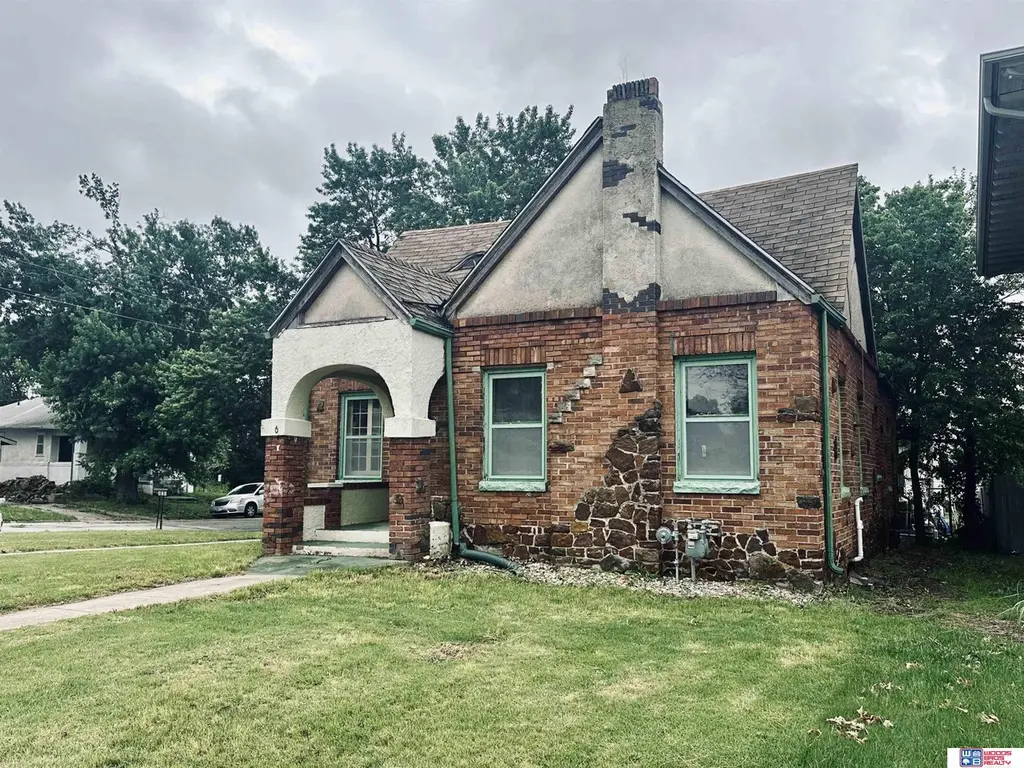
826 5th St · Fairbury, NE
Flood risk 1/10 · Minimal
- FEMA flood zone
- X (unshaded)
- Chance of flooding over 30 yrs
- 0.0%
- Est. flood insurance / yr
- $473 – $860
Fire risk 6/10 · Moderate
- Est. fire insurance / yr
- $1,161 – $2,155
Heat risk 4/10 · Minor
- Hot days now (above 106°F)
- 7 days/yr
- Hot days in 30 yrs
- 16 days/yr
Wind risk 2/10 · Minimal
- Chance of severe wind over 30 yrs
- —
Air-quality risk 1/10 · Minimal
- Unhealthy air days now
- 0 days/yr
- Unhealthy air days in 30 yrs
- 0 days/yr
Risk factors via First Street. Map © Google.
Why this score? — see what drove the B+ grade
The composite is a weighted blend of 9 inputs, each scored 0–100. Each bar is that input's sub-score; the figure is the points it added to the 100-point composite (weight × sub-score).
- Cash flow +30.0/30.0
- ARV discount +15.0/15.0
- 1% rule +10.0/10.0
- DSCR +10.0/10.0
- Livability +3.7/5.0
- Schools +3.2/10.0
- Rent growth +2.5/5.0
- Condition / age +2.5/5.0
- Appreciation +0.0/10.0
$49,900
🖨 Deal sheet 📄 Offer letter ✓ Due diligence
Listing remarks MLS
This home has very good curb appeal. The corner lot setting is attractive. The home interior needs some TLC but the structure of the home is solid. The roof will require some repair. This is a fixer upper with significant potential.
Key facts
- 4,100 sq ft lot
- Built 1940
- Listed 27 days
Property features AI
Exterior
- Parking: No garage
- Utilities: Electricity available; Natural gas available; Water available (public and private listed); Sewer available; Electric on property
- Home design: Single-family residence; One-and-one-half story; Not new / not a model
- Construction: Built in 1940; Stucco and brick exterior; Composition roof; Brick/mortar foundation (other listed as well)
- Exterior features: Front porch; Lot approximately 50' x 82' (about 0.094 acre); Lot up to 1/4 acre
Interior
- Kitchen: Kitchen on main floor (approx. 9' x 13'); Refrigerator
- Bedrooms: Main floor primary bedroom (approx. 12.2' x 15.3'); Second-floor bedroom (approx. 9.7' x 14')
- Flooring: Carpet; Wood
- Bathrooms: Two bathrooms total: one full and one half; At least one main-level bathroom
- Heating & cooling: Natural gas heating; Forced air
- Interior features: Unfinished basement; Refrigerator included; Carpet and wood flooring; No fireplaces
Neighborhood map
What this means for you Summary
Snapshot
- This is a 2-bed/1.5-bath single-family listed at $50k.
Deal economics
- At list price, monthly cash flow is $313 ($4k/yr) — positive.
- The deal already cash-flows at list — no discount required.
- Meets the 1% rule at list price ($850 rent vs $50k).
- Recommended offer: $49k (1.5% below list) — sets the bar for market timing.
- Cap rate 13.8% vs local median 4.6% in Fairbury — top-decile yield for the area; either an underpriced asset or a hidden risk that comps aren't pricing in. Stress-test before assuming the spread holds.
Location & tenants
- Location reads 74/100 on livability (#125 in NE, #4,843 nationally) — a middle-class / working-renter tenant base. Strengths: cost of living A+, housing A+, health & safety A+; Watch: employment D+, amenities F, commute F.
- Fairbury Public Schools (town): math 39% / reading 37% proficiency, ranked #101 of 111 in NE (top 91%) — families likely to look elsewhere, expect single-tenant / working-renter base with shorter leases.
- Zoned schools: Central Elementary School (262 students, 56% FRL); Fairbury Jr-Sr High School (math 42% / reading 42%, grade F, #176 of 261 statewide, top 68%, 377 students, 55% FRL) — zoned schools average 55% FRL vs 39% district-wide (16 pts higher); higher-poverty schools than district average — tighter screening recommended.
- Market conditions: 36 active listings in the ZIP; 1 comparable units currently listed for rent nearby; 9 units permitted in Jefferson County in 2024 (0 in 5+ unit buildings).
Forward outlook
- Local home prices are declining (-3.0%/yr); year-one equity from $345 of loan paydown is wiped out by about $1k of value loss. Plan a longer hold.
- Jefferson County population projected to shrink 6% by 2050 — rents likely to lag national; underwrite the cash flow, not the appreciation.
- At projected returns (-3.0% appreciation + 3.0% rent growth), your $14k cash investment doubles in ~5 years — after that, you're playing with house money.
Negotiation context
- It's been on market 27 days — a 2% lower offer ($49k) is reasonable based on typical stale-listing flexibility.
- 3 sale attempts since 12y ago with the ask held roughly flat each time — persistent listings suggest the price (not the market) is what's stuck; bring a comps-based counter.
- Current owner paid $3k; list at $50k implies a 1783% gain — meaningful room to come down on a strong offer.
Risks & watch-outs
- Watch-outs: built in 1940 — expect roof / HVAC / electrical / plumbing capex.
- Climate carrying-cost: major wildfire risk — expect insurance premiums to compound above CPI over the hold.
Questions for the listing agent
- Built in 1940 — when were the roof, HVAC, electrical panel, plumbing, and water heater last replaced?
- Is there a deadline driving the sale (1031 exchange, divorce, estate, relocation)? That informs how much negotiation room exists.
- Schools are D-rated, which usually means shorter tenancies and higher turnover. Who's the typical renter profile here, and what's been the actual vacancy rate?
- What's the average days-on-market for RENTAL listings here right now (not sales)? A rising rental-DOM trend means longer vacancies and softer asking-rent achievability than the comps imply.
- What's the recent tenant-quality profile in this submarket — average credit score on applications, eviction rate, late-payment / NSF rate, and stable-employment percentage? A property-management company in the area should have these aggregated.
- How much new for-sale + rental construction is in the pipeline within 1–3 miles? Heavy new supply typically softens prices + rents 12–24 months out; constrained supply supports both.
Investment metrics
- 1% rule
- 1.70% ✓
- Cap rate
- 13.82%
- Cash-on-cash
- 26.86%
- DSCR
- 2.20
- GRM
- 4.9
CMA / ARV
- ARV (on-the-fly)
- $93,240
- Comps found
- 12
Show comp detail 12 sales within ~0.75 mi
| Address | Dist | Beds/Ba | Sqft | Sold | Price | $/sf | Match |
|---|---|---|---|---|---|---|---|
| 920 4th St | 0.09mi | 2/2.0 | 1,120 (+1%) | 2mo | $180,000 | $161 | 91 |
| 1106 7th St | 0.25mi | 2/1.0 | 1,094 (-1%) | 7mo | $89,000 | $81 | 78 |
| 728 Mcdowell St | 0.34mi | 2/1.5 | 1,156 (+4%) | 7mo | $152,000 | $131 | 72 |
| 1229 3rd St | 0.32mi | 2/1.0 | 1,072 (-3%) | 12mo | $90,000 | $84 | 67 |
| 101 5th St | 0.56mi | 2/1.0 | 1,134 (+2%) | 1mo | $80,000 | $71 | 67 |
| 1112 D St | 0.63mi | 2/1.0 | 1,082 (-2%) | 1mo | $40,000 | $37 | 63 |
| 724 G St | 0.26mi | 2/1.0 | 984 (-11%) | 9mo | $68,000 | $69 | 59 |
| 902 A St | 0.65mi | 3/2.0 (+1) | 1,144 (+3%) | 5mo | $50,000 | $44 | 54 |
| 1027 F St | 0.53mi | 2/1.0 | 1,176 (+6%) | 14mo | $130,000 | $111 | 52 |
| 925 9th St | 0.34mi | 3/1.0 (+1) | 1,204 (+8%) | 14mo | $99,000 | $82 | 52 |
| 1212 C St | 0.73mi | 2/1.0 | 952 (-14%) | 7mo | $83,000 | $87 | 34 |
| 1313 H St | 0.69mi | 3/3.0 (+1) | 1,212 (+9%) | 13mo | $220,000 | $182 | 31 |
Match score weights: distance 35% · size 25% · config 20% · recency 20%. Top-matched comps best support the ARV.
Projected returns pro-forma
-3.0% appreciation · 3.0% rent growth · sell at horizon
- IRR
- 20.8%
- Equity multiple
- 1.85×
- Total profit
- $11,857
- Equity at exit
- $7,440
- IRR
- 29.0%
- Equity multiple
- 3.58×
- Total profit
- $36,065
- Equity at exit
- $4,314
Cash invested: $13,972 (down + closing). Projections, not guarantees.
Landlord ↔ Tenant lean methodology
- Overall (STATE)
- 83 Strongly Landlord-Friendly
- State Nebraska
- 83 Strongly Landlord-Friendly · R+13
- County
- — inherits STATE
- City
- — inherits STATE
ZIP-level market 68352
- Home prices YoY
- -9.9%
- Active inventory
- 36
- Price-to-rent
- 4.9×
Monthly cashflow live
- Estimated rent
- $850 medium interval (Pro) →
- Mortgage (P&I)
- −$262
- Tax from tax record
- −$76 /mo · $915/yr
- Insurance
- −$21
- HOA
- −$0
- Vacancy / Maint / Mgmt
- −$178
- Net cashflow
- $313
Break-even live
UW: 25.0% down · 7.5% · 30yr · 1.5% tax · 5.0% vac · 8.0% maint · 8.0% mgmt
Financing live
Cash to close
- Down payment
- $12,475
- Closing costs
- $1,497
- Reserves months
- —
- Total cash needed
- —
Loan-product check · same deal, 3 products live
Conventional
25% down · 7.5% · 30yr
- Down + closing
- —
- Monthly P&I
- —
- Monthly cashflow
- —
- DSCR
- —
- Eligible?
- —
Personal DTI + credit; lowest rate.
DSCR
20% down · 8.5% · 30yr
- Down + closing
- —
- Monthly P&I
- —
- Monthly cashflow
- —
- DSCR
- —
- Eligible?
- —
No personal income docs; deal must DSCR.
Hard money
10% down · 12.0% · 12mo
- Down + closing
- —
- Monthly P&I
- —
- Monthly cashflow
- —
- DSCR
- —
- Eligible?
- —
Short-term bridge; refi at stabilization.
Rent comps 1 comps
| Address | Beds | Baths | Sqft | Rent | $/sqft | DOM | Units | Dist |
|---|---|---|---|---|---|---|---|---|
| 1011 K St Unit STREET-301 Fairbury, NE | 2.0 | 1.5 | 1088 | $850 | $0.78 | 44d | 1 | 0.46mi |
Listing history 19 events
-
2026-06-18days on market $49,900 Active 27 DOM
-
2026-06-17days on market $49,900 Active 26 DOM
-
2026-06-16days on market $49,900 Active 25 DOM
-
2026-06-15days on market $49,900 Active 24 DOM
-
2026-06-13days on market $49,900 Active 22 DOM
-
2026-06-12days on market $49,900 Active 21 DOM
-
2026-06-09days on market $49,900 Active 18 DOM
-
2026-06-08days on market $49,900 Active 17 DOM
-
2026-06-07days on market $49,900 Active 16 DOM
-
2026-06-05days on market $49,900 Active 14 DOM
-
2026-06-04days on market $49,900 Active 12 DOM
-
2026-06-02days on market $49,900 Active 11 DOM
-
2026-06-01days on market $49,900 Active 10 DOM
-
2026-05-31days on market $49,900 Active 9 DOM
-
2026-05-22$49,900 New
-
2014-10-07soldstatus $2,650 232-char remark
Show marketing remark (232 chars)
This home has very good curb appeal. The corner lot setting is attractive. The home interior needs some TLC but the structure of the home is solid. The roof will require some repair. This is a fixer upper with significant potential.
-
2014-04-29$6,500 232-char remark
Show marketing remark (232 chars)
This home has very good curb appeal. The corner lot setting is attractive. The home interior needs some TLC but the structure of the home is solid. The roof will require some repair. This is a fixer upper with significant potential.
-
2014-03-13$6,500 232-char remark
Show marketing remark (232 chars)
This home has very good curb appeal. The corner lot setting is attractive. The home interior needs some TLC but the structure of the home is solid. The roof will require some repair. This is a fixer upper with significant potential.
ⓘ Source: listings_history table (triggers on properties + properties_extension) + one-shot
backfill from property_details.listing_events for pre-trigger history.
Tax reassessment forecast NE · Resets to sale price
- Current annual tax
- $915 · $76/mo
- Projected year-2 tax
- $915 · $76/mo
- Expected delta
- $0/yr ($0/mo · 0.0%)
ⓘ Screening estimate from a state-policy table — verify with the county assessor before closing.
Climate risk First Street
- Flood 1/10 Low FEMA zone X (unshaded) · 0% chance over 30 yrs
- Wildfire 6/10 Major
- Heat 4/10 Moderate 7 d/yr ≥106°F today · 16 d/yr by 30 yrs out
- Wind 2/10 Low
- Air quality 1/10 Low 0 unhealthy d/yr today · 0 by 30 yrs out
Nearby sold comps map
Loading sold comps map…
Walkable amenities ~0.75 mi
Loading nearby amenities…
Taxation est. · year 1
- Rental income
- $10,200
- − Mortgage interest
- −$2,795
- − Property taxes
- −$915
- − Insurance
- −$250
- − Repairs & maintenance
- −$816
- − Management
- −$816
- − Depreciation
- −$1,452
- Taxable income
- $3,157
- Est. tax owed @ 24.0%
- −$758
- After-tax cash flow
- $2,996/yr
For passive investors: Depreciation is non-cash, so a rental often shows a tax loss while cash-flowing — sheltering income. Rental losses are passive: they offset passive income freely, and up to $25,000/yr can offset ordinary (W-2) income if you actively participate and your MAGI is under $100k (phasing out to $0 by $150k); unused losses carry forward. On sale, claimed depreciation is recaptured at up to 25%, and gains may owe capital-gains tax (a 1031 exchange can defer both). Figures are a year-1 estimate at your 24.0% rate — not tax advice; consult a CPA.
Schools (NCES district)
- District
- Fairbury Public Schools
- NCES district ID
- 3170440
- Math proficiency
- 39% ▼ -13.00%
- Reading proficiency
- 37% ▲ 4.00%
- Median HH income
- $40,800
- Composite
- 31.97/100
- National rank
- #5842
- State rank
- #101 of 111 in NE
Livability — Fairbury
- Score
- 74/100
- State rank
- #125
- US rank
- #4843
Category grades
Schools grade is shown separately in the Schools card above.
Census & demographics
- Census place
- Fairbury, NE
- Population (ZIP)
- 4,897
Population outlook (Jefferson County) Hauer SSP2
- Today (2025)
- 6,961 people
- By 2030
- 6,831 · -1.9%
- By 2040
- 6,590 · -5.3%
- By 2050
- 6,510 · -6.5%
- By 2075
- 6,831 · -1.9%
- By 2100
- 7,072 · +1.6%
Race, ethnicity, and origin ACS 2023
- Neighborhood character
- Predominantly White (88%)
- Race & ethnicity
- White 88% Hispanic / Latino 7% Two or more races 6%
- Hispanic origin (detail)
- Mexican 5%
- Common ancestry
- Lithuanian 3% Iranian 1% Italian 1%
- Foreign-born
- 2% · Canada
- Languages at home
- 95% English-only · Spanish 4% German/W. Germanic 1%
Political lean MEDSL · Jefferson
- 2024 margin
- Solid R (+45.3) · D 26.7% · R 72.0% · Other 1.4%
- 2008→2024 swing
- -29.6pp toward R · 2008: -15.8pp · 2024: -45.3pp
- All cycles
- 2024: R+45.3 2020: R+42.9 2016: R+45.4 2012: R+28.4 2008: R+15.8
Not yet ingested
- Civics
- —
Market trends
- HPI YoY
- ▼ -25.22%
- Current HPI
- 229.7519
- Rent YoY
- —
- Metro
- —
- State GDP YoY
- ▲ 0.68%
- F500 in state
- 2
Industry mix (Fortune 500 HQ in NE)
| Industry | F500 HQs | Revenue |
|---|---|---|
| Conglomerate | 1 | $371B |
|
||
Price history
+667.7% since first listed5 events — show timeline
- 2026-05-22 Listed $49,900 GPRMLS
- 2014-10-07 Sold (MLS) $2,650 GPRMLS
- 2014-10-07 Sold (MLS) $2,650 GPRMLS
- 2014-04-29 Listed $6,500 GPRMLS
- 2014-03-13 Listed $6,500 GPRMLS
Property tax history
+2.8%/yrLatest (2025): $915 · -8.2% YoY. Source: county tax records.
Cash-flow waterfall
monthlySold comps — $/sqft
last 12 mo · ≤1 miLoading sold comps…