 Duplex
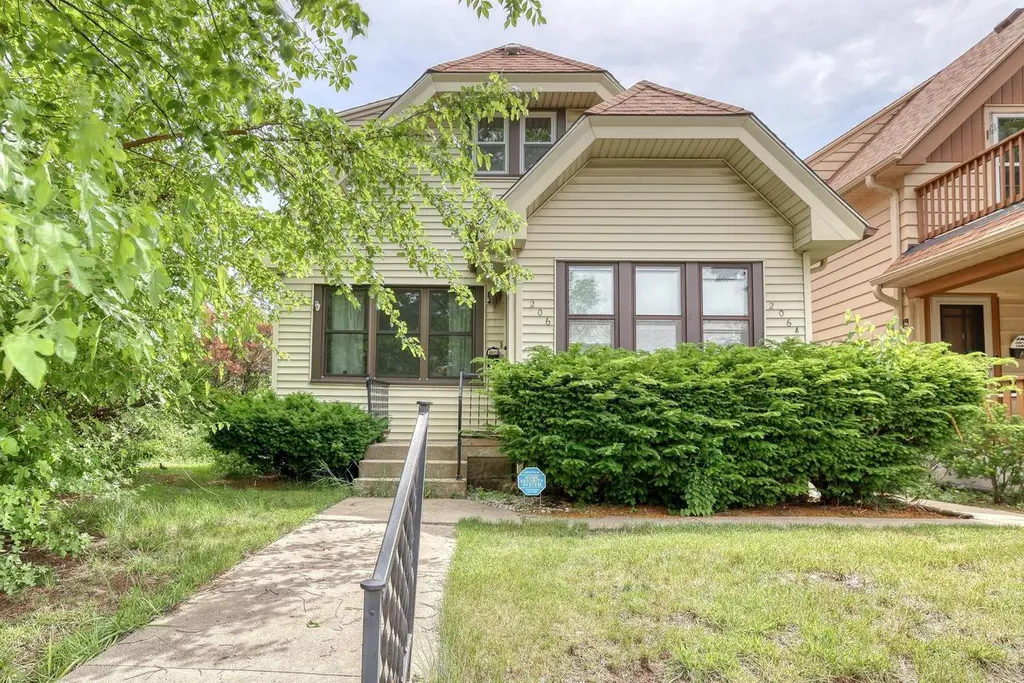
206 N 68th St · Milwaukee, WI
Flood risk 1/10 · Minimal
- FEMA flood zone
- X (unshaded)
- Chance of flooding over 30 yrs
- 0.0%
- Est. flood insurance / yr
- $473 – $860
Fire risk 1/10 · Minimal
- Est. fire insurance / yr
- $636 – $1,182
Heat risk 2/10 · Minimal
- Hot days now (above 99°F)
- 7 days/yr
- Hot days in 30 yrs
- 13 days/yr
Wind risk 2/10 · Minimal
- Chance of severe wind over 30 yrs
- —
Air-quality risk 2/10 · Minimal
- Unhealthy air days now
- 1 days/yr
- Unhealthy air days in 30 yrs
- 1 days/yr
Risk factors via First Street. Map © Google.
Why this score? — see what drove the B- grade
The composite is a weighted blend of 9 inputs, each scored 0–100. Each bar is that input's sub-score; the figure is the points it added to the 100-point composite (weight × sub-score).
- Cash flow +30.0/30.0
- 1% rule +10.0/10.0
- DSCR +10.0/10.0
- ARV discount +5.3/15.0
- Rent growth +4.0/5.0
- Livability +4.0/5.0
- Condition / age +2.5/5.0
- Schools +1.2/10.0
- Appreciation +0.0/10.0
$285,000
🖨 Deal sheet 📄 Offer letter ✓ Due diligence
Multi-family units
County records classify this as Multi-Family (2-4 Unit). Listing-text estimate: 2 units. confirmed
Listing remarks
Spectacular opportunity to own a turn key 2/1 1/1 Bluemound Heights duplex, just a stones throw from all that Tosa downtown offers! Management is a breeze with this well upgraded exterior from vinyl siding, aluminum wrapping, and new windows! Updates include new vinyl replacement windows, quartz countertops, new sinks and faucets kitchen, freshly painted, refinished HWFs, new lvp, cabinet hardware, some lighting, and more! Plenty of storage space in the basement. 3 car parking pad in back. Owners shed, fenced in yard and concrete slab for patio space. Get it while its hot!
Key facts
- Quartz countertops
- Turn key duplex
- Upgraded exterior
Tags
Property features AI
Finance
- Other: Lot size less than 1/2 acre (approx. 0.09 acre)
- Financial info: Property contains 2 units
Exterior
- Parking: 1 parking space
- Utilities: Municipal water; Municipal sewer; 2 electric meters; 2 gas meters
- Home design: 2-story duplex; Multi-family property; Zoning: RT3
- Construction: Information source: Assessor/Public Record (year built not specified)
- Exterior features: Aluminum trim and vinyl exterior
Interior
- Kitchen: Unit 2 kitchen located on upper level (approx. 15 x 9); Stoves and refrigerators included (2 each); Range hood included
- Bedrooms: Unit 1: 2 bedrooms; Unit 2: 1 bedroom (master on upper level, approx. 10 x 11)
- Bathrooms: Unit 1: 1 full bathroom; Unit 2: 1 full bathroom
- Interior features: Full block basement
- Laundry & utility: Washer and dryer included (shared or in-unit configuration not specified)
Neighborhood map
What this means for you Summary
Snapshot
- This is a 2 × 3-bed/2.0-bath units multifamily listed at $285k.
Deal economics
- At list price, monthly cash flow is $2k ($21k/yr) — positive. Per door: $874/mo.
- The deal already cash-flows at list — no discount required.
- Meets the 1% rule at list price ($5k rent vs $285k).
- Cap rate 13.7% vs local median 5.1% in Milwaukee — top-decile yield for the area; either an underpriced asset or a hidden risk that comps aren't pricing in. Stress-test before assuming the spread holds.
Location & tenants
- Location reads 81/100 on livability (#55 in WI, #1,534 nationally) — a professional / high-income tenant draw. Strengths: amenities A+, commute A+, cost of living A+; Watch: employment D+, schools F, crime F.
- Milwaukee School District (urban): math 10% / reading 18% proficiency, ranked #337 of 342 in WI (top 98%) — low school quality limits family demand, transient renter base, plan for 1-2y turnover; 77% free/reduced lunch — lower-income household profile, screen leases tightly.
- Market conditions: Rents rising fast (+5.9%/yr); 53 active listings in the ZIP; 34 comparable units currently listed for rent nearby; rentals at typical pace (median 14d on market — plan ~3-4 weeks tenant-placement turnaround); solid renter incomes; 1,017 units permitted in Milwaukee County in 2024 (803 in 5+ unit buildings).
- At $4,616/mo this rent would consume 54% of the median local household income ($102k/yr) (locally 774% of renters already pay >50% of income on rent) — very limited rent-growth headroom before tenants either downsize or default.
Forward outlook
- Local home prices are declining (-3.0%/yr); year-one equity from $2k of loan paydown is wiped out by about $9k of value loss. Plan a longer hold.
- Milwaukee County population projected at +4% by 2050 — modest demand growth; plan on rents tracking national, not racing it.
- At projected returns (-3.0% appreciation + 5.9% rent growth), your $80k cash investment doubles in ~5 years — after that, you're playing with house money.
Negotiation context
- Only 7 days on market — expect competitive offers; lowballing is unlikely to land.
- Current owner paid $245k; 16% above their basis — modest negotiation headroom, anchor on the comps not their cost.
Risks & watch-outs
- Watch-outs: built in 1926 — expect roof / HVAC / electrical / plumbing capex.
Questions for the listing agent
- Can we see the unit-by-unit rent roll, current vacancy, and any below-market leases? What's the average tenancy length?
- What capital expenditures (roof, boiler, parking lot, exteriors) have been made in the last 5 years, and what's planned in the next 2?
- Built in 1926 — when were the roof, HVAC, electrical panel, plumbing, and water heater last replaced?
- Is there a deadline driving the sale (1031 exchange, divorce, estate, relocation)? That informs how much negotiation room exists.
- Schools are F-rated, which usually means shorter tenancies and higher turnover. Who's the typical renter profile here, and what's been the actual vacancy rate?
- Crime grade is F in this area — have there been break-ins, vandalism, or insurance claims at this property in the last 3 years? What carrier currently insures it and at what premium?
- What's the average days-on-market for RENTAL listings here right now (not sales)? A rising rental-DOM trend means longer vacancies and softer asking-rent achievability than the comps imply.
- What's the recent tenant-quality profile in this submarket — average credit score on applications, eviction rate, late-payment / NSF rate, and stable-employment percentage? A property-management company in the area should have these aggregated.
- How much new apartment / multifamily construction is in the pipeline within 1–3 miles? Heavy new supply (>2% of stock underway) typically softens rents 12–24 months out; light construction supports rent growth.
Investment metrics
- 1% rule
- 1.62% ✓
- Cap rate
- 13.65%
- Cash-on-cash
- 26.28%
- DSCR
- 2.17
- GRM
- 5.1
CMA / ARV
- ARV (on-the-fly)
- $271,726
- Comps found
- 12
Show comp detail 12 sales within ~0.75 mi
| Address | Dist | Beds/Ba | Sqft | Sold | Price | $/sf | Match |
|---|---|---|---|---|---|---|---|
| 144 S 73rd St | 0.36mi | 4/2.0 (+1) | 1,578 (+6%) | 1mo | $305,000 | $193 | 68 |
| 214 N 73rd St | 0.32mi | 2/2.0 (-1) | 1,530 (+2%) | 13mo | $302,490 | $198 | 66 |
| 309 N 61st St | 0.42mi | 4/2.0 (+1) | 1,496 (+0%) | 14mo | $330,000 | $221 | 64 |
| 316 S 71st St | 0.35mi | 3/2.0 | 1,678 (+12%) | 2mo | $260,000 | $155 | 61 |
| 521 S 75th St | 0.65mi | 3/2.0 | 1,426 (-4%) | 3mo | $260,000 | $182 | 60 |
| 653 S 65th St | 0.60mi | 3/2.0 | 1,428 (-4%) | 8mo | $225,000 | $158 | 58 |
| 625 S 61st St | 0.68mi | 4/2.0 (+1) | 1,510 (+1%) | 13mo | $293,500 | $194 | 50 |
| 437 S 73rd St | 0.52mi | 3/2.0 | 1,314 (-12%) | 8mo | $250,000 | $190 | 49 |
| 447 S 72nd St | 0.49mi | 4/2.0 (+1) | 1,632 (+9%) | 14mo | $280,000 | $172 | 45 |
| 525 S 75th St | 0.65mi | 2/2.0 (-1) | 1,606 (+8%) | 12mo | $215,000 | $134 | 42 |
| 6926 Terrace Ct #6928 | 0.71mi | 3/2.0 | 1,664 (+12%) | 9mo | $300,000 | $180 | 41 |
| 212 S 77th St | 0.64mi | 3/2.0 | 1,710 (+14%) | 10mo | $275,000 | $161 | 38 |
Match score weights: distance 35% · size 25% · config 20% · recency 20%. Top-matched comps best support the ARV.
Projected returns pro-forma
-3.0% appreciation · 5.86% rent growth · sell at horizon
- IRR
- 23.2%
- Equity multiple
- 1.99×
- Total profit
- $78,809
- Equity at exit
- $42,494
- IRR
- 32.9%
- Equity multiple
- 4.40×
- Total profit
- $271,509
- Equity at exit
- $24,642
Cash invested: $79,800 (down + closing). Projections, not guarantees.
Landlord ↔ Tenant lean methodology
- Overall (STATE)
- 73 Landlord-Friendly
- State Wisconsin
- 73 Landlord-Friendly · R+2
- County
- — inherits STATE
- City
- — inherits STATE
ZIP-level market 53213
- Rents YoY
- 5.9%
- Active inventory
- 53
- Price-to-rent
- 10.3×
Monthly cashflow live
- Estimated rent
- $4,616 high interval (Pro) →
- Mortgage (P&I)
- −$1,495
- Tax from tax record
- −$286 /mo · $3,429/yr
- Insurance
- −$119
- HOA
- −$0
- Vacancy / Maint / Mgmt
- −$969
- Net cashflow
- $1,748
Break-even live
2-unit breakdown (identical units grouped — click to expand)
| Units | Beds | Baths | Est. rent |
|---|---|---|---|
| 2× units | 3 | 2 | $4,616 |
| #1 | 3 | 2 | $2,308 |
| #2 | 3 | 2 | $2,308 |
| Total (2 units) | $4,616 | ||
UW: 25.0% down · 7.5% · 30yr · 1.5% tax · 5.0% vac · 8.0% maint · 8.0% mgmt
Financing live
Cash to close
- Down payment
- $71,250
- Closing costs
- $8,550
- Reserves months
- —
- Total cash needed
- —
Loan-product check · same deal, 3 products live
Conventional
25% down · 7.5% · 30yr
- Down + closing
- —
- Monthly P&I
- —
- Monthly cashflow
- —
- DSCR
- —
- Eligible?
- —
Personal DTI + credit; lowest rate.
DSCR
20% down · 8.5% · 30yr
- Down + closing
- —
- Monthly P&I
- —
- Monthly cashflow
- —
- DSCR
- —
- Eligible?
- —
No personal income docs; deal must DSCR.
Hard money
10% down · 12.0% · 12mo
- Down + closing
- —
- Monthly P&I
- —
- Monthly cashflow
- —
- DSCR
- —
- Eligible?
- —
Short-term bridge; refi at stabilization.
Rent comps 34 comps
| Address | Beds | Baths | Sqft | Rent | $/sqft | DOM | Units | Dist |
|---|---|---|---|---|---|---|---|---|
| 515 N 65th St Milwaukee, WI | 2.0 | 1.0 | 1020 | $1,295 | $1.27 | 43d | 1 | 0.30mi |
| 7135 W Bluemound Rd Unit 7135 Milwaukee, WI | 2.0 | 1.0 | 950 | $1,350 | $1.42 | 19d | 1 | 0.30mi |
| 323A N 59th St Milwaukee, WI | 2.0 | 1.0 | 900 | $1,595 | $1.77 | 21d | 1 | 0.55mi |
| 638 S 66th St Milwaukee, WI | 3.0 | 1.0 | 1104 | $1,795 | $1.63 | 14d | 1 | 0.55mi |
| 642 S 66th St Milwaukee, WI | 3.0 | 1.0 | 1059 | $1,770 | $1.67 | 16d | 1 | 0.56mi |
| 8041 W Bluemound Rd Milwaukee, WI | 1.0–2.0 | 1.0–2.0 | 844 | $2,300 | $2.73 | 1d | 3 | 0.86mi |
| 5832 W Walker St Milwaukee, WI | 3.0 | 1.0 | 981 | $1,300 | $1.33 | 23d | 1 | 0.88mi |
| 6100 W State St Wauwatosa, WI | 1.0–3.0 | 1.0–2.0 | 1160 | $3,017 | $2.60 | 1d | 20 | 0.90mi |
| 1215 N 62nd St Wauwatosa, WI | 2.0 | 1.0–2.0 | 796 | $2,321 | $2.91 | 1d | 9 | 0.97mi |
| 1244 N 68th St Milwaukee, WI | 1.0–2.0 | 1.0–1.5 | 850 | $1,650 | $1.94 | 1d | 7 | 1.00mi |
| 1200 N 62nd St Milwaukee, WI | 1.0–2.0 | 1.0–2.0 | 899 | $2,343 | $2.60 | 1d | 14 | 1.02mi |
| 1301 S 63rd St Uppr -6307 West Allis, WI | 3.0 | 1.0 | 1150 | $1,650 | $1.43 | 23d | 1 | 1.06mi |
| 6400 W Greenfield Ave West Allis, WI | 2.0 | 1.0 | 950 | $2,148 | $2.26 | 1d | 3 | 1.13mi |
| 7400 W State St Milwaukee, WI | 1.0–3.0 | 1.0–2.0 | 1106 | $3,995 | $3.61 | 2d | 8 | 1.21mi |
| 6516 W National Ave Unit 6519-101 West Allis, WI | 2.0 | 2.0 | 1204 | $1,945 | $1.62 | 15d | 1 | 1.23mi |
| 6516 W National Ave Unit 6501-209 West Allis, WI | 2.0 | 2.0 | 1150 | $1,695 | $1.47 | 3d | 1 | 1.23mi |
| 6516 W National Ave Unit 1441-105 West Allis, WI | 2.0 | 2.0 | 1143 | $1,745 | $1.53 | 23d | 1 | 1.23mi |
| 6516 W National Ave Unit 1460-110 West Allis, WI | 2.0 | 1.0 | 1080 | $1,815 | $1.68 | 15d | 1 | 1.23mi |
| 6516 W National Ave Unit 6501-310 West Allis, WI | 2.0 | 2.0 | 1289 | $1,995 | $1.55 | 23d | 1 | 1.23mi |
| 6516 W National Ave Unit 1441-309 West Allis, WI | 2.0 | 2.0 | 1150 | $1,575 | $1.37 | 21d | 1 | 1.23mi |
| 6516 W National Ave Unit 1460-102 West Allis, WI | 2.0 | 2.0 | 1143 | $1,775 | $1.55 | 3d | 1 | 1.23mi |
| 6516 W National Ave Unit 6501-212 West Allis, WI | 2.0 | 2.0 | 1204 | $1,945 | $1.62 | 23d | 1 | 1.23mi |
| 4802 W Wells St Unit 4802-1 Milwaukee, WI | 3.0 | 2.0 | 1700 | $1,799 | $1.06 | 43d | 1 | 1.26mi |
| 7930 Harwood Ave Wauwatosa, WI | 1.0–2.0 | 1.0–2.0 | 1050 | $1,765 | $1.68 | 1d | 4 | 1.29mi |
| 7474 Harwood Ave Wauwatosa, WI | 3.0 | 1.0–3.0 | 999 | $4,780 | $4.78 | 2d | 73 | 1.34mi |
| 7313 Harwood Ave Milwaukee, WI | 2.0 | 1.0 | 1144 | $1,698 | $1.48 | 12d | 1 | 1.34mi |
| 185 N 90th St Milwaukee, WI | 3.0 | 1.5 | 1500 | $2,200 | $1.47 | 14d | 1 | 1.39mi |
| 1467 S 78th St Milwaukee, WI | 2.0 | 1.0 | 1000 | $1,500 | $1.50 | 11d | 1 | 1.39mi |
| 1553 S 75th St Unit 1553 West Allis, WI | 2.0 | 1.0 | 1008 | $1,595 | $1.58 | 3d | 1 | 1.41mi |
| 812 S 87th St Milwaukee, WI | 2.0 | 1.0 | 979 | $1,500 | $1.53 | 2d | 1 | 1.41mi |
| 1551 N 57th St Milwaukee, WI | 2.0 | 1.0 | 1400 | $1,795 | $1.28 | 43d | 1 | 1.42mi |
| 1609 N 57th St Milwaukee, WI | 2.0 | 1.0 | 1400 | $1,650 | $1.18 | 16d | 1 | 1.45mi |
| 9101 W Dixon St Milwaukee, WI | 2.0 | 2.0 | 1100 | $1,545 | $1.40 | 4d | 1 | 1.47mi |
| 1732 S 71st St Unit 1732 West Allis, WI | 3.0 | 1.0 | 912 | $1,795 | $1.97 | 11d | 1 | 1.50mi |
Listing history 7 events
-
2026-06-18days on market $285,000 Active 7 DOM
-
2026-06-17days on market $285,000 Active 6 DOM
-
2026-06-16days on market $285,000 Active 5 DOM
-
2026-06-15days on market $285,000 Active 4 DOM
-
2026-06-13days on market $285,000 Active 2 DOM
-
2026-06-13remarks 579-char remark
-
2026-06-13$285,000 Active 1 DOM
ⓘ Source: listings_history table (triggers on properties + properties_extension) + one-shot
backfill from property_details.listing_events for pre-trigger history.
Tax reassessment forecast WI · Partial reset (capped growth)
- Current annual tax
- $3,429 · $286/mo
- Projected year-2 tax
- $4,351 · $363/mo
- Expected delta
- +$922/yr (+$77/mo · 26.9%)
ⓘ Screening estimate from a state-policy table — verify with the county assessor before closing.
Climate risk First Street
- Flood 1/10 Low FEMA zone X (unshaded) · 0% chance over 30 yrs
- Wildfire 1/10 Low
- Heat 2/10 Low 7 d/yr ≥99°F today · 13 d/yr by 30 yrs out
- Wind 2/10 Low
- Air quality 2/10 Low 1 unhealthy d/yr today · 1 by 30 yrs out
Nearby sold comps map
Loading sold comps map…
Walkable amenities ~0.75 mi
Loading nearby amenities…
Taxation est. · year 1
- Rental income
- $55,392
- − Mortgage interest
- −$15,964
- − Property taxes
- −$3,429
- − Insurance
- −$1,425
- − Repairs & maintenance
- −$4,431
- − Management
- −$4,431
- − Depreciation
- −$8,291
- Taxable income
- $17,420
- Est. tax owed @ 24.0%
- −$4,181
- After-tax cash flow
- $16,790/yr
For passive investors: Depreciation is non-cash, so a rental often shows a tax loss while cash-flowing — sheltering income. Rental losses are passive: they offset passive income freely, and up to $25,000/yr can offset ordinary (W-2) income if you actively participate and your MAGI is under $100k (phasing out to $0 by $150k); unused losses carry forward. On sale, claimed depreciation is recaptured at up to 25%, and gains may owe capital-gains tax (a 1031 exchange can defer both). Figures are a year-1 estimate at your 24.0% rate — not tax advice; consult a CPA.
Schools (NCES district)
- District
- Milwaukee School District
- NCES district ID
- 5509600
- Math proficiency
- 10% ▼ -5.00%
- Reading proficiency
- 18% ▬ 0.00%
- Median HH income
- $36,339
- Composite
- 11.61/100
- National rank
- #9696
- State rank
- #337 of 342 in WI
Livability — Milwaukee
- Score
- 81/100
- State rank
- #55
- US rank
- #1534
Category grades
Schools grade is shown separately in the Schools card above.
Census & demographics
- Census place
- Milwaukee, WI
- County
- Milwaukee County · 926,379 people
- City population
- 573,768
- Metro
- Milwaukee-Waukesha, WI
- Population (ZIP)
- 26,905
- Household income
- $101,688
- Rent vs Own
- Severe rent burden
- 774.0
Population outlook (Milwaukee County) Hauer SSP2
- Today (2025)
- 995,758 people
- By 2030
- 1,009,124 · +1.3%
- By 2040
- 1,028,128 · +3.3%
- By 2050
- 1,040,066 · +4.4%
- By 2075
- 1,057,849 · +6.2%
- By 2100
- 1,039,774 · +4.4%
Race, ethnicity, and origin ACS 2023
- Neighborhood character
- Predominantly White (80%)
- Race & ethnicity
- White 80% Two or more races 6% Hispanic / Latino 5% Asian 5% Black 4%
- Hispanic origin (detail)
- Mexican 2% Puerto Rican 2%
- Common ancestry
- Romanian 10% Lithuanian 4% Portuguese 4%
- Foreign-born
- 6% · China, Canada
- Languages at home
- 93% English-only · Spanish 2% Chinese 1% Other Indo-European 1%
Political lean MEDSL · Milwaukee
- 2024 margin
- Solid D (+38.5) · D 68.3% · R 29.8% · Other 1.8%
- 2008→2024 swing
- +2.7pp toward D · 2008: 35.9pp · 2024: 38.5pp
- All cycles
- 2024: D+38.5 2020: D+39.9 2016: D+37.5 2012: D+34.6 2008: D+35.9
Not yet ingested
- Civics
- —
Market trends
- HPI YoY
- ▼ -242.24%
- Current HPI
- 294.1916
- Rent YoY
- ▲ 5.86%
- Metro
- Milwaukee-Waukesha, WI
- State GDP YoY
- ▲ 2.10%
- F500 in state
- 20
Industry mix (Fortune 500 HQ in WI)
| Industry | F500 HQs | Revenue |
|---|---|---|
| Industrial Machinery | 4 | $23B |
|
||
| Industrial Technology | 2 | $36B |
|
||
| Insurance | 1 | $36B |
|
||
| Professional Services | 1 | $19B |
|
||
| Utilities | 1 | $9B |
|
||
| Consumer Goods | 1 | $3B |
|
||
Price history
+427.8% since first listed3 events — show timeline
- 2026-06-11 Listed $285,000 METROMLS
- 2024-04-26 Sold (Public Records) $245,100 Public Records
- 1987-07-01 Sold (Public Records) $54,000 Public Records
Property tax history
+1.4%/yrLatest (2024): $3,429 · +27.9% YoY. Source: county tax records.
Cash-flow waterfall
monthlySold comps — $/sqft
last 12 mo · ≤1 miLoading sold comps…