 12-Plex
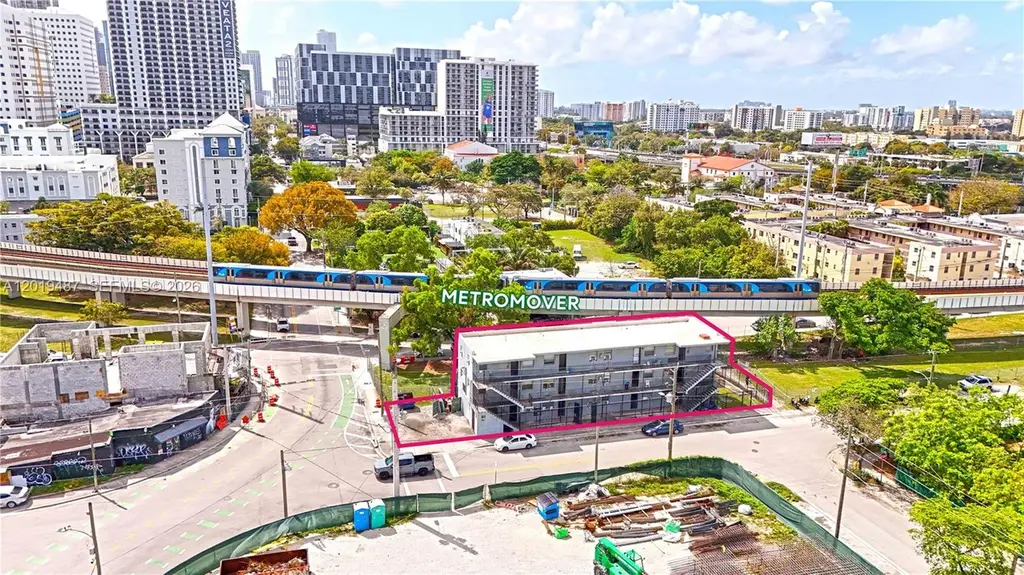
220 NW 11th Ter · Miami, FL
Flood risk 4/10 · Minor
- FEMA flood zone
- X (unshaded)
- Chance of flooding over 30 yrs
- 0.22%
- Est. flood insurance / yr
- $507 – $1,088
Fire risk 1/10 · Minimal
- Est. fire insurance / yr
- $947 – $1,759
Heat risk 10/10 · Severe
- Hot days now (above 103°F)
- 7 days/yr
- Hot days in 30 yrs
- 25 days/yr
Wind risk 10/10 · Severe
- Chance of severe wind over 30 yrs
- 99.0%
Air-quality risk 2/10 · Minimal
- Unhealthy air days now
- 1 days/yr
- Unhealthy air days in 30 yrs
- 1 days/yr
Risk factors via First Street. Map © Google.
Why this score? — see what drove the B- grade
The composite is a weighted blend of 9 inputs, each scored 0–100. Each bar is that input's sub-score; the figure is the points it added to the 100-point composite (weight × sub-score).
- Cash flow +27.9/30.0
- DSCR +9.9/10.0
- ARV discount +7.5/15.0
- 1% rule +7.1/10.0
- Schools +4.2/10.0
- Livability +3.9/5.0
- Appreciation +2.9/10.0
- Condition / age +2.5/5.0
- Rent growth +2.4/5.0
$2,350,000
🖨 Deal sheet 📄 Offer letter ✓ Due diligence
Multi-family units
County records classify this as Multi-Family (5+ Unit). Listing-text estimate: 12 units. confirmed
5+ unit building — per-unit beds/baths from public records are typically unavailable; the breakdown below (if shown) is an estimate from the listing text.
Listing remarks
a 12-unit multifamily property located in the Overtown neighborhood of Miami, Florida. The property consists of eleven two-bedroom/one-bathroom units and one one-bedroom/one-bathroom unit across approximately 6,234 square feet of rentable area on a 7,500 SF lot zoned T6-8-O, permitting up to 8 stories of development. The property is currently 83.3% occupied with in-place rents averaging $1,600 per month. The property's T6-8-O zoning supports future redevelopment at up to 8 stories, providing optionality for long-term investors seeking density in Miami's urban core. The generous lot size of 7,500 square feet on a corner parcel further enhances the redevelopment potential of this site.
Key facts
- Multifamily property
- Corner parcel
- Zoned t6-8-o
Tags
Property features AI
Finance
- Other: Zoning: 6100; Annual tax information available (tax year 2025)
- Financial info: Rent includes gardener, hot water, and trash collection
Exterior
- Parking: Space for 4 vehicles
- Utilities: Cable available; Public sewer
- Home design: 3-story building; Resale property; Facing information not provided
- Construction: Block construction; Flat and tile roof
- Exterior features: Less than quarter acre lot
Interior
- Flooring: Vinyl
- Heating & cooling: Central heating; Central air conditioning
- Interior features: Vinyl flooring; Central heating; Central air conditioning
Neighborhood map
What this means for you Summary
Snapshot
- This is a 11×2bd/1ba + 1×1bd/1ba units multifamily listed at $2.35M.
Deal economics
- At list price, monthly cash flow is $7k ($87k/yr) — positive. Per door: $601/mo.
- The deal already cash-flows at list — no discount required.
- Meets the 1% rule at list price ($28k rent vs $2.35M).
- Recommended offer: $2.28M (3.0% below list) — sets the bar for market timing.
- Cap rate 10.0% vs local median 1.9% in Miami — top-decile yield for the area; either an underpriced asset or a hidden risk that comps aren't pricing in. Stress-test before assuming the spread holds.
Location & tenants
- Location reads 78/100 on livability (#177 in FL, #2,724 nationally) — a middle-class / working-renter tenant base. Strengths: amenities A+, commute A+, health & safety A+; Watch: employment C-, crime F, cost of living F.
- Miami-Dade (suburban): math 45% / reading 54% proficiency, ranked #40 of 73 in FL (top 55%) — families likely to look elsewhere, expect single-tenant / working-renter base with shorter leases; 64% free/reduced lunch — lower-income household profile, screen leases tightly.
- Market conditions: Rents soft (-0.2%/yr); 56 active listings in the ZIP; lower-income renter base — watch delinquency; 10,051 units permitted in Miami-Dade County in 2024 (7,758 in 5+ unit buildings).
- At $28,409/mo this rent would consume 760% of the median local household income ($45k/yr) (locally 2267% of renters already pay >50% of income on rent) — very limited rent-growth headroom before tenants either downsize or default.
Forward outlook
- Local home prices are declining (-3.0%/yr); year-one equity from $16k of loan paydown is wiped out by about $70k of value loss. Plan a longer hold.
- Miami-Dade County population projected at +28% by 2050 — long-run rental-demand tailwind backs the buy-and-hold thesis.
Negotiation context
- It's been on market 35 days — a 3% lower offer ($2.28M) is reasonable based on typical stale-listing flexibility.
- Current owner paid $1.90M; 24% above their basis — modest negotiation headroom, anchor on the comps not their cost.
Risks & watch-outs
- Climate carrying-cost: severe wind risk, 99% chance of damaging wind over 30y; extreme-heat days projected 7→25/yr by 2055 (HVAC capex compounding) — expect insurance premiums to compound above CPI over the hold.
Questions for the listing agent
- It's been on market 35 days. Have you received any prior offers? Is the seller open to a 3% concession, seller financing, or rate buy-down credit?
- Can we see the unit-by-unit rent roll, current vacancy, and any below-market leases? What's the average tenancy length?
- What capital expenditures (roof, boiler, parking lot, exteriors) have been made in the last 5 years, and what's planned in the next 2?
- Built in 1960 — when were the roof, HVAC, electrical panel, plumbing, and water heater last replaced?
- Is there a deadline driving the sale (1031 exchange, divorce, estate, relocation)? That informs how much negotiation room exists.
- Schools are B-rated — typically a magnet for longer-tenancy family renters. What's the average tenant stay here, and is there a school-zone premium baked into asking?
- Crime grade is F in this area — have there been break-ins, vandalism, or insurance claims at this property in the last 3 years? What carrier currently insures it and at what premium?
- What's the average days-on-market for RENTAL listings here right now (not sales)? A rising rental-DOM trend means longer vacancies and softer asking-rent achievability than the comps imply.
- What's the recent tenant-quality profile in this submarket — average credit score on applications, eviction rate, late-payment / NSF rate, and stable-employment percentage? A property-management company in the area should have these aggregated.
- How much new apartment / multifamily construction is in the pipeline within 1–3 miles? Heavy new supply (>2% of stock underway) typically softens rents 12–24 months out; light construction supports rent growth.
Investment metrics
- 1% rule
- 1.21% ✓
- Cap rate
- 9.98%
- Cash-on-cash
- 13.15%
- DSCR
- 1.59
- GRM
- 6.9
CMA / ARV
No comps found within radius.
Projected returns pro-forma
-3.0% appreciation · 0.0% rent growth · sell at horizon
- IRR
- -0.2%
- Equity multiple
- 0.99×
- Total profit
- $-4,976
- Equity at exit
- $350,393
- IRR
- 6.2%
- Equity multiple
- 1.40×
- Total profit
- $264,526
- Equity at exit
- $203,185
Cash invested: $658,000 (down + closing). Projections, not guarantees.
Landlord ↔ Tenant lean methodology
- Overall (STATE)
- 87 Strongly Landlord-Friendly
- State Florida
- 87 Strongly Landlord-Friendly · R+3
- County
- — inherits STATE
- City
- — inherits STATE
ZIP-level market 33136
- Home prices YoY
- -1.1%
- Rents YoY
- -0.2%
- Active inventory
- 56
- Price-to-rent
- 81.7×
Monthly cashflow live
- Estimated rent
- $28,409 medium interval (Pro) →
- Mortgage (P&I)
- −$12,324
- Tax from tax record
- −$1,929 /mo · $23,152/yr
- Insurance
- −$979
- HOA
- −$0
- Vacancy / Maint / Mgmt
- −$5,966
- Net cashflow
- $7,211
Break-even live
12-unit breakdown (identical units grouped — click to expand)
| Units | Beds | Baths | Est. rent |
|---|---|---|---|
| 11× units | 2 | 1 | $26,367 |
| #1 | 2 | 1 | $2,397 |
| #2 | 2 | 1 | $2,397 |
| #3 | 2 | 1 | $2,397 |
| #4 | 2 | 1 | $2,397 |
| #5 | 2 | 1 | $2,397 |
| #6 | 2 | 1 | $2,397 |
| #7 | 2 | 1 | $2,397 |
| #8 | 2 | 1 | $2,397 |
| #9 | 2 | 1 | $2,397 |
| #10 | 2 | 1 | $2,397 |
| #11 | 2 | 1 | $2,397 |
| 1× unit | 1 | 1 | $2,041 |
| Total (12 units) | $28,409 | ||
UW: 25.0% down · 7.5% · 30yr · 1.5% tax · 5.0% vac · 8.0% maint · 8.0% mgmt
Financing live
Cash to close
- Down payment
- $587,500
- Closing costs
- $70,500
- Reserves months
- —
- Total cash needed
- —
Loan-product check · same deal, 3 products live
Conventional
25% down · 7.5% · 30yr
- Down + closing
- —
- Monthly P&I
- —
- Monthly cashflow
- —
- DSCR
- —
- Eligible?
- —
Personal DTI + credit; lowest rate.
DSCR
20% down · 8.5% · 30yr
- Down + closing
- —
- Monthly P&I
- —
- Monthly cashflow
- —
- DSCR
- —
- Eligible?
- —
No personal income docs; deal must DSCR.
Hard money
10% down · 12.0% · 12mo
- Down + closing
- —
- Monthly P&I
- —
- Monthly cashflow
- —
- DSCR
- —
- Eligible?
- —
Short-term bridge; refi at stabilization.
Listing history 15 events
-
2026-06-18days on market $2,350,000 Active 35 DOM
-
2026-06-17days on market $2,350,000 Active 34 DOM
-
2026-06-16days on market $2,350,000 Active 33 DOM
-
2026-06-15days on market $2,350,000 Active 32 DOM
-
2026-06-13days on market $2,350,000 Active 30 DOM
-
2026-06-09days on market $2,350,000 Active 26 DOM
-
2026-06-08days on market $2,350,000 Active 25 DOM
-
2026-06-07days on market $2,350,000 Active 24 DOM
-
2026-06-04days on market $2,350,000 Active 21 DOM
-
2026-06-03days on market $2,350,000 Active 20 DOM
-
2026-06-02days on market $2,350,000 Active 19 DOM
-
2026-06-01days on market $2,350,000 Active 18 DOM
-
2026-05-31days on market $2,350,000 Active 17 DOM
-
2026-05-14$2,350,000 Active
-
2015-09-21soldstatus $1,900,000
ⓘ Source: listings_history table (triggers on properties + properties_extension) + one-shot
backfill from property_details.listing_events for pre-trigger history.
Tax reassessment forecast FL · Resets to sale price
- Current annual tax
- $23,152 · $1,929/mo
- Projected year-2 tax
- $23,152 · $1,929/mo
- Expected delta
- $0/yr ($0/mo · 0.0%)
ⓘ Screening estimate from a state-policy table — verify with the county assessor before closing.
Climate risk First Street
- Flood 4/10 Moderate FEMA zone X (unshaded) · 22% chance over 30 yrs
- Wildfire 1/10 Low
- Heat 10/10 Extreme 7 d/yr ≥103°F today · 25 d/yr by 30 yrs out
- Wind 10/10 Extreme 99% chance of damaging wind over 30 yrs
- Air quality 2/10 Low 1 unhealthy d/yr today · 1 by 30 yrs out
Nearby sold comps map
Loading sold comps map…
Walkable amenities ~0.75 mi
Loading nearby amenities…
Taxation est. · year 1
- Rental income
- $340,908
- − Mortgage interest
- −$131,637
- − Property taxes
- −$23,152
- − Insurance
- −$11,750
- − Repairs & maintenance
- −$27,273
- − Management
- −$27,273
- − Depreciation
- −$68,364
- Taxable income
- $51,461
- Est. tax owed @ 24.0%
- −$12,351
- After-tax cash flow
- $74,181/yr
For passive investors: Depreciation is non-cash, so a rental often shows a tax loss while cash-flowing — sheltering income. Rental losses are passive: they offset passive income freely, and up to $25,000/yr can offset ordinary (W-2) income if you actively participate and your MAGI is under $100k (phasing out to $0 by $150k); unused losses carry forward. On sale, claimed depreciation is recaptured at up to 25%, and gains may owe capital-gains tax (a 1031 exchange can defer both). Figures are a year-1 estimate at your 24.0% rate — not tax advice; consult a CPA.
Schools (NCES district)
- District
- Miami-Dade
- NCES district ID
- 1200390
- Math proficiency
- 45% ▼ -16.00%
- Reading proficiency
- 54% ▼ -5.00%
- Median HH income
- $43,928
- Composite
- 41.76/100
- National rank
- #3397
- State rank
- #40 of 73 in FL
Livability — Miami
- Score
- 78/100
- State rank
- #177
- US rank
- #2724
Category grades
Schools grade is shown separately in the Schools card above.
Census & demographics
- Census place
- Miami, FL
- County
- Miami-Dade County · 2,697,751 people
- City population
- 827,308
- Metro
- Miami-Fort Lauderdale-Pompano Beach, FL
- Population (ZIP)
- 16,545
- Household income
- $44,843
- Rent vs Own
- Severe rent burden
- 2267.0
Population outlook (Miami-Dade County) Hauer SSP2
- Today (2025)
- 3,126,439 people
- By 2030
- 3,325,765 · +6.4%
- By 2040
- 3,697,561 · +18.3%
- By 2050
- 4,012,134 · +28.3%
- By 2075
- 4,605,612 · +47.3%
- By 2100
- 4,866,598 · +55.7%
Race, ethnicity, and origin ACS 2023
- Neighborhood character
- Diverse neighborhood (Simpson 0.60)
- Race & ethnicity
- Hispanic / Latino 54% Black 32% Two or more races 27% White 8% Asian 3%
- Hispanic origin (detail)
- Mexican 2% Puerto Rican 4% Cuban 20% Dominican 1% Salvadoran 4%
- Common ancestry
- Hispanic 2% Russian 1%
- Foreign-born
- 47% · Canada, Jamaica, Dominican Republic
- Languages at home
- 43% English-only · Spanish 50% Other Indo-European 3% French/Haitian/Cajun 2%
Political lean MEDSL · Miami-Dade
- 2024 margin
- R (+11.4) · D 43.9% · R 55.4%
- 2008→2024 swing
- -27.6pp toward R · 2008: 16.1pp · 2024: -11.4pp
- All cycles
- 2024: R+11.4 2020: D+7.3 2016: D+29.6 2012: D+23.7 2008: D+16.1
Not yet ingested
- Civics
- —
Market trends
- HPI YoY
- ▼ -4.24%
- Current HPI
- 369.8981
- Rent YoY
- ▼ -0.25%
- Metro
- Miami-Fort Lauderdale-Pompano Beach, FL
- State GDP YoY
- ▲ 3.28%
- F500 in state
- 36
Industry mix (Fortune 500 HQ in FL)
| Industry | F500 HQs | Revenue |
|---|---|---|
| Industrial Technology | 2 | $29B |
|
||
| Insurance | 2 | $17B |
|
||
| Retail | 1 | $60B |
|
||
| Technology Distribution | 1 | $58B |
|
||
| Homebuilding | 1 | $35B |
|
||
| Technology Manufacturing | 1 | $35B |
|
||
Price history
+23.7% since first listed2 events — show timeline
- 2026-05-14 Listed $2,350,000 MARMLS
- 2015-09-21 Sold (Public Records) $1,900,000 Public Records
Property tax history
+10.7%/yrLatest (2025): $23,152 · +13.3% YoY. Source: county tax records.
Cash-flow waterfall
monthlySold comps — $/sqft
last 12 mo · ≤1 miLoading sold comps…