1730 Mallard Dr Apt F · Callaway, FL
Flood risk 4/10 · Minor
- FEMA flood zone
- X (unshaded)
- Chance of flooding over 30 yrs
- 0.21%
- Est. flood insurance / yr
- $507 – $1,088
Fire risk 7/10 · Major
- Est. fire insurance / yr
- $947 – $1,759
Heat risk 10/10 · Severe
- Hot days now (above 104°F)
- 7 days/yr
- Hot days in 30 yrs
- 21 days/yr
Wind risk 10/10 · Severe
- Chance of severe wind over 30 yrs
- 99.0%
Air-quality risk 1/10 · Minimal
- Unhealthy air days now
- 0 days/yr
- Unhealthy air days in 30 yrs
- 0 days/yr
Risk factors via First Street. Map © Google.
Why this score? — see what drove the C+ grade
The composite is a weighted blend of 9 inputs, each scored 0–100. Each bar is that input's sub-score; the figure is the points it added to the 100-point composite (weight × sub-score).
- Cash flow +27.5/30.0
- DSCR +9.6/10.0
- ARV discount +7.5/15.0
- 1% rule +6.8/10.0
- Schools +4.3/10.0
- Livability +3.2/5.0
- Rent growth +2.8/5.0
- Condition / age +2.5/5.0
- Appreciation +0.0/10.0
$125,000
🖨 Deal sheet (PDF) 📄 Offer letter ✓ Due diligence
Listing remarks MLS
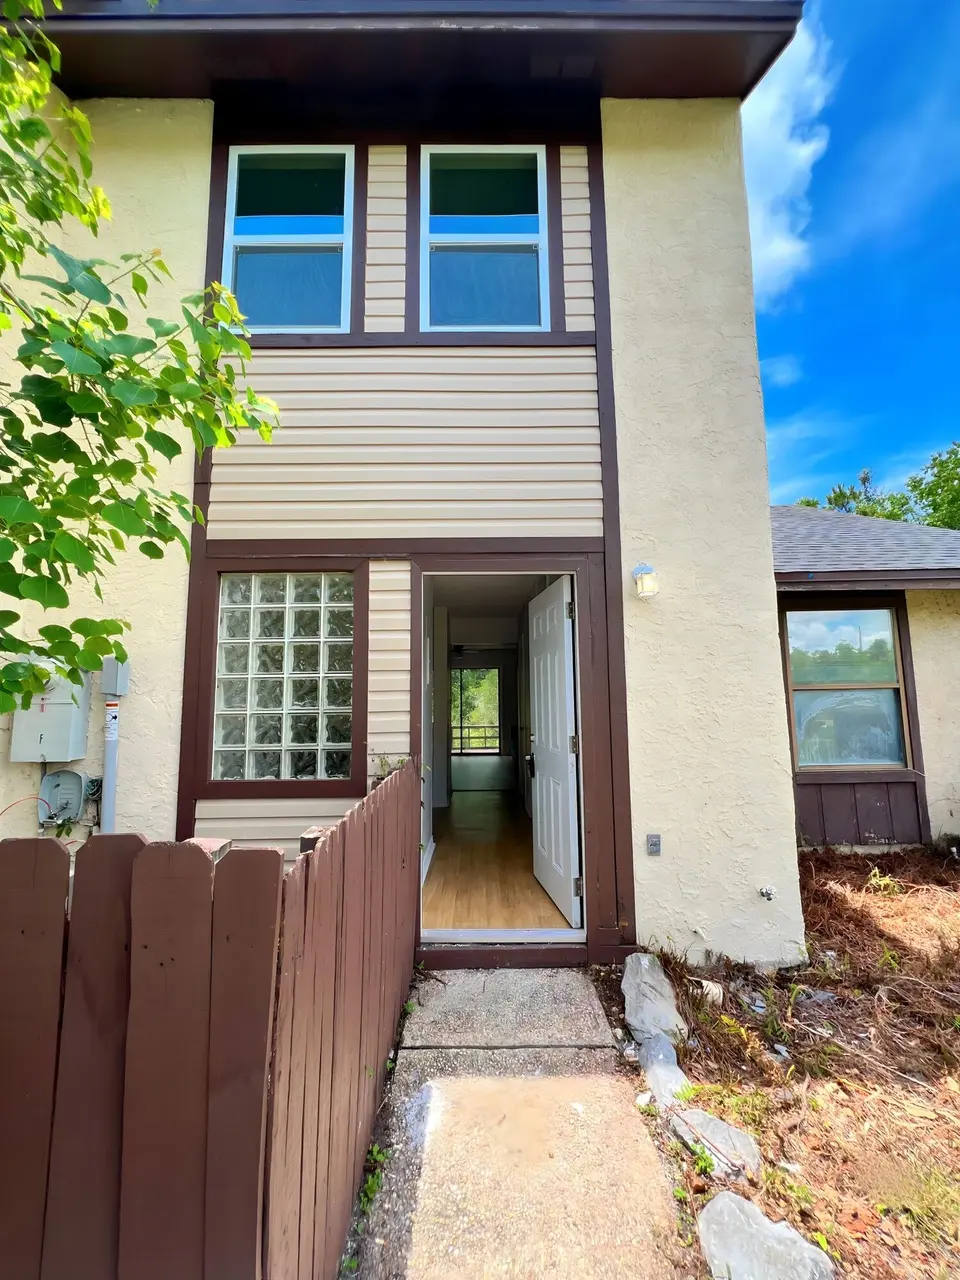
TURNKEY INVESTMENT OPPORTUNITY | NO HOA Welcome to this beautifully renovated townhouse offering modern updates, low-maintenance living, and excellent investment potential. Ideal for first-time homebuyers, long-term rentals, or short-term rental opportunities, this move-in-ready property features 2 bedrooms and 1.5 bathrooms with thoughtful upgrades throughout. The interior showcases fresh paint, updated flooring throughout with no carpet, and abundant natural light from newly installed windows. The kitchen has been refreshed with new cabinetry and sinks, creating a clean and functional space for everyday living. Additional improvements include renovated attic space with updated plumbing, along with new wood flooring and railing at the rear of the home, enhancing both style and functionality. With no HOA fees, this property offers flexibility, convenience, and exceptional value. Conveniently located and thoughtfully updated, this is an opportunity you do not want to miss. Schedule your private showing today. All measurements are approximate and should be verified by buyer. Furniture does not convey.
Key facts
- Renovated townhouse
- Modern updates
- Move in ready
Tags
Property features AI
Finance
- Financial info: $1,060.96 annual tax (2025)
- HOA & community: No recorded subdivision
Exterior
- Utilities: Electric service; Public water; Public sewer; TV cable
- Home design: Townhome style; 2 stories; Built in 1983
- Construction: 812 total building area (per county records)
- Exterior features: No pool; Zoned residential (single family)
Interior
- Kitchen: Kitchen on the first floor
- Bedrooms: 2 bedrooms total; Primary bedroom located on the second floor; Additional bedroom located on the second floor
- Bathrooms: 2 total bathrooms (1 full, 1 half)
- Heating & cooling: Central air conditioning; Ceiling fans
- Interior features: Living room located on the first floor; Kitchen located on the first floor; Two-story layout
Neighborhood map
What this means for you Summary
Snapshot
- This is a 2-bed/2.0-bath townhouse listed at $125k.
Deal economics
- At list price, monthly cash flow is $369 ($4k/yr) — positive.
- The deal already cash-flows at list — no discount required.
- Meets the 1% rule at list price ($1k rent vs $125k).
- Recommended offer: $123k (1.5% below list) — sets the bar for market timing.
- Cap rate 9.8% vs local median 5.1% in Callaway — top-decile yield for the area; either an underpriced asset or a hidden risk that comps aren't pricing in. Stress-test before assuming the spread holds.
Location & tenants
- Location reads 64/100 on livability (#690 in FL) — a middle-class / working-renter tenant base. Strengths: cost of living A+, housing A+; Watch: employment D+, amenities F, commute F.
- Bay (suburban): math 51% / reading 51% proficiency, ranked #29 of 73 in FL (top 40%) — acceptable for families but not a draw, mixed tenant base, ~2y average lease.
- Zoned schools: Callaway Elementary School (math 37% / reading 42%, grade F, #1,513 of 2,144 statewide, top 73%, 511 students, 72% FRL); Rutherford High School (math 24% / reading 29%, grade F, #489 of 667 statewide, top 74%, 1,337 students, 63% FRL) — zoned schools average 68% FRL vs 48% district-wide (19 pts higher); higher-poverty schools than district average — tighter screening recommended.
- Zoned-school proficiency averages 33% at this address vs 51% district-wide (-18 pts) — the specific schools serving this property underperform the Bay average; the district grade overstates school quality for this exact location.
- Market conditions: Rents rising (+1.1%/yr); 981 active listings in the ZIP; 2,473 units permitted in Bay County in 2024 (559 in 5+ unit buildings).
Forward outlook
- Local home prices are declining (-3.0%/yr); year-one equity from $864 of loan paydown is wiped out by about $4k of value loss. Plan a longer hold.
- Bay County population projected at +24% by 2050 — long-run rental-demand tailwind backs the buy-and-hold thesis.
Negotiation context
- It's been on market 30 days — a 2% lower offer ($123k) is reasonable based on typical stale-listing flexibility.
- 11 sale attempts since 2y ago with the ask held roughly flat each time — persistent listings suggest the price (not the market) is what's stuck; bring a comps-based counter.
- Current owner paid $31k; list at $125k implies a 303% gain — meaningful room to come down on a strong offer.
Risks & watch-outs
- Climate carrying-cost: severe wind risk, 99% chance of damaging wind over 30y; major wildfire risk; extreme-heat days projected 7→21/yr by 2055 (HVAC capex compounding) — expect insurance premiums to compound above CPI over the hold.
Questions for the listing agent
- Is there a deadline driving the sale (1031 exchange, divorce, estate, relocation)? That informs how much negotiation room exists.
- Schools are F-rated, which usually means shorter tenancies and higher turnover. Who's the typical renter profile here, and what's been the actual vacancy rate?
- What's the average days-on-market for RENTAL listings here right now (not sales)? A rising rental-DOM trend means longer vacancies and softer asking-rent achievability than the comps imply.
- What's the recent tenant-quality profile in this submarket — average credit score on applications, eviction rate, late-payment / NSF rate, and stable-employment percentage? A property-management company in the area should have these aggregated.
- How much new for-sale + rental construction is in the pipeline within 1–3 miles? Heavy new supply typically softens prices + rents 12–24 months out; constrained supply supports both.
Investment metrics
- 1% rule
- 1.18% ✓
- Cap rate
- 9.84%
- Cash-on-cash
- 12.65%
- DSCR
- 1.56
- GRM
- 7.1
CMA / ARV
No comps found within radius.
Projected returns pro-forma
-3.0% appreciation · 1.12% rent growth · sell at horizon
- IRR
- 0.4%
- Equity multiple
- 1.01×
- Total profit
- $495
- Equity at exit
- $18,638
- IRR
- 8.1%
- Equity multiple
- 1.57×
- Total profit
- $19,801
- Equity at exit
- $10,808
Cash invested: $35,000 (down + closing). Projections, not guarantees.
Landlord ↔ Tenant lean methodology
- Overall (STATE)
- 87 Strongly Landlord-Friendly
- State Florida
- 87 Strongly Landlord-Friendly · R+3
- County
- — inherits STATE
- City
- — inherits STATE
ZIP-level market 32404
- Home prices YoY
- -16.1%
- Rents YoY
- 1.1%
- Active inventory
- 981
- Price-to-rent
- 7.1×
Monthly cashflow live
- Estimated rent
- $1,475 medium interval (Pro) →
- Mortgage (P&I)
- −$656
- Tax from tax record
- −$88 /mo · $1,061/yr
- Insurance
- −$52
- HOA
- −$0
- Vacancy / Maint / Mgmt
- −$310
- Net cashflow
- $369
Break-even live
Sensitivity live
| Price | -10% $440 | -5% $404 | +0% $369 | +5% $334 | +10% $298 |
|---|---|---|---|---|---|
| Rent | -10% $253 | -5% $311 | +0% $369 | +5% $427 | +10% $486 |
| Rate | -1.0pp $432 | -0.5pp $401 | base $369 | +0.5pp $337 | +1.0pp $304 |
UW: 25.0% down · 7.5% · 30yr · 1.5% tax · 5.0% vac · 8.0% maint · 8.0% mgmt
Financing live
Cash to close
- Down payment
- $31,250
- Closing costs
- $3,750
- Reserves months
- —
- Total cash needed
- —
Loan-product check · same deal, 3 products live
Conventional
25% down · 7.5% · 30yr
- Down + closing
- —
- Monthly P&I
- —
- Monthly cashflow
- —
- DSCR
- —
- Eligible?
- —
Personal DTI + credit; lowest rate.
DSCR
20% down · 8.5% · 30yr
- Down + closing
- —
- Monthly P&I
- —
- Monthly cashflow
- —
- DSCR
- —
- Eligible?
- —
No personal income docs; deal must DSCR.
Hard money
10% down · 12.0% · 12mo
- Down + closing
- —
- Monthly P&I
- —
- Monthly cashflow
- —
- DSCR
- —
- Eligible?
- —
Short-term bridge; refi at stabilization.
Listing history 36 events
-
2026-06-21days on market $125,000 Active 30 DOM
-
2026-06-19days on market $125,000 Active 28 DOM
-
2026-06-18days on market $125,000 Active 27 DOM
-
2026-06-17days on market $125,000 Active 26 DOM
-
2026-06-16days on market $125,000 Active 25 DOM
-
2026-06-15days on market $125,000 Active 24 DOM
-
2026-06-14days on market $125,000 Active 22 DOM
-
2026-06-13days on market $125,000 Active 21 DOM
-
2026-06-10days on market $125,000 Active 19 DOM
-
2026-06-09days on market $125,000 Active 18 DOM
-
2026-06-08days on market $125,000 Active 17 DOM
-
2026-06-07days on market $125,000 Active 16 DOM
-
2026-06-05days on market $125,000 Active 13 DOM
-
2026-06-03days on market $125,000 Active 12 DOM
-
2026-06-02days on market $125,000 Active 11 DOM
-
2026-06-01days on market $125,000 Active 10 DOM
-
2026-05-31days on market $125,000 Active 9 DOM
-
2026-05-30days on market $125,000 Active 8 DOM
-
2026-05-22$125,000 Active
-
2026-04-21historical
-
2025-12-09status Active
-
2025-11-30historical
-
2025-07-23status Active
-
2025-07-23status Active
-
2025-07-01historical Active Under Contract
-
2025-07-01status Pending
-
2025-01-13$125,000 Active
-
2025-01-13$125,000 Active
-
2024-12-09historical
-
2024-07-01status Active
-
2024-07-01status Active
-
2024-06-26status Pending
-
2024-06-26historical Active Under Contract
-
2024-06-07$130,000 Active
-
2024-06-07$130,000 Active
-
1997-06-01soldstatus $31,000
ⓘ Source: listings_history table (triggers on properties + properties_extension) + one-shot
backfill from property_details.listing_events for pre-trigger history.
Tax reassessment forecast FL · Resets to sale price
- Current annual tax
- $1,061 · $88/mo
- Projected year-2 tax
- $1,061 · $88/mo
- Expected delta
- $0/yr ($0/mo · 0.0%)
ⓘ Screening estimate from a state-policy table — verify with the county assessor before closing.
Climate risk First Street
- Flood 4/10 Moderate FEMA zone X (unshaded) · 21% chance over 30 yrs
- Wildfire 7/10 Severe
- Heat 10/10 Extreme 7 d/yr ≥104°F today · 21 d/yr by 30 yrs out
- Wind 10/10 Extreme 99% chance of damaging wind over 30 yrs
- Air quality 1/10 Low 0 unhealthy d/yr today · 0 by 30 yrs out
Nearby sold comps map
Loading sold comps map…
Walkable amenities ~0.75 mi
Loading nearby amenities…
Taxation est. · year 1
- Rental income
- $17,698
- − Mortgage interest
- −$7,002
- − Property taxes
- −$1,061
- − Insurance
- −$625
- − Repairs & maintenance
- −$1,416
- − Management
- −$1,416
- − Depreciation
- −$3,636
- Taxable income
- $2,542
- Est. tax owed @ 24.0%
- −$610
- After-tax cash flow
- $3,819/yr
For passive investors: Depreciation is non-cash, so a rental often shows a tax loss while cash-flowing — sheltering income. Rental losses are passive: they offset passive income freely, and up to $25,000/yr can offset ordinary (W-2) income if you actively participate and your MAGI is under $100k (phasing out to $0 by $150k); unused losses carry forward. On sale, claimed depreciation is recaptured at up to 25%, and gains may owe capital-gains tax (a 1031 exchange can defer both). Figures are a year-1 estimate at your 24.0% rate — not tax advice; consult a CPA.
Schools (NCES district)
- District
- Bay
- NCES district ID
- 1200090
- Math proficiency
- 51% ▼ -8.00%
- Reading proficiency
- 51% ▼ -7.00%
- Median HH income
- $47,740
- Composite
- 43.41/100
- National rank
- #3014
- State rank
- #29 of 73 in FL
Livability — Callaway
- Score
- 64/100
- State rank
- #690
- US rank
- #14384
Category grades
Schools grade is shown separately in the Schools card above.
Census & demographics
- County
- Bay County · 163,593 people
- Metro
- Panama City, FL
- Population (ZIP)
- 42,514
- Household income
- $74,708
- Rent vs Own
- Severe rent burden
- 1218.0
Population outlook (Bay County) Hauer SSP2
- Today (2025)
- 206,264 people
- By 2030
- 217,740 · +5.6%
- By 2040
- 238,738 · +15.7%
- By 2050
- 255,545 · +23.9%
- By 2075
- 288,295 · +39.8%
- By 2100
- 288,638 · +39.9%
Race, ethnicity, and origin ACS 2023
- Neighborhood character
- Predominantly White (69%)
- Race & ethnicity
- White 69% Black 12% Two or more races 10% Hispanic / Latino 9% Asian 3%
- Hispanic origin (detail)
- Mexican 2% Puerto Rican 3%
- Common ancestry
- Lithuanian 3% Slovak 2% Italian 2%
- Foreign-born
- 7% · Canada, Vietnam, Mexico
- Languages at home
- 90% English-only · Spanish 6% Vietnamese 1% Other Asian/Pacific 1%
Political lean MEDSL · Bay
- 2024 margin
- Solid R (+47.4) · D 25.8% · R 73.1% · Other 1.1%
- 2008→2024 swing
- -6.6pp toward R · 2008: -40.7pp · 2024: -47.4pp
- All cycles
- 2024: R+47.4 2020: R+43.5 2016: R+46.3 2012: R+43.6 2008: R+40.7
Not yet ingested
- Civics
- —
Market trends
- HPI YoY
- ▼ -50.59%
- Current HPI
- 263.7178
- Rent YoY
- ▲ 1.12%
- Metro
- Panama City, FL
- State GDP YoY
- ▲ 3.28%
- F500 in state
- 36
Industry mix (Fortune 500 HQ in FL)
| Industry | F500 HQs | Revenue |
|---|---|---|
| Industrial Technology | 2 | $29B |
|
||
| Insurance | 2 | $17B |
|
||
| Retail | 1 | $60B |
|
||
| Technology Distribution | 1 | $58B |
|
||
| Homebuilding | 1 | $35B |
|
||
| Technology Manufacturing | 1 | $35B |
|
||
Price history
+303.2% since first listed19 events — show timeline
- 2026-06-04 Listed $125,000 CPARMLS
- 2026-05-22 Listed $125,000 ECAR
- 2026-04-21 Listing Removed — CPARMLS
- 2025-12-09 Relisted — CPARMLS
- 2025-11-30 Listing Removed — CPARMLS
- 2025-07-23 Relisted — CPARMLS
- 2025-07-23 Relisted — ECAR
- 2025-07-01 Contingent — CPARMLS
- 2025-07-01 Pending — ECAR
- 2025-01-13 Listed $125,000 ECAR
- 2025-01-13 Listed $125,000 CPARMLS
- 2024-12-09 Listing Removed — CPARMLS
- 2024-07-01 Relisted — ECAR
- 2024-07-01 Relisted — CPARMLS
- 2024-06-26 Pending — ECAR
- 2024-06-26 Contingent — CPARMLS
- 2024-06-07 Listed $130,000 ECAR
- 2024-06-07 Listed $130,000 CPARMLS
- 1997-06-01 Sold (Public Records) $31,000 Public Records
Property tax history
-2.5%/yrLatest (2025): $1,061 · +7.9% YoY. Source: county tax records.
Cash-flow waterfall
monthlySold comps — $/sqft
last 12 mo · ≤1 miLoading sold comps…