 🏗️ New Construction
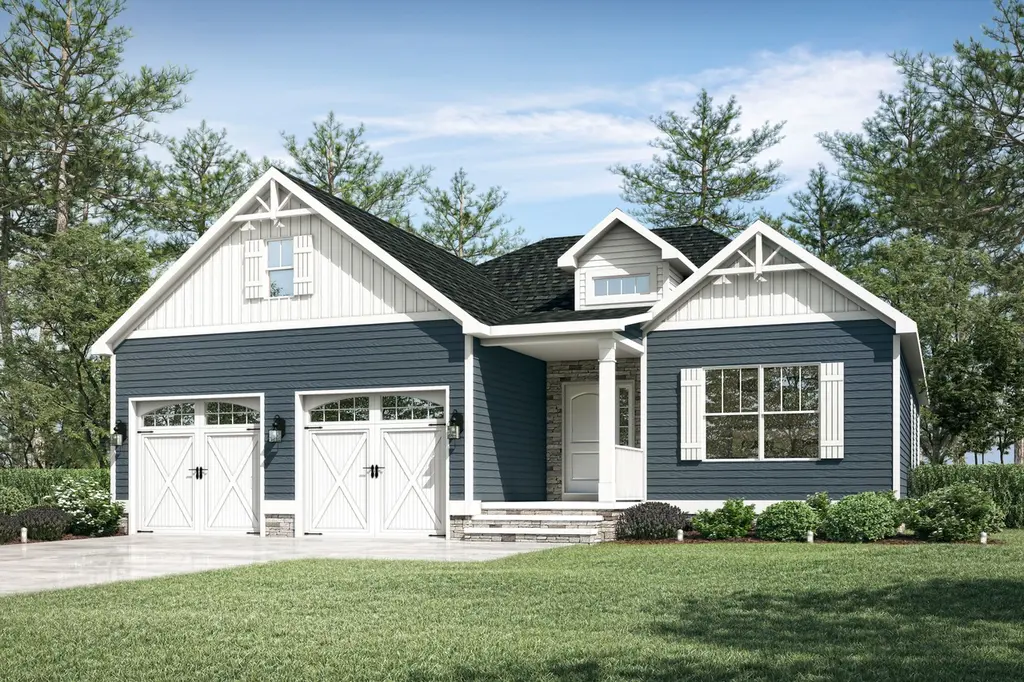
The Sunnyside - Build On-Your-Lot Plan · Millville, DE
Flood risk 7/10 · Major
- FEMA flood zone
- X (unshaded)
- Chance of flooding over 30 yrs
- 0.93%
- Est. flood insurance / yr
- $473 – $860
Fire risk 1/10 · Minimal
- Est. fire insurance / yr
- $476 – $884
Heat risk 8/10 · Major
- Hot days now (above 100°F)
- 7 days/yr
- Hot days in 30 yrs
- 18 days/yr
Wind risk 8/10 · Major
- Chance of severe wind over 30 yrs
- 80.0%
Air-quality risk 2/10 · Minimal
- Unhealthy air days now
- 0 days/yr
- Unhealthy air days in 30 yrs
- 1 days/yr
Risk factors via First Street. Map © Google.
Why this score? — see what drove the F grade
The composite is a weighted blend of 9 inputs, each scored 0–100. Each bar is that input's sub-score; the figure is the points it added to the 100-point composite (weight × sub-score).
- ARV discount +7.5/15.0
- Appreciation +4.6/10.0
- Livability +3.2/5.0
- Schools +2.9/10.0
- Cash flow +2.7/30.0
- Rent growth +2.5/5.0
- Condition / age +2.5/5.0
- 1% rule +0.0/10.0
- DSCR +0.0/10.0
$337,600
🖨 Deal sheet (PDF) 📄 Offer letter ✓ Due diligence
Listing remarks MLS
The Sunnyside by Bay to Beach Builders is a thoughtfully designed ranch-style home offering 2,108 heated sq. ft. , 3 bedrooms, 2 baths, and a 2-car garage-ideal for families, retirees, or anyone seeking modern one-level living. Its open-concept layout maximizes flow and natural light, with the kitchen, dining area, and great room creating an airy central gathering space. The kitchen features a large island, ample cabinetry, and a walk-in pantry, while an optional fireplace adds cozy charm. The private owner's suite includes a spacious bedroom, walk-in closet, and luxury bath with dual vanities and optional upgrades. Two additional bedrooms, each with walk-in closets, sit on the opposite side of the home-perfect for guests, children, or a home office. Expansion options such as a sunroom, covered porch, or deck offer extra space to enjoy Delaware and Maryland's seasons. A large mudroom and utility area off the garage keep daily life organized. With optional porch styles, a side-load garage, and flexible room uses, the Sunnyside delivers custom feel without sacrificing efficiency. Whether building in Middletown, Ocean View, or the scenic Eastern Shore, this plan blends charm, function, and modern living.
Key facts
- Luxury bath
- Walk-in closet
- Large island
Tags
Neighborhood map
What this means for you Summary
Snapshot
- This is a 3-bed/2.0-bath single-family listed at $338k.
Deal economics
- At list price, monthly cash flow is $-2k ($-23k/yr) — negative.
- To cash-flow at today's rent, offer at most $277k (18.0% below list).
- To meet the 1% rule (rent ≥ 1% of price), the offer needs to be $249k (26.2% below list).
- Recommended offer: $249k (26.2% below list) — sets the bar for 1% rule.
Location & tenants
- Location reads 64/100 on livability (#49 in DE) — a middle-class / working-renter tenant base. Strengths: crime A+, employment A, housing A; Watch: amenities F, commute F, cost of living F.
- Indian River School District (rural): math 25% / reading 41% proficiency, ranked #14 of 26 in DE (top 54%) — families likely to look elsewhere, expect single-tenant / working-renter base with shorter leases.
- Zoned schools: Lord Baltimore Elementary School (math 51% / reading 67%, grade B-, #4 of 105 statewide, top 4%, 579 students, 0% FRL); Selbyville Middle School (math 20% / reading 49%, grade F, #12 of 36 statewide, top 34%, 719 students, 0% FRL); Indian River High School (math 32% / reading 52%, grade F, #10 of 40 statewide, top 26%, 1,088 students, 0% FRL) — zoned schools average 0% FRL vs 49% district-wide (49 pts lower); this property's tenant base skews higher-income than the district average.
- Zoned-school proficiency averages 45% at this address vs 33% district-wide (+12 pts) — the actual schools serving this property are materially stronger than the Indian River School District average implies; a family-tenant draw the district grade alone would hide.
- Market conditions: 127 active listings in the ZIP; 4 comparable units currently listed for rent nearby; rentals lingering (median 46d on market — plan ~5-8 weeks vacancy on turnover, expect pricing pressure); 75% of comp listings sitting > 30 days — soft ceiling on asking rent; 4,354 units permitted in Sussex County in 2024 (344 in 5+ unit buildings).
Forward outlook
- Local home prices are declining (-0.8%/yr); year-one equity from $4k of loan paydown is wiped out by about $5k of value loss. Plan a longer hold.
- Sussex County population projected at +25% by 2050 — long-run rental-demand tailwind backs the buy-and-hold thesis.
Negotiation context
- It's been on market 164 days — a 12% lower offer ($297k) is reasonable based on typical stale-listing flexibility.
Risks & watch-outs
- Watch-outs: flood insurance adds $56/mo.
- Climate carrying-cost: major flood risk; severe wind risk, 80% chance of damaging wind over 30y; extreme-heat days projected 7→18/yr by 2055 (HVAC capex compounding) — expect insurance premiums to compound above CPI over the hold.
Questions for the listing agent
- What do current leases actually rent for vs. the listed asking? Can we see a recent rent roll and the last 12 months of T-12 income?
- It's been on market 164 days. Have you received any prior offers? Is the seller open to a 26% concession, seller financing, or rate buy-down credit?
- What's the actual annual flood-insurance premium (NFIP or private), and is the property in a SFHA with mandatory coverage?
- Why hasn't it sold? Are there any deal-killer items the seller is aware of (foundation, flood, title, zoning, code violations)?
- Is there a deadline driving the sale (1031 exchange, divorce, estate, relocation)? That informs how much negotiation room exists.
- Schools are F-rated, which usually means shorter tenancies and higher turnover. Who's the typical renter profile here, and what's been the actual vacancy rate?
- The area grade is low — what's the realistic commute time and amenity access for the typical tenant pool here? Any planned neighborhood developments (good or bad) we should know about?
- What's the average days-on-market for RENTAL listings here right now (not sales)? A rising rental-DOM trend means longer vacancies and softer asking-rent achievability than the comps imply.
- What's the recent tenant-quality profile in this submarket — average credit score on applications, eviction rate, late-payment / NSF rate, and stable-employment percentage? A property-management company in the area should have these aggregated.
- How much new for-sale + rental construction is in the pipeline within 1–3 miles? Heavy new supply typically softens prices + rents 12–24 months out; constrained supply supports both.
Investment metrics
- 1% rule
- 0.44% ✗
- Cap rate
- 2.22%
- Cash-on-cash
- -14.56%
- DSCR
- 0.35
- GRM
- 18.7
CMA / ARV
- ARV (median comp)
- $560,031
- List price
- $337,600
- Delta
- -39.72%
- Verdict
- UNDERPRICED
- Comps
- 20 within 1.0 mi
Show comp detail 12 sales within ~0.75 mi
| Address | Dist | Beds/Ba | Sqft | Sold | Price | $/sf | Match |
|---|---|---|---|---|---|---|---|
| 32256 Old School Ln | 0.18mi | 3/2.0 | 1,700 (-10%) | 2mo | $620,000 | $365 | 73 |
| 32670 Cedar Dr | 0.13mi | 4/2.0 (+1) | 1,700 (-10%) | 1mo | $386,000 | $227 | 72 |
| 18 Whites Creek Ln | 0.28mi | 4/2.5 (+1) | 1,840 (-2%) | 5mo | $594,000 | $323 | 71 |
| 12 Windmill Ln | 0.59mi | 3/2.0 | 1,837 (-3%) | 2mo | $399,900 | $218 | 66 |
| 31870 Mill Run Dr | 0.32mi | 3/2.5 | 2,100 (+11%) | 0mo | $475,000 | $226 | 64 |
| 18 Hudson Ave | 0.49mi | 3/2.5 | 2,020 (+7%) | 1mo | $549,900 | $272 | 63 |
| 36728 Baltimore Ave | 0.69mi | 3/2.0 | 1,850 (-2%) | 3mo | $385,000 | $208 | 62 |
| 12 Woods Cir | 0.45mi | 3/2.0 | 2,080 (+10%) | 3mo | $415,000 | $200 | 59 |
| 14 Woods Cir | 0.44mi | 3/2.0 | 1,716 (-9%) | 6mo | $519,000 | $302 | 59 |
| 38 Hudson Ave | 0.36mi | 3/2.0 | 1,632 (-14%) | 2mo | $450,000 | $276 | 59 |
| 223 Chad Pl | 0.43mi | 3/2.0 | 1,617 (-14%) | 0mo | $580,000 | $359 | 56 |
| 37333 Kestrel Way | 0.55mi | 3/3.0 | 2,146 (+14%) | 1mo | $557,500 | $260 | 46 |
Match score weights: distance 35% · size 25% · config 20% · recency 20%. Top-matched comps best support the ARV.
Projected returns pro-forma
-0.85% appreciation · 3.0% rent growth · sell at horizon
- IRR
- -24.6%
- Equity multiple
- -0.04×
- Total profit
- $-163,002
- Equity at exit
- $139,216
- IRR
- -18.3%
- Equity multiple
- -0.61×
- Total profit
- $-252,661
- Equity at exit
- $149,649
Cash invested: $156,809 (down + closing). Projections, not guarantees.
Landlord ↔ Tenant lean methodology
- Overall (STATE)
- 70 Landlord-Friendly
- State Delaware
- 70 Landlord-Friendly · D+7
- County
- — inherits STATE
- City
- — inherits STATE
ZIP-level market 19967
- Home prices YoY
- -0.3%
- Active inventory
- 127
- Price-to-rent
- 11.3×
Monthly cashflow live
- Estimated rent
- $2,491 medium interval (Pro) →
- Mortgage (P&I)
- −$2,937
- Tax est. 1.5%
- −$700 /mo · $8,400/yr
- Insurance
- −$233
- Flood insurance flood zone
- −$56 /mo · $666/yr
- HOA
- −$0
- Vacancy / Maint / Mgmt
- −$523
- Net cashflow
- $-1,958
Break-even live
Sensitivity live
| Price | -10% $-1,571 | -5% $-1,764 | +0% $-1,958 | +5% $-2,151 | +10% $-2,345 |
|---|---|---|---|---|---|
| Rent | -10% $-2,155 | -5% $-2,056 | +0% $-1,958 | +5% $-1,859 | +10% $-1,761 |
| Rate | -1.0pp $-1,676 | -0.5pp $-1,815 | base $-1,958 | +0.5pp $-2,103 | +1.0pp $-2,251 |
UW: 25.0% down · 7.5% · 30yr · 1.5% tax · 5.0% vac · 8.0% maint · 8.0% mgmt
Financing live
Cash to close
- Down payment
- $140,008
- Closing costs
- $16,801
- Reserves months
- —
- Total cash needed
- —
Loan-product check · same deal, 3 products live
Conventional
25% down · 7.5% · 30yr
- Down + closing
- —
- Monthly P&I
- —
- Monthly cashflow
- —
- DSCR
- —
- Eligible?
- —
Personal DTI + credit; lowest rate.
DSCR
20% down · 8.5% · 30yr
- Down + closing
- —
- Monthly P&I
- —
- Monthly cashflow
- —
- DSCR
- —
- Eligible?
- —
No personal income docs; deal must DSCR.
Hard money
10% down · 12.0% · 12mo
- Down + closing
- —
- Monthly P&I
- —
- Monthly cashflow
- —
- DSCR
- —
- Eligible?
- —
Short-term bridge; refi at stabilization.
Rent comps 4 comps
| Address | Beds | Baths | Sqft | Rent | $/sqft | DOM | Units | Dist |
|---|---|---|---|---|---|---|---|---|
| 21 Village Green Dr Ocean View, DE | 3.0 | 2.5 | 2076 | $2,445 | $1.18 | 15d | 3 | 0.79mi |
| 30839 Cedar Neck Rd Ocean View, DE | 4.0 | 2.0 | 2040 | $2,950 | $1.45 | 45d | 1 | 1.16mi |
| 37580 Mahogany St Ocean View, DE | 4.0 | 3.5 | 1600 | $2,300 | $1.44 | 45d | 1 | 1.18mi |
| 33697 Ashland Dr Frankford, DE | 3.0 | 2.0 | 1696 | $2,200 | $1.30 | 45d | 1 | 1.50mi |
Listing history 17 events
-
2026-06-21days on market $337,600 Active 164 DOM
-
2026-06-18days on market $337,600 Active 161 DOM
-
2026-06-17days on market $337,600 Active 160 DOM
-
2026-06-16days on market $337,600 Active 159 DOM
-
2026-06-15days on market $337,600 Active 158 DOM
-
2026-06-14days on market $337,600 Active 156 DOM
-
2026-06-13days on market $337,600 Active 155 DOM
-
2026-06-10days on market $337,600 Active 153 DOM
-
2026-06-09days on market $337,600 Active 152 DOM
-
2026-06-08days on market $337,600 Active 151 DOM
-
2026-06-07days on market $337,600 Active 150 DOM
-
2026-06-02days on market $337,600 Active 145 DOM
-
2026-06-01days on market $337,600 Active 144 DOM
-
2026-05-31days on market $337,600 Active 143 DOM
-
2026-05-30days on market $337,600 Active 142 DOM
-
2026-03-20price $337,600 1220-char remark
Show marketing remark (1220 chars)
The Sunnyside by Bay to Beach Builders is a thoughtfully designed ranch-style home offering 2,108 heated sq. ft. , 3 bedrooms, 2 baths, and a 2-car garage-ideal for families, retirees, or anyone seeking modern one-level living. Its open-concept layout maximizes flow and natural light, with the kitchen, dining area, and great room creating an airy central gathering space. The kitchen features a large island, ample cabinetry, and a walk-in pantry, while an optional fireplace adds cozy charm. The private owner's suite includes a spacious bedroom, walk-in closet, and luxury bath with dual vanities and optional upgrades. Two additional bedrooms, each with walk-in closets, sit on the opposite side of the home-perfect for guests, children, or a home office. Expansion options such as a sunroom, covered porch, or deck offer extra space to enjoy Delaware and Maryland's seasons. A large mudroom and utility area off the garage keep daily life organized. With optional porch styles, a side-load garage, and flexible room uses, the Sunnyside delivers custom feel without sacrificing efficiency. Whether building in Middletown, Ocean View, or the scenic Eastern Shore, this plan blends charm, function, and modern living.
-
2026-01-08$332,700 Active 1220-char remark
Show marketing remark (1220 chars)
The Sunnyside by Bay to Beach Builders is a thoughtfully designed ranch-style home offering 2,108 heated sq. ft. , 3 bedrooms, 2 baths, and a 2-car garage-ideal for families, retirees, or anyone seeking modern one-level living. Its open-concept layout maximizes flow and natural light, with the kitchen, dining area, and great room creating an airy central gathering space. The kitchen features a large island, ample cabinetry, and a walk-in pantry, while an optional fireplace adds cozy charm. The private owner's suite includes a spacious bedroom, walk-in closet, and luxury bath with dual vanities and optional upgrades. Two additional bedrooms, each with walk-in closets, sit on the opposite side of the home-perfect for guests, children, or a home office. Expansion options such as a sunroom, covered porch, or deck offer extra space to enjoy Delaware and Maryland's seasons. A large mudroom and utility area off the garage keep daily life organized. With optional porch styles, a side-load garage, and flexible room uses, the Sunnyside delivers custom feel without sacrificing efficiency. Whether building in Middletown, Ocean View, or the scenic Eastern Shore, this plan blends charm, function, and modern living.
ⓘ Source: listings_history table (triggers on properties + properties_extension) + one-shot
backfill from property_details.listing_events for pre-trigger history.
Climate risk First Street
- Flood 7/10 Severe FEMA zone X (unshaded) · 93% chance over 30 yrs
- Wildfire 1/10 Low
- Heat 8/10 Severe 7 d/yr ≥100°F today · 18 d/yr by 30 yrs out
- Wind 8/10 Severe 80% chance of damaging wind over 30 yrs
- Air quality 2/10 Low 0 unhealthy d/yr today · 1 by 30 yrs out
Nearby sold comps map
Loading sold comps map…
Walkable amenities ~0.75 mi
Loading nearby amenities…
Taxation est. · year 1
- Rental income
- $29,893
- − Mortgage interest
- −$31,370
- − Property taxes
- −$8,400
- − Insurance
- −$3,467
- − Repairs & maintenance
- −$2,391
- − Management
- −$2,391
- − Depreciation
- −$16,292
- Taxable loss
- −$34,419
- Est. tax savings @ 24.0%
- +$8,261
- After-tax cash flow
- $-15,233/yr
For passive investors: Depreciation is non-cash, so a rental often shows a tax loss while cash-flowing — sheltering income. Rental losses are passive: they offset passive income freely, and up to $25,000/yr can offset ordinary (W-2) income if you actively participate and your MAGI is under $100k (phasing out to $0 by $150k); unused losses carry forward. On sale, claimed depreciation is recaptured at up to 25%, and gains may owe capital-gains tax (a 1031 exchange can defer both). Figures are a year-1 estimate at your 24.0% rate — not tax advice; consult a CPA.
Schools (NCES district)
- District
- Indian River School District
- NCES district ID
- 1000680
- Math proficiency
- 25% ▼ -27.00%
- Reading proficiency
- 41% ▼ -17.00%
- Median HH income
- $53,838
- Composite
- 28.99/100
- National rank
- #6620
- State rank
- #14 of 26 in DE
Livability — Millville
- Score
- 64/100
- State rank
- #49
- US rank
- #13839
Category grades
Schools grade is shown separately in the Schools card above.
Census & demographics
- Census place
- Millville, DE
- City population
- 2,093
- Population (ZIP)
- 2,093
Population outlook (Sussex County) Hauer SSP2
- Today (2025)
- 248,853 people
- By 2030
- 264,464 · +6.3%
- By 2040
- 290,980 · +16.9%
- By 2050
- 311,259 · +25.1%
- By 2075
- 352,488 · +41.6%
- By 2100
- 367,406 · +47.6%
Race, ethnicity, and origin ACS 2023
- Neighborhood character
- Predominantly White (93%)
- Race & ethnicity
- White 93% Hispanic / Latino 2% Two or more races 2% Black 1%
- Common ancestry
- Romanian 6% Lithuanian 5% Italian 4%
- Foreign-born
- 4% · Canada
- Languages at home
- 96% English-only · Other Asian/Pacific 1% Spanish 1% Other Indo-European 1%
Political lean MEDSL · Sussex
- 2024 margin
- R (+11.0) · D 43.9% · R 54.9% · Other 1.2%
- 2008→2024 swing
- -2.4pp toward R · 2008: -8.6pp · 2024: -11.0pp
- All cycles
- 2024: R+11.0 2020: R+11.2 2016: R+22.0 2012: R+13.0 2008: R+8.6
Not yet ingested
- Civics
- —
Market trends
- HPI YoY
- ▼ -0.85%
- Current HPI
- 263.8607
- Rent YoY
- —
- Metro
- —
- State GDP YoY
- —
- F500 in state
- 0
Price history
+1.5% since first listed2 events — show timeline
- 2026-03-20 Price Changed $337,600 Zillow
- 2026-01-08 Listed $332,700 Zillow
Cash-flow waterfall
monthlySold comps — $/sqft
last 12 mo · ≤1 miLoading sold comps…