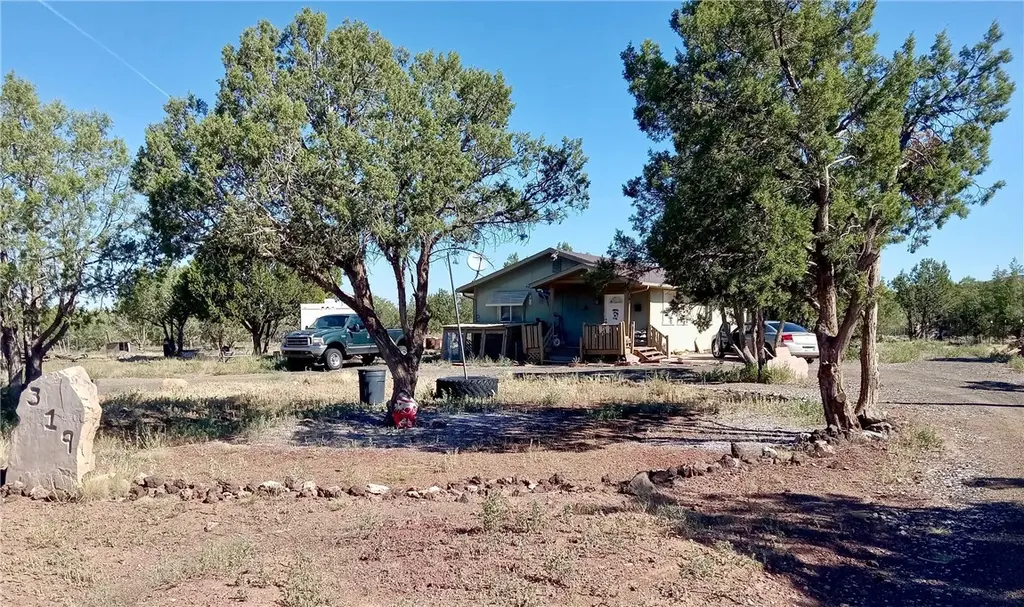
319 W Mesa Dr · Kaibab Estates West, AZ
Flood risk 1/10 · Minimal
- FEMA flood zone
- X (unshaded)
- Chance of flooding over 30 yrs
- 0.0%
- Est. flood insurance / yr
- $507 – $1,088
Fire risk 4/10 · Minor
- Est. fire insurance / yr
- $610 – $1,132
Heat risk 4/10 · Minor
- Hot days now (above 92°F)
- 7 days/yr
- Hot days in 30 yrs
- 20 days/yr
Wind risk 1/10 · Minimal
- Chance of severe wind over 30 yrs
- —
Air-quality risk 1/10 · Minimal
- Unhealthy air days now
- 0 days/yr
- Unhealthy air days in 30 yrs
- 0 days/yr
Risk factors via First Street. Map © Google.
Why this score? — see what drove the D grade
The composite is a weighted blend of 9 inputs, each scored 0–100. Each bar is that input's sub-score; the figure is the points it added to the 100-point composite (weight × sub-score).
- ARV discount +11.1/15.0
- Appreciation +10.0/10.0
- Cash flow +7.6/30.0
- Schools +5.5/10.0
- Rent growth +2.5/5.0
- Livability +2.5/5.0
- Condition / age +2.5/5.0
- DSCR +1.7/10.0
- 1% rule +1.1/10.0
$249,900
🖨 Deal sheet (PDF) 📄 Offer letter ✓ Due diligence
Listing remarks MLS
* Rare Opportunity, Site Built Home on 2.48 Acres! * Discover a truly special property that s full of heart and history. This custom built 4 bedroom, 2 bathroom home sits on 2.48 acres of usable land, a perfect blend of comfort, space, and privacy. Lovingly maintained, it s now ready for its next chapter and a new owner to create lasting memories. Home features include * Spacious floorplan with 4 bedrooms and 2 full bathrooms * Two additional rooms with concrete flooring, ideal for storage, a workshop, or future expansion * Central heat and air conditioning for year round comfort * All electric setup plus a wood burning stove * 220V power, septic system, and a 2,500-gallon fresh water storage tank * Whether you're looking for a full time residence or a private vacation getaway, this home offers the perfect setting. Enjoy the best of both worlds with a convenient location and a peaceful, secluded lifestyle surrounded by nature. This property lies in a region renowned for its natural beauty. Explore the nearby Grand Canyon National Park, a globally celebrated geological wonder, or venture into the Coconino National Forest, where the landscapes range from the iconic Red Rocks of Sedona to lush pine forests and alpine meadows. A true gem!! Don t miss your chance to own a piece of Arizona s scenic countryside!
Key facts
- 2.48 acres
- Custom built
- 220v power
Tags
Neighborhood map
What this means for you Summary
Snapshot
- This is a 4-bed/2.0-bath single-family listed at $250k.
Deal economics
- At list price, monthly cash flow is $-298 ($-4k/yr) — negative.
- To cash-flow at today's rent, offer at most $197k (21.1% below list).
- To meet the 1% rule (rent ≥ 1% of price), the offer needs to be $151k (39.4% below list).
- Recommended offer: $151k (39.4% below list) — sets the bar for 1% rule.
- Cap rate 4.9% vs local median 2.6% in Kaibab Estates West — top-decile yield for the area; either an underpriced asset or a hidden risk that comps aren't pricing in. Stress-test before assuming the spread holds.
Location & tenants
- Location reads: area grade D — affects rentability + tenant quality, not the cash-flow math above.
- Ash Fork Joint Unified District (4471) (rural): math 65% / reading 65% proficiency, ranked #58 of 501 in AZ (top 12%) — acceptable for families but not a draw, mixed tenant base, ~2y average lease; 87% free/reduced lunch — lower-income household profile, screen leases tightly.
- Zoned schools: Ash Fork Elementary School (math 44% / reading 44%, grade F, #339 of 1,109 statewide, top 32%, 119 students, 79% FRL); Ash Fork Middle School (math 47% / reading 57%, grade C+, #21 of 218 statewide, top 9%, 74 students, 77% FRL); Ash Fork High School (math 50% / reading 50%, grade D, #38 of 381 statewide, top 11%, 100 students, 75% FRL).
- Zoned-school proficiency averages 49% at this address vs 65% district-wide (-16 pts) — the specific schools serving this property underperform the Ash Fork Joint Unified District (4471) average; the district grade overstates school quality for this exact location.
- Market conditions: 678 active listings in the ZIP; 698 units permitted in Coconino County in 2024 (354 in 5+ unit buildings).
Forward outlook
- In year one you build about $27k of equity ($2k loan paydown + $25k appreciation (10.0% local appreciation)).
- Coconino County population projected at +20% by 2050 — long-run rental-demand tailwind backs the buy-and-hold thesis.
- By year 2, paydown + projected appreciation supports a ~$43k cash-out refi (75% LTV) — recoverable capital for the next deal without selling this one.
Negotiation context
- It's been on market 316 days — a 12% lower offer ($220k) is reasonable based on typical stale-listing flexibility.
- Current owner paid $74k; list at $250k implies a 238% gain — meaningful room to come down on a strong offer.
Questions for the listing agent
- What do current leases actually rent for vs. the listed asking? Can we see a recent rent roll and the last 12 months of T-12 income?
- It's been on market 316 days. Have you received any prior offers? Is the seller open to a 39% concession, seller financing, or rate buy-down credit?
- Why hasn't it sold? Are there any deal-killer items the seller is aware of (foundation, flood, title, zoning, code violations)?
- Is there a deadline driving the sale (1031 exchange, divorce, estate, relocation)? That informs how much negotiation room exists.
- The area grade is low — what's the realistic commute time and amenity access for the typical tenant pool here? Any planned neighborhood developments (good or bad) we should know about?
- What's the average days-on-market for RENTAL listings here right now (not sales)? A rising rental-DOM trend means longer vacancies and softer asking-rent achievability than the comps imply.
- What's the recent tenant-quality profile in this submarket — average credit score on applications, eviction rate, late-payment / NSF rate, and stable-employment percentage? A property-management company in the area should have these aggregated.
- How much new for-sale + rental construction is in the pipeline within 1–3 miles? Heavy new supply typically softens prices + rents 12–24 months out; constrained supply supports both.
Investment metrics
- 1% rule
- 0.61% ✗
- Cap rate
- 4.86%
- Cash-on-cash
- -5.12%
- DSCR
- 0.77
- GRM
- 13.8
CMA / ARV
- ARV (median comp)
- $271,913
- List price
- $249,900
- Delta
- -8.10%
- Verdict
- FAIR
- Comps
- 4 within 1.0 mi
Show comp detail 1 sale within ~0.75 mi
| Address | Dist | Beds/Ba | Sqft | Sold | Price | $/sf | Match |
|---|---|---|---|---|---|---|---|
| 588 W Mesa Dr | 0.26mi | 3/2.0 (-1) | 1,333 (-5%) | 10mo | $220,000 | $165 | 65 |
Match score weights: distance 35% · size 25% · config 20% · recency 20%. Top-matched comps best support the ARV.
Projected returns pro-forma
10.0% appreciation · 3.0% rent growth · sell at horizon
- IRR
- 20.6%
- Equity multiple
- 2.67×
- Total profit
- $116,984
- Equity at exit
- $225,130
- IRR
- 18.7%
- Equity multiple
- 6.13×
- Total profit
- $359,201
- Equity at exit
- $485,501
Cash invested: $69,972 (down + closing). Projections, not guarantees.
Landlord ↔ Tenant lean methodology
- Overall (STATE)
- 87 Strongly Landlord-Friendly
- State Arizona
- 87 Strongly Landlord-Friendly · R+3
- County
- — inherits STATE
- City
- — inherits STATE
ZIP-level market 86046
- Home prices YoY
- 4.3%
- Active inventory
- 678
- Price-to-rent
- 13.8×
Monthly cashflow live
- Estimated rent
- $1,514 medium interval (Pro) →
- Mortgage (P&I)
- −$1,311
- Tax from tax record
- −$80 /mo · $957/yr
- Insurance
- −$104
- HOA
- −$0
- Vacancy / Maint / Mgmt
- −$318
- Net cashflow
- $-298
Break-even live
Sensitivity live
| Price | -10% $-157 | -5% $-228 | +0% $-298 | +5% $-369 | +10% $-440 |
|---|---|---|---|---|---|
| Rent | -10% $-418 | -5% $-358 | +0% $-298 | +5% $-238 | +10% $-179 |
| Rate | -1.0pp $-172 | -0.5pp $-235 | base $-298 | +0.5pp $-363 | +1.0pp $-429 |
UW: 25.0% down · 7.5% · 30yr · 1.5% tax · 5.0% vac · 8.0% maint · 8.0% mgmt
Financing live
Cash to close
- Down payment
- $62,475
- Closing costs
- $7,497
- Reserves months
- —
- Total cash needed
- —
Loan-product check · same deal, 3 products live
Conventional
25% down · 7.5% · 30yr
- Down + closing
- —
- Monthly P&I
- —
- Monthly cashflow
- —
- DSCR
- —
- Eligible?
- —
Personal DTI + credit; lowest rate.
DSCR
20% down · 8.5% · 30yr
- Down + closing
- —
- Monthly P&I
- —
- Monthly cashflow
- —
- DSCR
- —
- Eligible?
- —
No personal income docs; deal must DSCR.
Hard money
10% down · 12.0% · 12mo
- Down + closing
- —
- Monthly P&I
- —
- Monthly cashflow
- —
- DSCR
- —
- Eligible?
- —
Short-term bridge; refi at stabilization.
Listing history 21 events
-
2026-06-21days on market $249,900 Active 316 DOM
-
2026-06-19days on market $249,900 Active 314 DOM
-
2026-06-18days on market $249,900 Active 313 DOM
-
2026-06-17days on market $249,900 Active 312 DOM
-
2026-06-16days on market $249,900 Active 311 DOM
-
2026-06-15days on market $249,900 Active 310 DOM
-
2026-06-14days on market $249,900 Active 308 DOM
-
2026-06-12days on market $249,900 Active 307 DOM
-
2026-06-09days on market $249,900 Active 304 DOM
-
2026-06-08days on market $249,900 Active 303 DOM
-
2026-06-07days on market $249,900 Active 302 DOM
-
2026-06-07days on market $249,900 Active 301 DOM
-
2026-06-04days on market $249,900 Active 298 DOM
-
2026-06-02days on market $249,900 Active 297 DOM
-
2026-06-01days on market $249,900 Active 296 DOM
-
2026-05-31days on market $249,900 Active 295 DOM
-
2026-05-31days on market $249,900 Active 294 DOM
-
2025-08-09$249,900 Active 1328-char remark
Show marketing remark (1328 chars)
* Rare Opportunity, Site Built Home on 2.48 Acres! * Discover a truly special property that s full of heart and history. This custom built 4 bedroom, 2 bathroom home sits on 2.48 acres of usable land, a perfect blend of comfort, space, and privacy. Lovingly maintained, it s now ready for its next chapter and a new owner to create lasting memories. Home features include * Spacious floorplan with 4 bedrooms and 2 full bathrooms * Two additional rooms with concrete flooring, ideal for storage, a workshop, or future expansion * Central heat and air conditioning for year round comfort * All electric setup plus a wood burning stove * 220V power, septic system, and a 2,500-gallon fresh water storage tank * Whether you're looking for a full time residence or a private vacation getaway, this home offers the perfect setting. Enjoy the best of both worlds with a convenient location and a peaceful, secluded lifestyle surrounded by nature. This property lies in a region renowned for its natural beauty. Explore the nearby Grand Canyon National Park, a globally celebrated geological wonder, or venture into the Coconino National Forest, where the landscapes range from the iconic Red Rocks of Sedona to lush pine forests and alpine meadows. A true gem!! Don t miss your chance to own a piece of Arizona s scenic countryside!
-
2020-01-09soldstatus $74,000
-
2014-03-06soldstatus $42,200 237-char remark
Show marketing remark (237 chars)
GET AWAY FROM IT ALL HERE! CHARMING SITE BUILT HOME ON ON 2.48 ACRES. INCLUDES 4 BEDROOMS,2 BATHS.LARGE OPEN KITCHEN AND LIVING ROOM AREA . APPLIANCES INCLUDE RANGE,MICROWAVE AND REFRIGERATOR. LARGE ATTACHED WORKSHOP.SOLD AS ISCASH ONLY
-
2007-04-27soldstatus $155,000
ⓘ Source: listings_history table (triggers on properties + properties_extension) + one-shot
backfill from property_details.listing_events for pre-trigger history.
Tax reassessment forecast AZ · Resets to sale price
- Current annual tax
- $957 · $80/mo
- Projected year-2 tax
- $1,649 · $137/mo
- Expected delta
- +$692/yr (+$58/mo · 72.4%)
ⓘ Screening estimate from a state-policy table — verify with the county assessor before closing.
Climate risk First Street
- Flood 1/10 Low FEMA zone X (unshaded) · 0% chance over 30 yrs
- Wildfire 4/10 Moderate
- Heat 4/10 Moderate 7 d/yr ≥92°F today · 20 d/yr by 30 yrs out
- Wind 1/10 Low
- Air quality 1/10 Low 0 unhealthy d/yr today · 0 by 30 yrs out
Nearby sold comps map
Loading sold comps map…
Walkable amenities ~0.75 mi
Loading nearby amenities…
Taxation est. · year 1
- Rental income
- $18,168
- − Mortgage interest
- −$13,998
- − Property taxes
- −$957
- − Insurance
- −$1,250
- − Repairs & maintenance
- −$1,453
- − Management
- −$1,453
- − Depreciation
- −$7,270
- Taxable loss
- −$8,213
- Est. tax savings @ 24.0%
- +$1,971
- After-tax cash flow
- $-1,608/yr
For passive investors: Depreciation is non-cash, so a rental often shows a tax loss while cash-flowing — sheltering income. Rental losses are passive: they offset passive income freely, and up to $25,000/yr can offset ordinary (W-2) income if you actively participate and your MAGI is under $100k (phasing out to $0 by $150k); unused losses carry forward. On sale, claimed depreciation is recaptured at up to 25%, and gains may owe capital-gains tax (a 1031 exchange can defer both). Figures are a year-1 estimate at your 24.0% rate — not tax advice; consult a CPA.
Schools (NCES district)
- District
- Ash Fork Joint Unified District (4471)
- NCES district ID
- 0400910
- Math proficiency
- 65% ▲ 5.00%
- Reading proficiency
- 65% ▲ 10.00%
- Median HH income
- $30,345
- Composite
- 54.75/100
- National rank
- #2833
- State rank
- #58 of 501 in AZ
Livability — Kaibab Estates West
No livability data for this city. (Only ~50 U.S. cities are tracked.)
Census & demographics
- Census place
- Kaibab Estates West, AZ
- Population (ZIP)
- 6,669
Population outlook (Coconino County) Hauer SSP2
- Today (2025)
- 150,645 people
- By 2030
- 156,857 · +4.1%
- By 2040
- 168,714 · +12.0%
- By 2050
- 181,082 · +20.2%
- By 2075
- 218,399 · +45.0%
- By 2100
- 238,853 · +58.6%
Race, ethnicity, and origin ACS 2023
- Neighborhood character
- Predominantly White (66%)
- Race & ethnicity
- White 66% Hispanic / Latino 26% Two or more races 12% Asian 1%
- Hispanic origin (detail)
- Mexican 16%
- Common ancestry
- Slovak 4% Lithuanian 2% Romanian 2%
- Foreign-born
- 6% · Canada
- Languages at home
- 89% English-only · Spanish 9%
Political lean MEDSL · Coconino
- 2024 margin
- D (+19.9) · D 59.2% · R 39.4% · Other 1.4%
- 2008→2024 swing
- +2.9pp toward D · 2008: 17.0pp · 2024: 19.9pp
- All cycles
- 2024: D+19.9 2020: D+24.1 2016: D+19.4 2012: D+14.9 2008: D+17.0
Not yet ingested
- Civics
- —
Market trends
- HPI YoY
- ▲ 19.78%
- Current HPI
- 474.3252
- Rent YoY
- —
- Metro
- —
- State GDP YoY
- ▲ 4.54%
- F500 in state
- 20
Industry mix (Fortune 500 HQ in AZ)
| Industry | F500 HQs | Revenue |
|---|---|---|
| Technology | 2 | $13B |
|
||
| Mining / Metals | 1 | $23B |
|
||
| Environmental Services | 1 | $16B |
|
||
| Metals / Steel | 1 | $14B |
|
||
| Technology Distribution | 1 | $9B |
|
||
| Homebuilding | 1 | $8B |
|
||
Price history
+61.2% since first listed4 events — show timeline
- 2025-08-09 Listed $249,900 WARDEX
- 2020-01-09 Sold (Public Records) $74,000 Public Records
- 2014-03-06 Sold (MLS) $42,200 PAARMLS as Distributed by MLS Grid
- 2007-04-27 Sold (Public Records) $155,000 Public Records
Property tax history
+3.6%/yrLatest (2025): $957 · +4.5% YoY. Source: county tax records.
Cash-flow waterfall
monthlySold comps — $/sqft
last 12 mo · ≤1 miLoading sold comps…