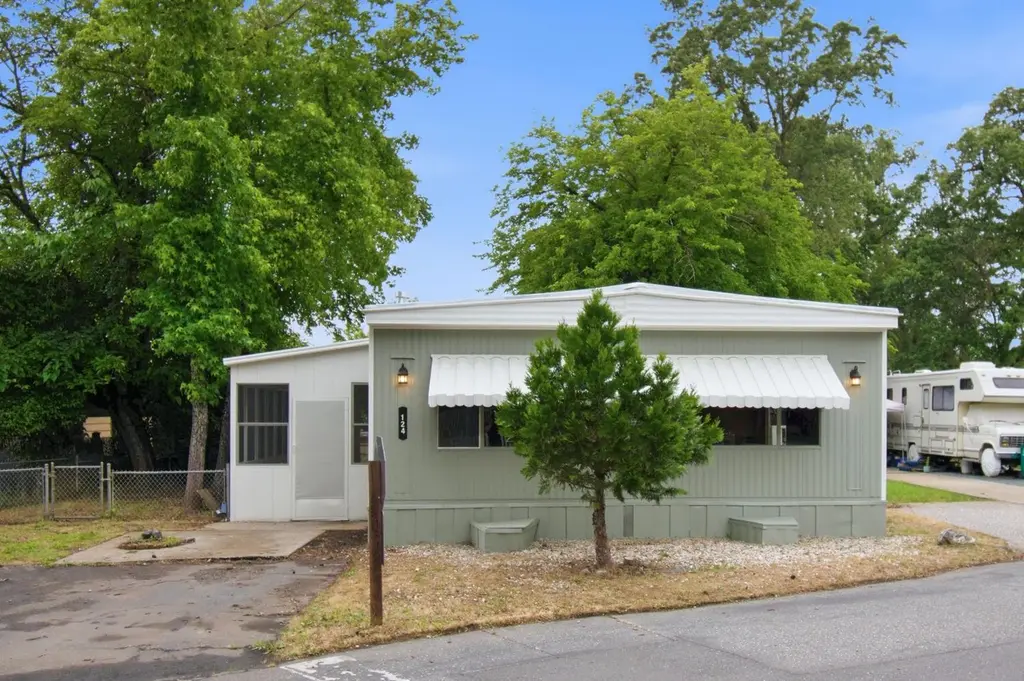
124 Lark St · Penn Valley, CA
Flood risk 1/10 · Minimal
- FEMA flood zone
- X (unshaded)
- Chance of flooding over 30 yrs
- 0.0%
- Est. flood insurance / yr
- $507 – $1,088
Fire risk 10/10 · Severe
- Est. fire insurance / yr
- $659 – $1,223
Heat risk 6/10 · Moderate
- Hot days now (above 98°F)
- 7 days/yr
- Hot days in 30 yrs
- 17 days/yr
Wind risk 1/10 · Minimal
- Chance of severe wind over 30 yrs
- —
Air-quality risk 10/10 · Severe
- Unhealthy air days now
- 31 days/yr
- Unhealthy air days in 30 yrs
- 38 days/yr
Risk factors via First Street. Map © Google.
Why this score? — see what drove the B- grade
The composite is a weighted blend of 9 inputs, each scored 0–100. Each bar is that input's sub-score; the figure is the points it added to the 100-point composite (weight × sub-score).
- Cash flow +30.0/30.0
- 1% rule +10.0/10.0
- DSCR +10.0/10.0
- ARV discount +7.5/15.0
- Schools +3.2/10.0
- Rent growth +2.5/5.0
- Livability +2.5/5.0
- Condition / age +2.5/5.0
- Appreciation +0.0/10.0
$64,900
🖨 Deal sheet 📄 Offer letter ✓ Due diligence
Listing remarks
Grab your coffee, settle into the screened room, and let the stress of the day melt away. Surrounded by mature trees and nestled on a desirable corner lot, this inviting home offers comfort, space, and tremendous value in Penn Valley's Creekside Village All-Ages community. Freshly painted and thoughtfully refreshed, this 2-bedroom, 2-bath double-wide feels warm, welcoming, and ready for its next chapter. Step inside to find new flooring, updated features, and spacious living areas designed for everyday comfort. The charming dining area features a built-in hutch, while the primary suite offers built-in drawers and an new shower enclosure. With room to relax, room to entertain, and room to ma
Key facts
- Flexible floor plan
- Built-in hutch
- Corner lot
Tags
Property features AI
Finance
- Other: Located at 124 Lark Street, Penn Valley, CA 95946; Within Nevada County
- HOA & community: No homeowners association; Land lease in effect ($900)
Exterior
- Parking: Assigned parking; Guest parking available; No garage
- Utilities: Cable available; Internet available; Individual electric meter; Individual gas meter; Public sewer; Private/shared well water
- Home design: Manufactured home in park; Double wide; Updated/remodeled and original elements; Built in 1970
- Construction: Metal roof; Skirting: aluminum/metal/other; Manufacturer/Make: La Cruz
- Exterior features: Porch awning; Backyard; Front yard; Fenced; Close to clubhouse; Corner lot; Landscaped
Interior
- Kitchen: Free-standing gas range; Free-standing gas oven; Free-standing refrigerator; Hood over range
- Bedrooms: 2 bedrooms (includes master bedroom)
- Flooring: Laminate
- Bathrooms: 2 full bathrooms; Tub with shower over; Shower stall(s)
- Heating & cooling: Room air conditioning; No central cooling; Other heating
- Interior features: Pantry cabinet; Synthetic countertops; Porch steps; Covered deck; Screened-in patio; Enclosed patio; Pets allowed (cats and dogs; number limit)
- Laundry & utility: Laundry closet with hookups; Inside laundry area/room
Neighborhood map
What this means for you Summary
Snapshot
- This is a 2-bed/2.0-bath manufactured listed at $65k.
Deal economics
- At list price, monthly cash flow is $1k ($14k/yr) — positive.
- The deal already cash-flows at list — no discount required.
- Meets the 1% rule at list price ($2k rent vs $65k).
- Cap rate 27.7% vs local median 2.8% in Penn Valley — top-decile yield for the area; either an underpriced asset or a hidden risk that comps aren't pricing in. Stress-test before assuming the spread holds.
Location & tenants
- Location reads 50/100 on livability (#1,129 in CA) — a working-class tenant base; expect higher turnover. Strengths: crime A; Watch: employment C-, schools D+, amenities F.
- Penn Valley Union Elementary (town): math 31% / reading 42% proficiency, ranked #253 of 517 in CA (top 49%) — families likely to look elsewhere, expect single-tenant / working-renter base with shorter leases.
- Market conditions: 146 active listings in the ZIP; 215 units permitted in Nevada County in 2024 (0 in 5+ unit buildings).
Forward outlook
- Local home prices are declining (-3.0%/yr); year-one equity from $449 of loan paydown is wiped out by about $2k of value loss. Plan a longer hold.
- Nevada County population projected at -14% by 2050 — secular population decline; favor cash flow + early exit over multi-decade hold.
- At projected returns (-3.0% appreciation + 3.0% rent growth), your $18k cash investment doubles in ~2 years — after that, you're playing with house money.
Negotiation context
- Only 8 days on market — expect competitive offers; lowballing is unlikely to land.
Risks & watch-outs
- Climate carrying-cost: severe wildfire risk; extreme-heat days projected 7→17/yr by 2055 (HVAC capex compounding) — expect insurance premiums to compound above CPI over the hold.
Questions for the listing agent
- Built in 1970 — when were the roof, HVAC, electrical panel, plumbing, and water heater last replaced?
- Is there a deadline driving the sale (1031 exchange, divorce, estate, relocation)? That informs how much negotiation room exists.
- Schools are D-rated, which usually means shorter tenancies and higher turnover. Who's the typical renter profile here, and what's been the actual vacancy rate?
- What's the average days-on-market for RENTAL listings here right now (not sales)? A rising rental-DOM trend means longer vacancies and softer asking-rent achievability than the comps imply.
- What's the recent tenant-quality profile in this submarket — average credit score on applications, eviction rate, late-payment / NSF rate, and stable-employment percentage? A property-management company in the area should have these aggregated.
- How much new for-sale + rental construction is in the pipeline within 1–3 miles? Heavy new supply typically softens prices + rents 12–24 months out; constrained supply supports both.
Investment metrics
- 1% rule
- 3.13% ✓
- Cap rate
- 27.72%
- Cash-on-cash
- 76.51%
- DSCR
- 4.40
- GRM
- 2.7
CMA / ARV
No comps found within radius.
Projected returns pro-forma
-3.0% appreciation · 3.0% rent growth · sell at horizon
- IRR
- 76.5%
- Equity multiple
- 4.48×
- Total profit
- $63,308
- Equity at exit
- $9,677
- IRR
- 80.1%
- Equity multiple
- 9.27×
- Total profit
- $150,273
- Equity at exit
- $5,611
Cash invested: $18,172 (down + closing). Projections, not guarantees.
Landlord ↔ Tenant lean methodology
- Overall (STATE)
- 18 Strongly Tenant-Friendly
- State California
- 18 Strongly Tenant-Friendly · D+13
- County
- — inherits STATE
- City
- — inherits STATE
ZIP-level market 95946
- Home prices YoY
- -33.5%
- Active inventory
- 146
- Price-to-rent
- 2.7×
Monthly cashflow live
- Estimated rent
- $2,034 medium interval (Pro) →
- Mortgage (P&I)
- −$340
- Tax est. 1.5%
- −$81 /mo · $974/yr
- Insurance
- −$27
- HOA
- −$0
- Vacancy / Maint / Mgmt
- −$427
- Net cashflow
- $1,159
Break-even live
UW: 25.0% down · 7.5% · 30yr · 1.5% tax · 5.0% vac · 8.0% maint · 8.0% mgmt
Financing live
Cash to close
- Down payment
- $16,225
- Closing costs
- $1,947
- Reserves months
- —
- Total cash needed
- —
Loan-product check · same deal, 3 products live
Conventional
25% down · 7.5% · 30yr
- Down + closing
- —
- Monthly P&I
- —
- Monthly cashflow
- —
- DSCR
- —
- Eligible?
- —
Personal DTI + credit; lowest rate.
DSCR
20% down · 8.5% · 30yr
- Down + closing
- —
- Monthly P&I
- —
- Monthly cashflow
- —
- DSCR
- —
- Eligible?
- —
No personal income docs; deal must DSCR.
Hard money
10% down · 12.0% · 12mo
- Down + closing
- —
- Monthly P&I
- —
- Monthly cashflow
- —
- DSCR
- —
- Eligible?
- —
Short-term bridge; refi at stabilization.
Listing history 7 events
-
2026-06-13statusdays on market $64,900 Pending 8 DOM
-
2026-06-10days on market $64,900 Active 7 DOM
-
2026-06-09days on market $64,900 Active 6 DOM
-
2026-06-08days on market $64,900 Active 5 DOM
-
2026-06-07days on market $64,900 Active 4 DOM
-
2026-06-03remarks 699-char remark
-
2026-06-03$64,900 Active 1 DOM
ⓘ Source: listings_history table (triggers on properties + properties_extension) + one-shot
backfill from property_details.listing_events for pre-trigger history.
Climate risk First Street
- Flood 1/10 Low FEMA zone X (unshaded) · 0% chance over 30 yrs
- Wildfire 10/10 Extreme
- Heat 6/10 Major 7 d/yr ≥98°F today · 17 d/yr by 30 yrs out
- Wind 1/10 Low
- Air quality 10/10 Extreme 31 unhealthy d/yr today · 38 by 30 yrs out
Nearby sold comps map
Loading sold comps map…
Walkable amenities ~0.75 mi
Loading nearby amenities…
Taxation est. · year 1
- Rental income
- $24,412
- − Mortgage interest
- −$3,635
- − Property taxes
- −$974
- − Insurance
- −$324
- − Repairs & maintenance
- −$1,953
- − Management
- −$1,953
- − Depreciation
- −$1,888
- Taxable income
- $13,685
- Est. tax owed @ 24.0%
- −$3,284
- After-tax cash flow
- $10,619/yr
For passive investors: Depreciation is non-cash, so a rental often shows a tax loss while cash-flowing — sheltering income. Rental losses are passive: they offset passive income freely, and up to $25,000/yr can offset ordinary (W-2) income if you actively participate and your MAGI is under $100k (phasing out to $0 by $150k); unused losses carry forward. On sale, claimed depreciation is recaptured at up to 25%, and gains may owe capital-gains tax (a 1031 exchange can defer both). Figures are a year-1 estimate at your 24.0% rate — not tax advice; consult a CPA.
Schools (NCES district)
- District
- Penn Valley Union Elementary
- NCES district ID
- 0601427
- Math proficiency
- 31% ▼ -9.00%
- Reading proficiency
- 42% ▼ -11.00%
- Median HH income
- $58,786
- Composite
- 32.4/100
- National rank
- #5728
- State rank
- #253 of 517 in CA
Livability — Penn Valley
- Score
- 50/100
- State rank
- #1129
- US rank
- #25672
Category grades
Schools grade is shown separately in the Schools card above.
Census & demographics
- Census place
- Penn Valley, CA
- Population (ZIP)
- 9,448
Population outlook (Nevada County) Hauer SSP2
- Today (2025)
- 98,490 people
- By 2030
- 97,295 · -1.2%
- By 2040
- 92,041 · -6.5%
- By 2050
- 85,164 · -13.5%
- By 2075
- 68,436 · -30.5%
- By 2100
- 49,536 · -49.7%
Race, ethnicity, and origin ACS 2023
- Neighborhood character
- Predominantly White (79%)
- Race & ethnicity
- White 79% Hispanic / Latino 14% Two or more races 13%
- Hispanic origin (detail)
- Mexican 7% Puerto Rican 4%
- Common ancestry
- Italian 5% Portuguese 3% Lithuanian 2%
- Foreign-born
- 2% · Canada, South Korea
- Languages at home
- 95% English-only · Spanish 4% French/Haitian/Cajun 1%
Political lean MEDSL · Nevada
- 2024 margin
- D (+12.2) · D 54.4% · R 42.1% · Other 3.5%
- 2008→2024 swing
- +6.9pp toward D · 2008: 5.3pp · 2024: 12.2pp
- All cycles
- 2024: D+12.2 2020: D+14.8 2016: D+4.5 2012: R+4.7 2008: D+5.3
Not yet ingested
- Civics
- —
Market trends
- HPI YoY
- ▼ -114.27%
- Current HPI
- 226.5683
- Rent YoY
- —
- Metro
- —
- State GDP YoY
- ▲ 3.21%
- F500 in state
- 116
Industry mix (Fortune 500 HQ in CA)
| Industry | F500 HQs | Revenue |
|---|---|---|
| Technology | 27 | $1,492B |
|
||
| Financial Services | 3 | $174B |
|
||
| Retail | 3 | $44B |
|
||
| Insurance | 3 | $26B |
|
||
| Media / Entertainment | 2 | $115B |
|
||
| Pharmaceuticals / Biotech | 2 | $62B |
|
||
Property tax history
-1.7%/yrLatest (2025): $42 · +1.5% YoY. Source: county tax records.
Cash-flow waterfall
monthlySold comps — $/sqft
last 12 mo · ≤1 miLoading sold comps…