3419 8th St SW · Lehigh Acres, FL
Flood risk 4/10 · Minor
- FEMA flood zone
- X (unshaded)
- Chance of flooding over 30 yrs
- 0.2%
- Est. flood insurance / yr
- $507 – $1,088
Fire risk 1/10 · Minimal
- Est. fire insurance / yr
- $947 – $1,759
Heat risk 9/10 · Severe
- Hot days now (above 107°F)
- 7 days/yr
- Hot days in 30 yrs
- 27 days/yr
Wind risk 10/10 · Severe
- Chance of severe wind over 30 yrs
- 99.0%
Air-quality risk 2/10 · Minimal
- Unhealthy air days now
- 1 days/yr
- Unhealthy air days in 30 yrs
- 1 days/yr
Risk factors via First Street. Map © Google.
Why this score? — see what drove the D- grade
The composite is a weighted blend of 9 inputs, each scored 0–100. Each bar is that input's sub-score; the figure is the points it added to the 100-point composite (weight × sub-score).
- Appreciation +10.0/10.0
- ARV discount +7.5/15.0
- Cash flow +6.0/30.0
- Schools +4.1/10.0
- Livability +3.0/5.0
- Condition / age +2.5/5.0
- Rent growth +2.1/5.0
- 1% rule +1.3/10.0
- DSCR +0.3/10.0
$344,900
🖨 Deal sheet 📄 Offer letter ✓ Due diligence
Listing remarks MLS
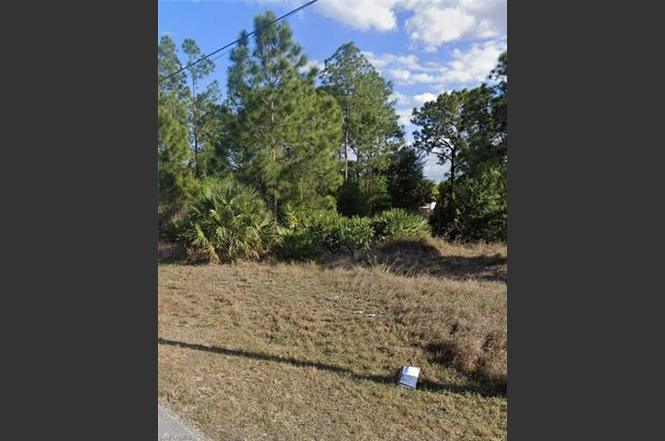
Here is your chance for a rare opportunity! Beautiful side by side lots in the popular SW section of Lehigh Acres. These lots are aggressively priced at $29,950 each and will move quickly! Location is unbeatable and very close to Gunnery/ Sunshine/ Lee Blvd and Hwy 82 for easy access. You can enjoy many activities within a short drive such as… Shopping, JetBlue Stadium (Home of the Red Sox spring training), Hammond Stadium (Home of the Twins spring training) and Fort Myers Beach. Also for added convenience, Southwest International Airport is quick drive away! Don’t miss out, call today!
Key facts
- Spacious kitchen
- Tile flooring
- Oversized lot
Tags
Property features AI
Finance
- Other: Zoning: RS-1; Lot dimensions approximately 80 x 137 (developer brochure); Lot area approximately 0.25 acres; Property listed as new construction; Single unit, single floor
- HOA & community: Non-gated community; No HOA maintenance or amenities
Exterior
- Parking: Attached 2-car garage
- Utilities: Well water; Septic sewer
- Home design: Single family residential; 1 story / ranch; Rear exposure to the south
- Construction: Concrete block construction; Built in 2025
- Exterior features: Stucco exterior; Shingle roof; Sliding windows; Impact resistant doors and windows; Corner lot; Regular-shaped lot; Wooded area view; Irrigation with well and central system
Interior
- Kitchen: Dishwasher; Microwave; Range; Refrigerator
- Bedrooms: 4 bedrooms
- Flooring: Tile
- Bathrooms: 2 full bathrooms; Master bath with dual sinks
- Heating & cooling: Central electric heat; Central electric cooling
- Interior features: Walk-in closet; Great room floor plan; Dining area that opens to the living room; Eat-in kitchen
- Laundry & utility: Smoke detector
Neighborhood map
What this means for you Summary
Snapshot
- This is a 4-bed/2.0-bath land listed at $345k.
Deal economics
- At list price, monthly cash flow is $-661 ($-8k/yr) — negative.
- To cash-flow at today's rent, offer at most $249k (27.7% below list).
- To meet the 1% rule (rent ≥ 1% of price), the offer needs to be $218k (36.8% below list).
- Recommended offer: $218k (36.8% below list) — sets the bar for 1% rule.
Location & tenants
- Location reads 59/100 on livability (#826 in FL) — a working-class tenant base; expect higher turnover. Strengths: cost of living A+, housing A+; Watch: crime C-, employment D+, schools D-.
- Lee (suburban): math 47% / reading 50% proficiency, ranked #42 of 73 in FL (top 58%) — families likely to look elsewhere, expect single-tenant / working-renter base with shorter leases.
- Market conditions: Rents soft (-1.5%/yr); 786 active listings in the ZIP; 40 comparable units currently listed for rent nearby; rentals at typical pace (median 21d on market — plan ~3-4 weeks tenant-placement turnaround); 15,411 units permitted in Lee County in 2024 (4,686 in 5+ unit buildings).
- This rent runs 36% of the median local income ($73k/yr) — at the standard rent-burdened threshold; future hikes will face affordability resistance.
Forward outlook
- In year one you build about $37k of equity ($2k loan paydown + $34k appreciation (10.0% local appreciation)).
- Lee County population projected at +44% by 2050 — long-run rental-demand tailwind backs the buy-and-hold thesis.
- By year 2, paydown + projected appreciation supports a ~$59k cash-out refi (75% LTV) — recoverable capital for the next deal without selling this one.
Negotiation context
- It's been on market 219 days — a 12% lower offer ($304k) is reasonable based on typical stale-listing flexibility.
- 3 sale attempts since 2y ago; this cycle's ask is 15577% above the opening price — seller raised mid-cycle; expect resistance to lowballs.
- Current owner paid $27k; list at $345k implies a 1177% gain — meaningful room to come down on a strong offer.
Risks & watch-outs
- Climate carrying-cost: severe wind risk, 99% chance of damaging wind over 30y; extreme-heat days projected 7→27/yr by 2055 (HVAC capex compounding) — expect insurance premiums to compound above CPI over the hold.
Questions for the listing agent
- What do current leases actually rent for vs. the listed asking? Can we see a recent rent roll and the last 12 months of T-12 income?
- It's been on market 219 days. Have you received any prior offers? Is the seller open to a 37% concession, seller financing, or rate buy-down credit?
- Why hasn't it sold? Are there any deal-killer items the seller is aware of (foundation, flood, title, zoning, code violations)?
- Is there a deadline driving the sale (1031 exchange, divorce, estate, relocation)? That informs how much negotiation room exists.
- Schools are D-rated, which usually means shorter tenancies and higher turnover. Who's the typical renter profile here, and what's been the actual vacancy rate?
- The area grade is low — what's the realistic commute time and amenity access for the typical tenant pool here? Any planned neighborhood developments (good or bad) we should know about?
- What's the average days-on-market for RENTAL listings here right now (not sales)? A rising rental-DOM trend means longer vacancies and softer asking-rent achievability than the comps imply.
- What's the recent tenant-quality profile in this submarket — average credit score on applications, eviction rate, late-payment / NSF rate, and stable-employment percentage? A property-management company in the area should have these aggregated.
- How much new for-sale + rental construction is in the pipeline within 1–3 miles? Heavy new supply typically softens prices + rents 12–24 months out; constrained supply supports both.
Investment metrics
- 1% rule
- 0.63% ✗
- Cap rate
- 3.99%
- Cash-on-cash
- -8.22%
- DSCR
- 0.63
- GRM
- 13.2
CMA / ARV
No comps found within radius.
Projected returns pro-forma
10.0% appreciation · 0.0% rent growth · sell at horizon
- IRR
- 17.8%
- Equity multiple
- 2.44×
- Total profit
- $139,373
- Equity at exit
- $310,713
- IRR
- 16.2%
- Equity multiple
- 5.48×
- Total profit
- $432,173
- Equity at exit
- $670,065
Cash invested: $96,572 (down + closing). Projections, not guarantees.
Landlord ↔ Tenant lean methodology
- Overall (STATE)
- 87 Strongly Landlord-Friendly
- State Florida
- 87 Strongly Landlord-Friendly · R+3
- County
- — inherits STATE
- City
- — inherits STATE
ZIP-level market 33976
- Home prices YoY
- 6.8%
- Rents YoY
- -1.5%
- Active inventory
- 786
- Price-to-rent
- 13.2×
Monthly cashflow live
- Estimated rent
- $2,180 high interval (Pro) →
- Mortgage (P&I)
- −$1,809
- Tax est. 1.5%
- −$431 /mo · $5,174/yr
- Insurance
- −$144
- HOA
- −$0
- Vacancy / Maint / Mgmt
- −$458
- Net cashflow
- $-661
Break-even live
UW: 25.0% down · 7.5% · 30yr · 1.5% tax · 5.0% vac · 8.0% maint · 8.0% mgmt
Financing live
Cash to close
- Down payment
- $86,225
- Closing costs
- $10,347
- Reserves months
- —
- Total cash needed
- —
Loan-product check · same deal, 3 products live
Conventional
25% down · 7.5% · 30yr
- Down + closing
- —
- Monthly P&I
- —
- Monthly cashflow
- —
- DSCR
- —
- Eligible?
- —
Personal DTI + credit; lowest rate.
DSCR
20% down · 8.5% · 30yr
- Down + closing
- —
- Monthly P&I
- —
- Monthly cashflow
- —
- DSCR
- —
- Eligible?
- —
No personal income docs; deal must DSCR.
Hard money
10% down · 12.0% · 12mo
- Down + closing
- —
- Monthly P&I
- —
- Monthly cashflow
- —
- DSCR
- —
- Eligible?
- —
Short-term bridge; refi at stabilization.
Rent comps 40 comps
| Address | Beds | Baths | Sqft | Rent | $/sqft | DOM | Units | Dist |
|---|---|---|---|---|---|---|---|---|
| 3303 8th St SW Lehigh Acres, FL | 3.0 | 2.0 | 1400 | $2,250 | $1.61 | 3d | 1 | 0.07mi |
| 3417 7th St SW Lehigh Acres, FL | 4.0 | 2.0 | 1833 | $1,850 | $1.01 | 10d | 1 | 0.08mi |
| 3408 10th St SW Lehigh Acres, FL | 4.0 | 2.0 | 1385 | $1,850 | $1.34 | 21d | 1 | 0.12mi |
| 3615 6th St SW Lehigh Acres, FL | 3.0 | 2.0 | 1378 | $1,825 | $1.32 | 23d | 1 | 0.25mi |
| 3315 7th St SW Lehigh Acres, FL | 3.0 | 2.0 | 1212 | $1,950 | $1.61 | 23d | 1 | 0.25mi |
| 3402 13th St SW Lehigh Acres, FL | 3.0 | 2.0 | 1117 | $1,940 | $1.74 | 3d | 1 | 0.31mi |
| 3508 3rd St SW Lehigh Acres, FL | 3.0 | 2.0 | 1147 | $1,699 | $1.48 | 2d | 1 | 0.32mi |
| 3705 9th St SW Lehigh Acres, FL | 3.0 | 2.0 | 1272 | $1,695 | $1.33 | 14d | 1 | 0.36mi |
| 3704 6th St SW Lehigh Acres, FL | 3.0 | 2.0 | 1100 | $1,575 | $1.43 | 19d | 1 | 0.38mi |
| 3309 2nd St SW Lehigh Acres, FL | 3.0 | 2.0 | 984 | $1,495 | $1.52 | 23d | 1 | 0.45mi |
| 3702 14th St SW Lehigh Acres, FL | 4.0 | 2.0 | 1472 | $1,995 | $1.36 | 23d | 1 | 0.49mi |
| 1511 Terry Ave S Lehigh Acres, FL | 3.0 | 2.0 | 1579 | $1,996 | $1.26 | 23d | 1 | 0.54mi |
| 57 Xelda Ave S Lehigh Acres, FL | 3.0 | 3.0 | 1057 | $2,200 | $2.08 | 23d | 1 | 0.60mi |
| 3103 11th St SW Lehigh Acres, FL | 3.0 | 2.0 | 1212 | $1,800 | $1.49 | 23d | 1 | 0.67mi |
| 3818 7th St SW Lehigh Acres, FL | 3.0 | 2.0 | 1422 | $1,695 | $1.19 | 23d | 1 | 0.68mi |
| 3820 7th St SW Lehigh Acres, FL | 4.0 | 2.0 | 1841 | $2,500 | $1.36 | 11d | 1 | 0.69mi |
| 3405 4th St W Lehigh Acres, FL | 3.0 | 2.0 | 1184 | $1,715 | $1.45 | 13d | 1 | 0.70mi |
| 1507 Paula Ave S Lehigh Acres, FL | 3.0 | 2.0 | 1547 | $2,000 | $1.29 | 19d | 1 | 0.72mi |
| 3714 17th St SW Lehigh Acres, FL | 4.0 | 2.0 | 1833 | $1,890 | $1.03 | 23d | 1 | 0.74mi |
| 3600 19th St SW Lehigh Acres, FL | 3.0 | 2.0 | 1114 | $1,746 | $1.57 | 3d | 1 | 0.75mi |
| 4005 12th St SW Lehigh Acres, FL | 3.0 | 2.0 | 1122 | $1,610 | $1.43 | 19d | 1 | 0.86mi |
| 2916 7th St SW Lehigh Acres, FL | 3.0 | 2.0 | 1357 | $1,900 | $1.40 | 23d | 1 | 0.94mi |
| 3202 21st St SW Lehigh Acres, FL | 3.0 | 2.0 | 1100 | $1,920 | $1.75 | 2d | 1 | 0.99mi |
| 3919 3rd St W Lehigh Acres, FL | 4.0 | 2.0 | 1728 | $2,131 | $1.23 | 3d | 1 | 0.99mi |
| 3209 21st St SW Lehigh Acres, FL | 3.0 | 2.0 | 1418 | $1,699 | $1.20 | 2d | 1 | 0.99mi |
| 4003 3rd St W Lehigh Acres, FL | 3.0 | 2.0 | 1311 | $1,985 | $1.51 | 23d | 1 | 1.02mi |
| 2906 14th St SW Lehigh Acres, FL | 3.0 | 2.0 | 1563 | $2,450 | $1.57 | 23d | 1 | 1.04mi |
| 2909 15th St SW Lehigh Acres, FL | 3.0 | 2.0 | 1291 | $1,800 | $1.39 | 21d | 1 | 1.06mi |
| 3506 9th St W Lehigh Acres, FL | 4.0 | 2.0 | 1820 | $2,800 | $1.54 | 23d | 1 | 1.07mi |
| 3201 23rd St SW Lehigh Acres, FL | 3.0 | 2.0 | 1324 | $1,845 | $1.39 | 21d | 1 | 1.10mi |
| 3203 24th St SW Lehigh Acres, FL | 3.0 | 2.0 | 1498 | $2,300 | $1.54 | 21d | 1 | 1.15mi |
| 3700 9th St W Lehigh Acres, FL | 3.0 | 2.0 | 1600 | $1,875 | $1.17 | 2d | 1 | 1.15mi |
| 2812 4th St SW Lehigh Acres, FL | 3.0 | 2.0 | 1751 | $1,856 | $1.06 | 23d | 1 | 1.16mi |
| 3310 9th St W Lehigh Acres, FL | 3.0 | 2.0 | 1488 | $2,300 | $1.55 | 15d | 1 | 1.16mi |
| 911 Sally Ave N Lehigh Acres, FL | 3.0 | 2.0 | 1144 | $1,521 | $1.33 | 3d | 1 | 1.16mi |
| 3906 6th St W Lehigh Acres, FL | 3.0 | 2.0 | 1457 | $2,000 | $1.37 | 23d | 1 | 1.18mi |
| 3109 8th St SW Lehigh Acres, FL | 3.0 | 2.0 | 1324 | $1,845 | $1.39 | 21d | 1 | 1.18mi |
| 3309 10th St W Lehigh Acres, FL | 4.0 | 2.0 | 1575 | $2,199 | $1.40 | 11d | 1 | 1.19mi |
| 2504 Vera Ave S Lehigh Acres, FL | 3.0 | 3.0 | 1643 | $2,400 | $1.46 | 23d | 1 | 1.20mi |
| 3208 9th St W Lehigh Acres, FL | 3.0 | 2.0 | 1423 | $1,916 | $1.35 | 3d | 1 | 1.21mi |
Listing history 10 events
-
2026-06-02days on market $344,900 Active 219 DOM
-
2026-06-01days on market $344,900 Active 218 DOM
-
2026-06-01days on market $344,900 Active 217 DOM
-
2026-05-10historical $2,200
-
2026-05-07$2,200
-
2025-10-26$344,900 Active
-
2024-07-01soldstatus $27,000 Sold 606-char remark
Show marketing remark (606 chars)
Here is your chance for a rare opportunity! Beautiful side by side lots in the popular SW section of Lehigh Acres. These lots are aggressively priced at $29,950 each and will move quickly! Location is unbeatable and very close to Gunnery/ Sunshine/ Lee Blvd and Hwy 82 for easy access. You can enjoy many activities within a short drive such as… Shopping, JetBlue Stadium (Home of the Red Sox spring training), Hammond Stadium (Home of the Twins spring training) and Fort Myers Beach. Also for added convenience, Southwest International Airport is quick drive away! Don’t miss out, call today!
-
2024-06-27status Pending 606-char remark
Show marketing remark (606 chars)
Here is your chance for a rare opportunity! Beautiful side by side lots in the popular SW section of Lehigh Acres. These lots are aggressively priced at $29,950 each and will move quickly! Location is unbeatable and very close to Gunnery/ Sunshine/ Lee Blvd and Hwy 82 for easy access. You can enjoy many activities within a short drive such as… Shopping, JetBlue Stadium (Home of the Red Sox spring training), Hammond Stadium (Home of the Twins spring training) and Fort Myers Beach. Also for added convenience, Southwest International Airport is quick drive away! Don’t miss out, call today!
-
2024-06-19price $29,450 606-char remark
Show marketing remark (606 chars)
Here is your chance for a rare opportunity! Beautiful side by side lots in the popular SW section of Lehigh Acres. These lots are aggressively priced at $29,950 each and will move quickly! Location is unbeatable and very close to Gunnery/ Sunshine/ Lee Blvd and Hwy 82 for easy access. You can enjoy many activities within a short drive such as… Shopping, JetBlue Stadium (Home of the Red Sox spring training), Hammond Stadium (Home of the Twins spring training) and Fort Myers Beach. Also for added convenience, Southwest International Airport is quick drive away! Don’t miss out, call today!
-
2024-06-11$29,950 Active 606-char remark
Show marketing remark (606 chars)
Here is your chance for a rare opportunity! Beautiful side by side lots in the popular SW section of Lehigh Acres. These lots are aggressively priced at $29,950 each and will move quickly! Location is unbeatable and very close to Gunnery/ Sunshine/ Lee Blvd and Hwy 82 for easy access. You can enjoy many activities within a short drive such as… Shopping, JetBlue Stadium (Home of the Red Sox spring training), Hammond Stadium (Home of the Twins spring training) and Fort Myers Beach. Also for added convenience, Southwest International Airport is quick drive away! Don’t miss out, call today!
ⓘ Source: listings_history table (triggers on properties + properties_extension) + one-shot
backfill from property_details.listing_events for pre-trigger history.
Climate risk First Street
- Flood 4/10 Moderate FEMA zone X (unshaded) · 20% chance over 30 yrs
- Wildfire 1/10 Low
- Heat 9/10 Extreme 7 d/yr ≥107°F today · 27 d/yr by 30 yrs out
- Wind 10/10 Extreme 99% chance of damaging wind over 30 yrs
- Air quality 2/10 Low 1 unhealthy d/yr today · 1 by 30 yrs out
Nearby sold comps map
Loading sold comps map…
Walkable amenities ~0.75 mi
Loading nearby amenities…
Taxation est. · year 1
- Rental income
- $26,162
- − Mortgage interest
- −$19,320
- − Property taxes
- −$5,174
- − Insurance
- −$1,724
- − Repairs & maintenance
- −$2,093
- − Management
- −$2,093
- − Depreciation
- −$10,033
- Taxable loss
- −$14,275
- Est. tax savings @ 24.0%
- +$3,426
- After-tax cash flow
- $-4,508/yr
For passive investors: Depreciation is non-cash, so a rental often shows a tax loss while cash-flowing — sheltering income. Rental losses are passive: they offset passive income freely, and up to $25,000/yr can offset ordinary (W-2) income if you actively participate and your MAGI is under $100k (phasing out to $0 by $150k); unused losses carry forward. On sale, claimed depreciation is recaptured at up to 25%, and gains may owe capital-gains tax (a 1031 exchange can defer both). Figures are a year-1 estimate at your 24.0% rate — not tax advice; consult a CPA.
Schools (NCES district)
- District
- Lee
- NCES district ID
- 1201080
- Math proficiency
- 47% ▼ -11.00%
- Reading proficiency
- 50% ▼ -4.00%
- Median HH income
- $49,518
- Composite
- 41.49/100
- National rank
- #3458
- State rank
- #42 of 73 in FL
Livability — Lehigh Acres
- Score
- 59/100
- State rank
- #826
- US rank
- #20055
Category grades
Schools grade is shown separately in the Schools card above.
Census & demographics
- Census place
- Lehigh Acres, FL
- County
- Lee County · 788,662 people
- City population
- 130,638
- Metro
- Cape Coral-Fort Myers, FL
- Population (ZIP)
- 20,277
- Household income
- $72,679
- Rent vs Own
- Severe rent burden
- 574.0
Population outlook (Lee County) Hauer SSP2
- Today (2025)
- 871,946 people
- By 2030
- 955,468 · +9.6%
- By 2040
- 1,113,587 · +27.7%
- By 2050
- 1,256,891 · +44.1%
- By 2075
- 1,560,270 · +78.9%
- By 2100
- 1,726,848 · +98.0%
Race, ethnicity, and origin ACS 2023
- Neighborhood character
- Diverse neighborhood (Simpson 0.65)
- Race & ethnicity
- Hispanic / Latino 50% Two or more races 30% White 24% Black 20% Asian 3%
- Hispanic origin (detail)
- Mexican 8% Puerto Rican 8% Cuban 18% Dominican 4%
- Common ancestry
- Hispanic 8% Slovak 1% Lithuanian 1%
- Foreign-born
- 35% · Canada, Jamaica, Vietnam
- Languages at home
- 46% English-only · Spanish 43% French/Haitian/Cajun 8% Vietnamese 1%
Political lean MEDSL · Lee
- 2024 margin
- Strong R (+28.4) · D 35.5% · R 63.9%
- 2008→2024 swing
- -18.0pp toward R · 2008: -10.4pp · 2024: -28.4pp
- All cycles
- 2024: R+28.4 2020: R+19.2 2016: R+20.4 2012: R+16.6 2008: R+10.4
Not yet ingested
- Civics
- —
Market trends
- HPI YoY
- ▲ 21.77%
- Current HPI
- 340.4255
- Rent YoY
- ▼ -1.54%
- Metro
- Cape Coral-Fort Myers, FL
- State GDP YoY
- ▲ 3.28%
- F500 in state
- 36
Industry mix (Fortune 500 HQ in FL)
| Industry | F500 HQs | Revenue |
|---|---|---|
| Industrial Technology | 2 | $29B |
|
||
| Insurance | 2 | $17B |
|
||
| Retail | 1 | $60B |
|
||
| Technology Distribution | 1 | $58B |
|
||
| Homebuilding | 1 | $35B |
|
||
| Technology Manufacturing | 1 | $35B |
|
||
Price history
-92.7% since first listed7 events — show timeline
- 2026-05-10 Rental Removed $2,200 NAPLESMLS
- 2026-05-07 Listed for Rent $2,200 NAPLESMLS
- 2025-10-26 Listed $344,900 NAPLESMLS
- 2024-07-01 Sold (MLS) $27,000 NAPLESMLS
- 2024-06-27 Pending — NAPLESMLS
- 2024-06-19 Price Changed $29,450 NAPLESMLS
- 2024-06-11 Listed $29,950 NAPLESMLS
Property tax history
+19.7%/yrLatest (2025): $520 · +14.9% YoY. Source: county tax records.
Cash-flow waterfall
monthlySold comps — $/sqft
last 12 mo · ≤1 miLoading sold comps…