104 Life Blvd · Ormond Beach, FL
Flood risk No data
- FEMA flood zone
- —
- Chance of flooding over 30 yrs
- —
- Est. flood insurance / yr
- —
Fire risk No data
- Est. fire insurance / yr
- —
Heat risk No data
- Hot days now (above threshold)
- —
- Hot days in 30 yrs
- —
Wind risk No data
- Chance of severe wind over 30 yrs
- —
Air-quality risk No data
- Unhealthy air days now
- —
- Unhealthy air days in 30 yrs
- —
Risk factors via First Street. Map © Google.
Why this score? — see what drove the B- grade
The composite is a weighted blend of 9 inputs, each scored 0–100. Each bar is that input's sub-score; the figure is the points it added to the 100-point composite (weight × sub-score).
- Cash flow +25.8/30.0
- 1% rule +10.0/10.0
- DSCR +8.6/10.0
- ARV discount +7.5/15.0
- Condition / age +4.8/5.0
- Livability +4.2/5.0
- Schools +3.9/10.0
- Rent growth +2.9/5.0
- Appreciation +0.0/10.0
$98,500
🖨 Deal sheet 📄 Offer letter ✓ Due diligence
Listing remarks MLS
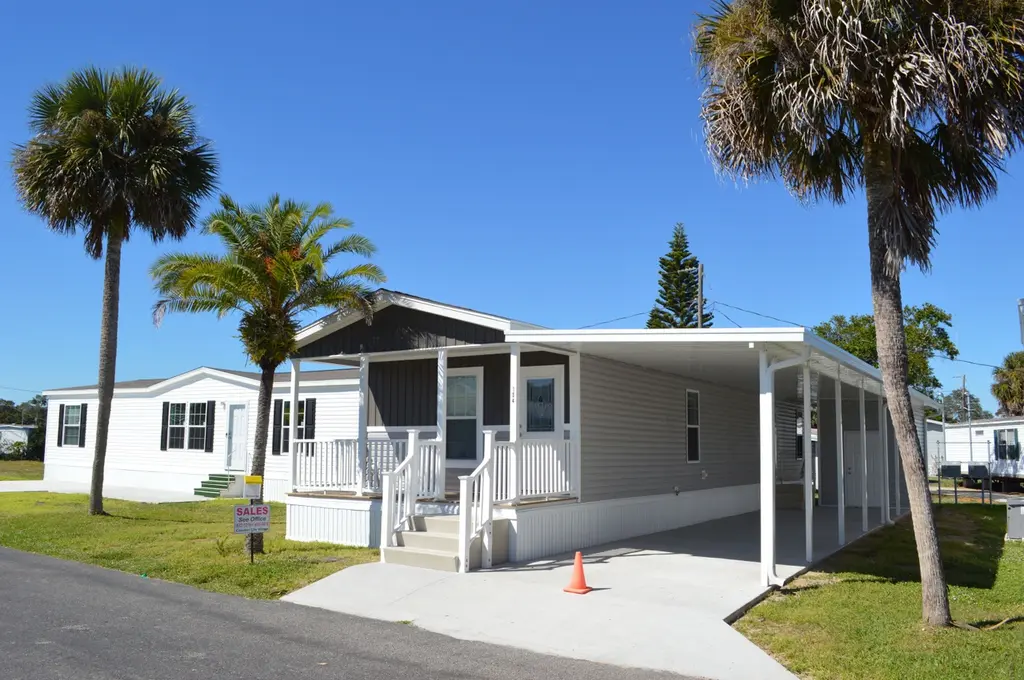
This 3 bed 2 bath home with a front porch, 2-tone siding, and oversized screen room and carport has blow-you-away curb appeal. The interior of this home is highly-optioned with fully taped and textured walls, painted accent walls in the living areas and bedrooms, pendant lights above the kitchen island, stainless steel appliances with built in microwave, and so much more!
Key facts
- 2-tone siding
- Painted accent walls
- Front porch
Tags
Neighborhood map
What this means for you Summary
Snapshot
- This is a 3-bed/2.0-bath single-family listed at $98k. Condition is rated excellent.
Deal economics
- At list price, monthly cash flow is $238 ($3k/yr) — positive.
- The deal already cash-flows at list — no discount required.
- Meets the 1% rule at list price ($2k rent vs $98k).
- Recommended offer: $87k (12.0% below list) — sets the bar for market timing.
- Cap rate 9.2% vs local median 3.9% in Ormond Beach — top-decile yield for the area; either an underpriced asset or a hidden risk that comps aren't pricing in. Stress-test before assuming the spread holds.
Location & tenants
- Location reads 83/100 on livability (#55 in FL, #965 nationally) — a professional / high-income tenant draw. Strengths: amenities A+, housing A+, health & safety A+; Watch: commute F.
- Volusia (suburban): math 44% / reading 49% proficiency, ranked #47 of 73 in FL (top 64%) — families likely to look elsewhere, expect single-tenant / working-renter base with shorter leases.
- Market conditions: Rents rising (+1.6%/yr); 985 active listings in the ZIP; 4 comparable units currently listed for rent nearby; rentals at typical pace (median 23d on market — plan ~3-4 weeks tenant-placement turnaround); 3,402 units permitted in Volusia County in 2024 (681 in 5+ unit buildings).
- This rent runs 32% of the median local income ($71k/yr) — at the standard rent-burdened threshold; future hikes will face affordability resistance.
Forward outlook
- Local home prices are declining (-3.0%/yr); year-one equity from $681 of loan paydown is wiped out by about $3k of value loss. Plan a longer hold.
- Volusia County population projected at +19% by 2050 — long-run rental-demand tailwind backs the buy-and-hold thesis.
Negotiation context
- It's been on market 285 days — a 12% lower offer ($87k) is reasonable based on typical stale-listing flexibility.
Risks & watch-outs
- Watch-outs: HOA is 30% of rent.
Questions for the listing agent
- It's been on market 285 days. Have you received any prior offers? Is the seller open to a 12% concession, seller financing, or rate buy-down credit?
- What does the HOA fee cover, when was the last increase, and are there any pending special assessments or reserve-fund shortfalls?
- Why hasn't it sold? Are there any deal-killer items the seller is aware of (foundation, flood, title, zoning, code violations)?
- Is there a deadline driving the sale (1031 exchange, divorce, estate, relocation)? That informs how much negotiation room exists.
- Schools are B-rated — typically a magnet for longer-tenancy family renters. What's the average tenant stay here, and is there a school-zone premium baked into asking?
- What's the average days-on-market for RENTAL listings here right now (not sales)? A rising rental-DOM trend means longer vacancies and softer asking-rent achievability than the comps imply.
- What's the recent tenant-quality profile in this submarket — average credit score on applications, eviction rate, late-payment / NSF rate, and stable-employment percentage? A property-management company in the area should have these aggregated.
- How much new for-sale + rental construction is in the pipeline within 1–3 miles? Heavy new supply typically softens prices + rents 12–24 months out; constrained supply supports both.
Investment metrics
- 1% rule
- 1.90% ✓
- Cap rate
- 9.19%
- Cash-on-cash
- 10.34%
- DSCR
- 1.46
- GRM
- 4.4
CMA / ARV
No comps found within radius.
Projected returns pro-forma
-3.0% appreciation · 1.64% rent growth · sell at horizon
- IRR
- -2.9%
- Equity multiple
- 0.89×
- Total profit
- $-2,975
- Equity at exit
- $14,687
- IRR
- 4.5%
- Equity multiple
- 1.30×
- Total profit
- $8,329
- Equity at exit
- $8,516
Cash invested: $27,580 (down + closing). Projections, not guarantees.
Landlord ↔ Tenant lean methodology
- Overall (STATE)
- 87 Strongly Landlord-Friendly
- State Florida
- 87 Strongly Landlord-Friendly · R+3
- County
- — inherits STATE
- City
- — inherits STATE
ZIP-level market 32174
- Rents YoY
- 1.6%
- Active inventory
- 985
- Price-to-rent
- 4.4×
Monthly cashflow live
- Estimated rent
- $1,871 medium interval (Pro) →
- Mortgage (P&I)
- −$517
- Tax est. 1.5%
- −$123 /mo · $1,478/yr
- Insurance
- −$41
- HOA
- −$560
- Vacancy / Maint / Mgmt
- −$393
- Net cashflow
- $238
Break-even live
UW: 25.0% down · 7.5% · 30yr · 1.5% tax · 5.0% vac · 8.0% maint · 8.0% mgmt
Financing live
Cash to close
- Down payment
- $24,625
- Closing costs
- $2,955
- Reserves months
- —
- Total cash needed
- —
Loan-product check · same deal, 3 products live
Conventional
25% down · 7.5% · 30yr
- Down + closing
- —
- Monthly P&I
- —
- Monthly cashflow
- —
- DSCR
- —
- Eligible?
- —
Personal DTI + credit; lowest rate.
DSCR
20% down · 8.5% · 30yr
- Down + closing
- —
- Monthly P&I
- —
- Monthly cashflow
- —
- DSCR
- —
- Eligible?
- —
No personal income docs; deal must DSCR.
Hard money
10% down · 12.0% · 12mo
- Down + closing
- —
- Monthly P&I
- —
- Monthly cashflow
- —
- DSCR
- —
- Eligible?
- —
Short-term bridge; refi at stabilization.
Rent comps 4 comps
| Address | Beds | Baths | Sqft | Rent | $/sqft | DOM | Units | Dist |
|---|---|---|---|---|---|---|---|---|
| 1088 W Granada Blvd Ormond Beach, FL | 1.0–2.0 | 1.0–2.0 | 950 | $1,570 | $1.65 | 11d | 8 | 0.90mi |
| 410 Sauls St Ormond Beach, FL | 3.0 | 1.0 | 990 | $1,500 | $1.52 | 23d | 1 | 1.17mi |
| 500 Shadow Lakes Blvd Ormond Beach, FL | 1.0–2.0 | 1.0–2.0 | 856 | $1,645 | $1.92 | 11d | 15 | 1.19mi |
| 1707 Evergreen St Ormond Beach, FL | 2.0 | 1.0 | 868 | $1,750 | $2.02 | 23d | 1 | 1.32mi |
HOA detail
- Monthly dues
- $560 · $6,720/yr
Listing history 11 events
-
2026-06-10days on market $98,500 Active 285 DOM
-
2026-06-09days on market $98,500 Active 284 DOM
-
2026-06-08days on market $98,500 Active 283 DOM
-
2026-06-07days on market $98,500 Active 282 DOM
-
2026-06-05days on market $98,500 Active 279 DOM
-
2026-06-03days on market $98,500 Active 278 DOM
-
2026-06-03days on market $98,500 Active 277 DOM
-
2026-06-01days on market $98,500 Active 276 DOM
-
2026-05-31days on market $98,500 Active 275 DOM
-
2026-05-31days on market $98,500 Active 274 DOM
-
2025-08-30$98,500 Active 374-char remark
Show marketing remark (374 chars)
This 3 bed 2 bath home with a front porch, 2-tone siding, and oversized screen room and carport has blow-you-away curb appeal. The interior of this home is highly-optioned with fully taped and textured walls, painted accent walls in the living areas and bedrooms, pendant lights above the kitchen island, stainless steel appliances with built in microwave, and so much more!
ⓘ Source: listings_history table (triggers on properties + properties_extension) + one-shot
backfill from property_details.listing_events for pre-trigger history.
Nearby sold comps map
Loading sold comps map…
Walkable amenities ~0.75 mi
Loading nearby amenities…
Taxation est. · year 1
- Rental income
- $22,457
- − Mortgage interest
- −$5,518
- − Property taxes
- −$1,478
- − Insurance
- −$492
- − Repairs & maintenance
- −$1,797
- − Management
- −$1,797
- − HOA
- −$6,720
- − Depreciation
- −$2,865
- Taxable income
- $1,791
- Est. tax owed @ 24.0%
- −$430
- After-tax cash flow
- $2,423/yr
For passive investors: Depreciation is non-cash, so a rental often shows a tax loss while cash-flowing — sheltering income. Rental losses are passive: they offset passive income freely, and up to $25,000/yr can offset ordinary (W-2) income if you actively participate and your MAGI is under $100k (phasing out to $0 by $150k); unused losses carry forward. On sale, claimed depreciation is recaptured at up to 25%, and gains may owe capital-gains tax (a 1031 exchange can defer both). Figures are a year-1 estimate at your 24.0% rate — not tax advice; consult a CPA.
Condition & rehab AI · 13 photos
This move-in-ready home features a modern kitchen, well-maintained bathrooms, and a good exterior with palm trees and landscaping. Fresh paint and landscaping improvements can further enhance its value.
Value-add opportunities
- Resale Painting the exterior siding — Fresh paint can enhance curb appeal and property value.
- Both Landscaping improvements — Enhanced landscaping can improve curb appeal and attract more tenants.
Renovation cost estimate screening
Value-add ROI direction
- Resale Painting the exterior siding — Fresh paint can enhance curb appeal and property value. ↑
- Both Landscaping improvements — Enhanced landscaping can improve curb appeal and attract more tenants. ↑
ⓘ Cost ranges are severity-bucket heuristics (US national rule-of-thumb). Get contractor quotes + a written scope before underwriting a rehab budget.
Schools (NCES district)
- District
- Volusia
- NCES district ID
- 1201920
- Math proficiency
- 44% ▼ -9.00%
- Reading proficiency
- 49% ▼ -3.00%
- Median HH income
- $42,946
- Composite
- 39.2/100
- National rank
- #4019
- State rank
- #47 of 73 in FL
Livability — Ormond Beach
- Score
- 83/100
- State rank
- #55
- US rank
- #965
Category grades
Schools grade is shown separately in the Schools card above.
Census & demographics
- Census place
- Ormond Beach, FL
- County
- Volusia County · 556,871 people
- City population
- 69,624
- Metro
- Deltona-Daytona Beach-Ormond Beach, FL
- Population (ZIP)
- 54,783
- Household income
- $71,011
- Rent vs Own
- Severe rent burden
- 1158.0
Population outlook (Volusia County) Hauer SSP2
- Today (2025)
- 572,749 people
- By 2030
- 598,695 · +4.5%
- By 2040
- 644,880 · +12.6%
- By 2050
- 681,451 · +19.0%
- By 2075
- 759,957 · +32.7%
- By 2100
- 778,902 · +36.0%
Race, ethnicity, and origin ACS 2023
- Neighborhood character
- Predominantly White (82%)
- Race & ethnicity
- White 82% Black 6% Hispanic / Latino 5% Two or more races 5% Asian 3%
- Hispanic origin (detail)
- Puerto Rican 2%
- Common ancestry
- Romanian 4% Lithuanian 3% Slovak 3%
- Foreign-born
- 7% · Canada, China
- Languages at home
- 91% English-only · Spanish 3% Other Indo-European 1% German/W. Germanic 1%
Political lean MEDSL · Volusia
- 2024 margin
- Strong R (+21.8) · D 38.7% · R 60.5%
- 2008→2024 swing
- -27.4pp toward R · 2008: 5.7pp · 2024: -21.8pp
- All cycles
- 2024: R+21.8 2020: R+14.1 2016: R+13.1 2012: R+1.2 2008: D+5.7
Not yet ingested
- Civics
- —
Market trends
- HPI YoY
- ▼ -327.97%
- Current HPI
- 271.92
- Rent YoY
- ▲ 1.64%
- Metro
- Deltona-Daytona Beach-Ormond Beach, FL
- State GDP YoY
- ▲ 3.28%
- F500 in state
- 36
Industry mix (Fortune 500 HQ in FL)
| Industry | F500 HQs | Revenue |
|---|---|---|
| Industrial Technology | 2 | $29B |
|
||
| Insurance | 2 | $17B |
|
||
| Retail | 1 | $60B |
|
||
| Technology Distribution | 1 | $58B |
|
||
| Homebuilding | 1 | $35B |
|
||
| Technology Manufacturing | 1 | $35B |
|
||
Price history
1 event — show timeline
- 2025-08-30 Listed $98,500 Zillow
Cash-flow waterfall
monthlySold comps — $/sqft
last 12 mo · ≤1 miLoading sold comps…