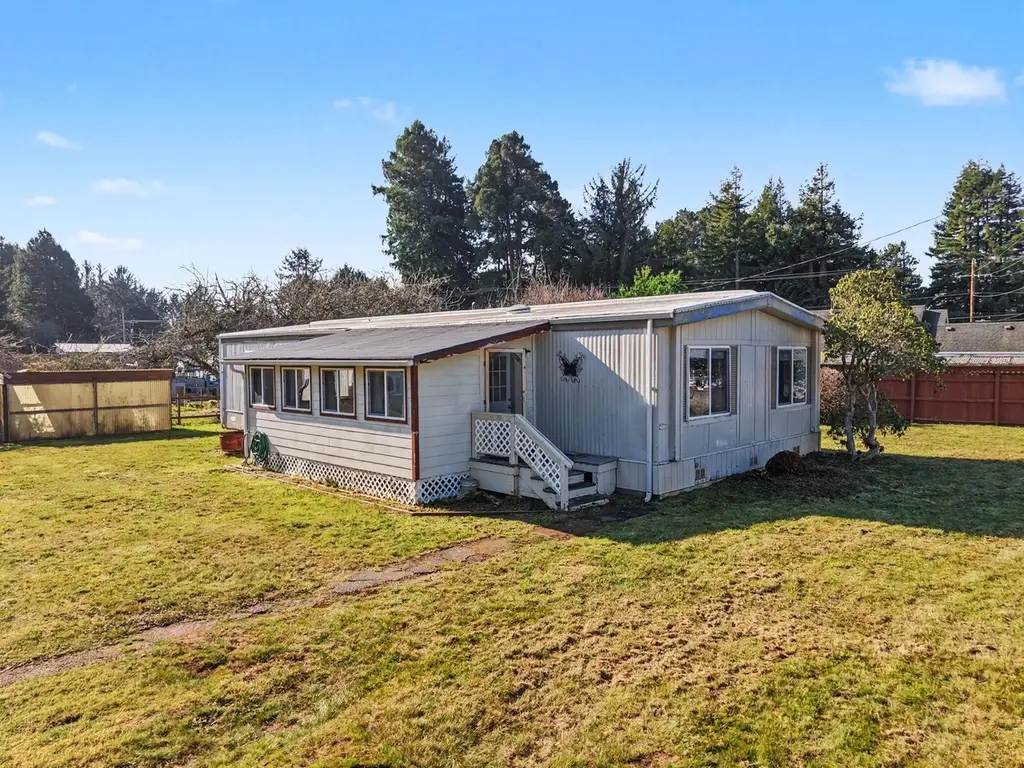
175 White Ln · Crescent City, CA
Flood risk 1/10 · Minimal
- FEMA flood zone
- X (unshaded)
- Chance of flooding over 30 yrs
- 0.0%
- Est. flood insurance / yr
- $507 – $1,088
Fire risk 4/10 · Minor
- Est. fire insurance / yr
- $659 – $1,223
Heat risk 3/10 · Minor
- Hot days now (above 74°F)
- 9 days/yr
- Hot days in 30 yrs
- 27 days/yr
Wind risk 1/10 · Minimal
- Chance of severe wind over 30 yrs
- —
Air-quality risk 6/10 · Moderate
- Unhealthy air days now
- 8 days/yr
- Unhealthy air days in 30 yrs
- 9 days/yr
Risk factors via First Street. Map © Google.
Why this score? — see what drove the C+ grade
The composite is a weighted blend of 9 inputs, each scored 0–100. Each bar is that input's sub-score; the figure is the points it added to the 100-point composite (weight × sub-score).
- Cash flow +23.2/30.0
- ARV discount +15.0/15.0
- DSCR +7.5/10.0
- 1% rule +5.0/10.0
- Livability +2.9/5.0
- Schools +2.8/10.0
- Rent growth +2.5/5.0
- Condition / age +2.5/5.0
- Appreciation +0.0/10.0
$195,000
🖨 Deal sheet 📄 Offer letter ✓ Due diligence
Listing remarks MLS
Set on the peaceful outskirts of town, this property sits on a nicely fenced 0.29-acre lot offering plenty of room to enjoy. This 3-bedroom, 2-bath home is a great value with tons of potential for its next owner to truly make it their own. Inside, you'll find a spacious living room, a kitchen with ample cabinetry, and a primary suite featuring a soaking tub and separate shower. A charming sunroom welcomes you at the front entry—ideal for morning coffee or additional living space. Outside, the property offers exceptional storage and utility with a detached garage and three county-recorded sheds. Whether you're looking for a personal residence or a solid investment opportunity, this home is worth a look.
Key facts
- Soaking tub
- Sunroom
- Separate shower
Tags
Neighborhood map
What this means for you Summary
Snapshot
- This is a 3-bed/2.0-bath manufactured listed at $195k.
Deal economics
- At list price, monthly cash flow is $353 ($4k/yr) — positive.
- The deal already cash-flows at list — no discount required.
- Meets the 1% rule at list price ($2k rent vs $195k).
- Recommended offer: $172k (12.0% below list) — sets the bar for market timing.
- Cap rate 8.5% vs local median 3.1% in Crescent City — top-decile yield for the area; either an underpriced asset or a hidden risk that comps aren't pricing in. Stress-test before assuming the spread holds.
Location & tenants
- Location reads 57/100 on livability (#730 in CA) — a working-class tenant base; expect higher turnover. Strengths: health & safety A+, housing A; Watch: cost of living D, schools D-, crime F.
- Del Norte County Unified (town): math 25% / reading 36% proficiency, ranked #1,047 of 1,400 in CA (top 75%) — families likely to look elsewhere, expect single-tenant / working-renter base with shorter leases.
- Market conditions: 226 active listings in the ZIP; 55 units permitted in Del Norte County in 2024 (22 in 5+ unit buildings).
Forward outlook
- Local home prices are declining (-3.0%/yr); year-one equity from $1k of loan paydown is wiped out by about $6k of value loss. Plan a longer hold.
- Del Norte County population projected at -14% by 2050 — secular population decline; favor cash flow + early exit over multi-decade hold.
Negotiation context
- It's been on market 212 days — a 12% lower offer ($172k) is reasonable based on typical stale-listing flexibility.
- 2 sale attempts with the ask held roughly flat each time — persistent listings suggest the price (not the market) is what's stuck; bring a comps-based counter.
- Current owner paid $65k; list at $195k implies a 200% gain — meaningful room to come down on a strong offer.
Questions for the listing agent
- It's been on market 212 days. Have you received any prior offers? Is the seller open to a 12% concession, seller financing, or rate buy-down credit?
- Built in 1978 — when were the roof, HVAC, electrical panel, plumbing, and water heater last replaced?
- Why hasn't it sold? Are there any deal-killer items the seller is aware of (foundation, flood, title, zoning, code violations)?
- Is there a deadline driving the sale (1031 exchange, divorce, estate, relocation)? That informs how much negotiation room exists.
- Schools are D-rated, which usually means shorter tenancies and higher turnover. Who's the typical renter profile here, and what's been the actual vacancy rate?
- Crime grade is F in this area — have there been break-ins, vandalism, or insurance claims at this property in the last 3 years? What carrier currently insures it and at what premium?
- What's the average days-on-market for RENTAL listings here right now (not sales)? A rising rental-DOM trend means longer vacancies and softer asking-rent achievability than the comps imply.
- What's the recent tenant-quality profile in this submarket — average credit score on applications, eviction rate, late-payment / NSF rate, and stable-employment percentage? A property-management company in the area should have these aggregated.
- How much new for-sale + rental construction is in the pipeline within 1–3 miles? Heavy new supply typically softens prices + rents 12–24 months out; constrained supply supports both.
Investment metrics
- 1% rule
- 1.00% ✓
- Cap rate
- 8.47%
- Cash-on-cash
- 7.77%
- DSCR
- 1.35
- GRM
- 8.3
CMA / ARV
- ARV (median comp)
- $266,007
- List price
- $195,000
- Delta
- -26.69%
- Verdict
- UNDERPRICED
- Comps
- 3 within 2.0 mi
Show comp detail 1 sale within ~0.75 mi
| Address | Dist | Beds/Ba | Sqft | Sold | Price | $/sf | Match |
|---|---|---|---|---|---|---|---|
| 60 Skycrest Dr | 0.09mi | 3/2.0 | 1,620 (+12%) | 19mo | $460,000 | $284 | 59 |
Match score weights: distance 35% · size 25% · config 20% · recency 20%. Top-matched comps best support the ARV.
Projected returns pro-forma
-3.0% appreciation · 3.0% rent growth · sell at horizon
- IRR
- -4.5%
- Equity multiple
- 0.83×
- Total profit
- $-9,162
- Equity at exit
- $29,075
- IRR
- 5.2%
- Equity multiple
- 1.38×
- Total profit
- $20,721
- Equity at exit
- $16,860
Cash invested: $54,600 (down + closing). Projections, not guarantees.
Landlord ↔ Tenant lean methodology
- Overall (STATE)
- 18 Strongly Tenant-Friendly
- State California
- 18 Strongly Tenant-Friendly · D+13
- County
- — inherits STATE
- City
- — inherits STATE
ZIP-level market 95531
- Active inventory
- 226
- Price-to-rent
- 8.3×
Monthly cashflow live
- Estimated rent
- $1,951 medium interval (Pro) →
- Mortgage (P&I)
- −$1,023
- Tax from tax record
- −$84 /mo · $1,005/yr
- Insurance
- −$81
- HOA
- −$0
- Vacancy / Maint / Mgmt
- −$410
- Net cashflow
- $353
Break-even live
UW: 25.0% down · 7.5% · 30yr · 1.5% tax · 5.0% vac · 8.0% maint · 8.0% mgmt
Financing live
Cash to close
- Down payment
- $48,750
- Closing costs
- $5,850
- Reserves months
- —
- Total cash needed
- —
Loan-product check · same deal, 3 products live
Conventional
25% down · 7.5% · 30yr
- Down + closing
- —
- Monthly P&I
- —
- Monthly cashflow
- —
- DSCR
- —
- Eligible?
- —
Personal DTI + credit; lowest rate.
DSCR
20% down · 8.5% · 30yr
- Down + closing
- —
- Monthly P&I
- —
- Monthly cashflow
- —
- DSCR
- —
- Eligible?
- —
No personal income docs; deal must DSCR.
Hard money
10% down · 12.0% · 12mo
- Down + closing
- —
- Monthly P&I
- —
- Monthly cashflow
- —
- DSCR
- —
- Eligible?
- —
Short-term bridge; refi at stabilization.
Listing history 20 events
-
2026-06-19days on market $195,000 Active 212 DOM
-
2026-06-18days on market $195,000 Active 211 DOM
-
2026-06-17days on market $195,000 Active 210 DOM
-
2026-06-16days on market $195,000 Active 209 DOM
-
2026-06-15days on market $195,000 Active 208 DOM
-
2026-06-14days on market $195,000 Active 206 DOM
-
2026-06-12days on market $195,000 Active 205 DOM
-
2026-06-09days on market $195,000 Active 202 DOM
-
2026-06-08days on market $195,000 Active 201 DOM
-
2026-06-07days on market $195,000 Active 200 DOM
-
2026-06-07days on market $195,000 Active 199 DOM
-
2026-06-04days on market $195,000 Active 196 DOM
-
2026-06-02days on market $195,000 Active 195 DOM
-
2026-06-01days on market $195,000 Active 194 DOM
-
2026-05-31days on market $195,000 Active 193 DOM
-
2026-05-31days on market $195,000 Active 192 DOM
-
2026-05-20status Active 717-char remark
Show marketing remark (717 chars)
Set on the peaceful outskirts of town, this property sits on a nicely fenced 0.29-acre lot offering plenty of room to enjoy. This 3-bedroom, 2-bath home is a great value with tons of potential for its next owner to truly make it their own. Inside, you'll find a spacious living room, a kitchen with ample cabinetry, and a primary suite featuring a soaking tub and separate shower. A charming sunroom welcomes you at the front entry—ideal for morning coffee or additional living space. Outside, the property offers exceptional storage and utility with a detached garage and three county-recorded sheds. Whether you're looking for a personal residence or a solid investment opportunity, this home is worth a look.
-
2025-11-18$195,000 Active 717-char remark
Show marketing remark (717 chars)
Set on the peaceful outskirts of town, this property sits on a nicely fenced 0.29-acre lot offering plenty of room to enjoy. This 3-bedroom, 2-bath home is a great value with tons of potential for its next owner to truly make it their own. Inside, you'll find a spacious living room, a kitchen with ample cabinetry, and a primary suite featuring a soaking tub and separate shower. A charming sunroom welcomes you at the front entry—ideal for morning coffee or additional living space. Outside, the property offers exceptional storage and utility with a detached garage and three county-recorded sheds. Whether you're looking for a personal residence or a solid investment opportunity, this home is worth a look.
-
2004-03-02soldstatus $65,000
-
1998-04-01soldstatus $69,000
ⓘ Source: listings_history table (triggers on properties + properties_extension) + one-shot
backfill from property_details.listing_events for pre-trigger history.
Tax reassessment forecast CA · Resets to sale price
- Current annual tax
- $1,005 · $84/mo
- Projected year-2 tax
- $1,482 · $124/mo
- Expected delta
- +$477/yr (+$40/mo · 47.5%)
ⓘ Screening estimate from a state-policy table — verify with the county assessor before closing.
Climate risk First Street
- Flood 1/10 Low FEMA zone X (unshaded) · 0% chance over 30 yrs
- Wildfire 4/10 Moderate
- Heat 3/10 Moderate 9 d/yr ≥74°F today · 27 d/yr by 30 yrs out
- Wind 1/10 Low
- Air quality 6/10 Major 8 unhealthy d/yr today · 9 by 30 yrs out
Nearby sold comps map
Loading sold comps map…
Walkable amenities ~0.75 mi
Loading nearby amenities…
Taxation est. · year 1
- Rental income
- $23,407
- − Mortgage interest
- −$10,923
- − Property taxes
- −$1,005
- − Insurance
- −$975
- − Repairs & maintenance
- −$1,873
- − Management
- −$1,873
- − Depreciation
- −$5,673
- Taxable income
- $1,086
- Est. tax owed @ 24.0%
- −$261
- After-tax cash flow
- $3,980/yr
For passive investors: Depreciation is non-cash, so a rental often shows a tax loss while cash-flowing — sheltering income. Rental losses are passive: they offset passive income freely, and up to $25,000/yr can offset ordinary (W-2) income if you actively participate and your MAGI is under $100k (phasing out to $0 by $150k); unused losses carry forward. On sale, claimed depreciation is recaptured at up to 25%, and gains may owe capital-gains tax (a 1031 exchange can defer both). Figures are a year-1 estimate at your 24.0% rate — not tax advice; consult a CPA.
Schools (NCES district)
- District
- Del Norte County Unified
- NCES district ID
- 0610770
- Math proficiency
- 25% ▲ 1.00%
- Reading proficiency
- 36% ▲ 1.00%
- Median HH income
- $39,747
- Composite
- 28.43/100
- National rank
- #12110
- State rank
- #1047 of 1400 in CA
Livability — Crescent City
- Score
- 57/100
- State rank
- #730
- US rank
- #21544
Category grades
Schools grade is shown separately in the Schools card above.
Census & demographics
- Population (ZIP)
- 22,491
Population outlook (Del Norte County) Hauer SSP2
- Today (2025)
- 25,011 people
- By 2030
- 24,204 · -3.2%
- By 2040
- 22,826 · -8.7%
- By 2050
- 21,495 · -14.1%
- By 2075
- 18,487 · -26.1%
- By 2100
- 16,113 · -35.6%
Race, ethnicity, and origin ACS 2023
- Neighborhood character
- Diverse neighborhood (Simpson 0.58)
- Race & ethnicity
- White 61% Hispanic / Latino 20% Two or more races 12% Native American 5% Asian 4% Black 3%
- Hispanic origin (detail)
- Mexican 15%
- Common ancestry
- Slovak 4% Russian 2% Lithuanian 2%
- Foreign-born
- 8% · Canada, Vietnam, South Korea
- Languages at home
- 88% English-only · Spanish 8% Other Asian/Pacific 2% Vietnamese 1%
Political lean MEDSL · Del Norte
- 2024 margin
- R (+16.4) · D 40.4% · R 56.8% · Other 2.8%
- 2008→2024 swing
- -9.7pp toward R · 2008: -6.8pp · 2024: -16.4pp
- All cycles
- 2024: R+16.4 2020: R+15.6 2016: R+17.6 2012: R+10.8 2008: R+6.8
Not yet ingested
- Civics
- —
Market trends
- HPI YoY
- ▼ -300.53%
- Current HPI
- 148.4819
- Rent YoY
- —
- Metro
- —
- State GDP YoY
- ▲ 3.21%
- F500 in state
- 116
Industry mix (Fortune 500 HQ in CA)
| Industry | F500 HQs | Revenue |
|---|---|---|
| Technology | 27 | $1,492B |
|
||
| Financial Services | 3 | $174B |
|
||
| Retail | 3 | $44B |
|
||
| Insurance | 3 | $26B |
|
||
| Media / Entertainment | 2 | $115B |
|
||
| Pharmaceuticals / Biotech | 2 | $62B |
|
||
Price history
+182.6% since first listed4 events — show timeline
- 2026-05-20 Relisted — DNAORMLS
- 2025-11-18 Listed $195,000 DNAORMLS
- 2004-03-02 Sold (Public Records) $65,000 Public Records
- 1998-04-01 Sold (Public Records) $69,000 Public Records
Property tax history
+1.9%/yrLatest (2025): $1,005 · +4.1% YoY. Source: county tax records.
Cash-flow waterfall
monthlySold comps — $/sqft
last 12 mo · ≤1 miLoading sold comps…