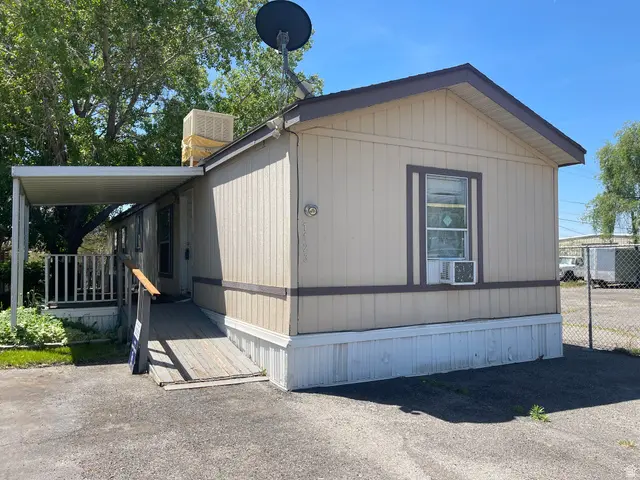
1123 W 465 N · Orem, UT
Flood risk No data
- FEMA flood zone
- —
- Chance of flooding over 30 yrs
- —
- Est. flood insurance / yr
- —
Fire risk No data
- Est. fire insurance / yr
- —
Heat risk No data
- Hot days now (above threshold)
- —
- Hot days in 30 yrs
- —
Wind risk No data
- Chance of severe wind over 30 yrs
- —
Air-quality risk No data
- Unhealthy air days now
- —
- Unhealthy air days in 30 yrs
- —
Risk factors via First Street. Map © Google.
Why this score? — see what drove the C- grade
The composite is a weighted blend of 9 inputs, each scored 0–100. Each bar is that input's sub-score; the figure is the points it added to the 100-point composite (weight × sub-score).
- Cash flow +15.3/30.0
- 1% rule +10.0/10.0
- ARV discount +7.5/15.0
- DSCR +4.7/10.0
- Livability +4.3/5.0
- Schools +4.2/10.0
- Rent growth +3.7/5.0
- Condition / age +2.5/5.0
- Appreciation +0.0/10.0
$55,500
🖨 Deal sheet 📄 Offer letter ✓ Due diligence
Listing remarks
Welcome to the Francis K Community - a quiet, friendly, and well-maintained neighborhood known for its safe atmosphere and reasonable park management. This home offers a great opportunity to add your own personal touches and build equity with some cosmetic updates, including flooring and possible cabinet improvements. Conveniently located just minutes from shopping, dining, entertainment, and freeway access, making commuting simple while still tucked away from heavy traffic. Utah Lake is only a short drive away for outdoor recreation and beautiful views. Affordable living in a central location with tons of potential! Water heater replaced within the last couple years as well as Air conditio
Key facts
- 3 parking spots
- Built 1999
- Listed 31 days
Property features AI
Finance
- Other: Subdivision: FRANCIS
- HOA & community: Homeowners association (Brandon); Monthly association fee of $830; HOA covers water, sewer and trash; Pets permitted
Exterior
- Parking: Uncovered open parking; Three open parking spaces (total 3)
- Utilities: Natural gas connected; Electricity connected; Sewer connected; Culinary water connected
- Home design: Mobile home style; Residence currently built and standing; Single-family zoning
- Construction: Asphalt roof; Other construction materials; No basement
- Exterior features: Covered deck; Sprinkler system (auto-full); Paved road access; Full landscaping; Mature trees
Interior
- Kitchen: Gas range; Built-in range/oven; Range hood; Refrigerator
- Bedrooms: Two main-level bedrooms; Primary bedroom on the 1st floor
- Flooring: Carpet; Linoleum
- Bathrooms: Two full bathrooms
- Heating & cooling: Forced air heating (gas central); Central air conditioning
- Interior features: Walk-in closet; Built-in range/oven; Range hood; Window blinds; Storage shed(s); Window coverings
- Laundry & utility: Washer; Dryer
Neighborhood map
What this means for you Summary
Snapshot
- This is a 2-bed/2.0-bath manufactured listed at $56k.
Deal economics
- At list price, monthly cash flow is $20 ($240/yr) — positive.
- The deal already cash-flows at list — no discount required.
- Meets the 1% rule at list price ($2k rent vs $56k).
- Recommended offer: $54k (3.0% below list) — sets the bar for market timing.
Location & tenants
- Location reads 86/100 on livability (#10 in UT, #389 nationally) — a professional / high-income tenant draw. Strengths: amenities A+, commute A+, housing A+.
- Alpine District (suburban): math 45% / reading 50% proficiency, ranked #25 of 80 in UT (top 31%) — families likely to look elsewhere, expect single-tenant / working-renter base with shorter leases; only 18% free/reduced lunch — higher-income household profile.
- Zoned schools: Aspen School (math 45% / reading 47%, grade D-, #218 of 585 statewide, top 38%, 421 students, 27% FRL); Orem Jr High (math 24% / reading 34%, grade F, #112 of 138 statewide, top 81%, 961 students, 41% FRL); Timpanogos High (math 38% / reading 55%, grade D-, #38 of 171 statewide, top 24%, 1,365 students, 24% FRL).
- Market conditions: Rents rising fast (+4.9%/yr); 143 active listings in the ZIP; 40 comparable units currently listed for rent nearby; rentals at typical pace (median 24d on market — plan ~3-4 weeks tenant-placement turnaround); solid renter incomes; 6,326 units permitted in Utah County in 2024 (1,053 in 5+ unit buildings).
Forward outlook
- Local home prices are declining (-3.0%/yr); year-one equity from $384 of loan paydown is wiped out by about $2k of value loss. Plan a longer hold.
- Utah County population projected at +49% by 2050 — long-run rental-demand tailwind backs the buy-and-hold thesis.
- At projected returns (-3.0% appreciation + 4.9% rent growth), your $16k cash investment doubles in ~10 years — after that, you're playing with house money.
Negotiation context
- It's been on market 31 days — a 3% lower offer ($54k) is reasonable based on typical stale-listing flexibility.
- 2 sale attempts since 20y ago; this cycle's ask has dropped $4k (8%) from the opening price — seller is motivated, your offer sets the floor, not the list.
Risks & watch-outs
- Watch-outs: HOA is 53% of rent.
Questions for the listing agent
- It's been on market 31 days. Have you received any prior offers? Is the seller open to a 3% concession, seller financing, or rate buy-down credit?
- What does the HOA fee cover, when was the last increase, and are there any pending special assessments or reserve-fund shortfalls?
- Is there a deadline driving the sale (1031 exchange, divorce, estate, relocation)? That informs how much negotiation room exists.
- Schools are B-rated — typically a magnet for longer-tenancy family renters. What's the average tenant stay here, and is there a school-zone premium baked into asking?
- What's the average days-on-market for RENTAL listings here right now (not sales)? A rising rental-DOM trend means longer vacancies and softer asking-rent achievability than the comps imply.
- What's the recent tenant-quality profile in this submarket — average credit score on applications, eviction rate, late-payment / NSF rate, and stable-employment percentage? A property-management company in the area should have these aggregated.
- How much new for-sale + rental construction is in the pipeline within 1–3 miles? Heavy new supply typically softens prices + rents 12–24 months out; constrained supply supports both.
Investment metrics
- 1% rule
- 2.81% ✓
- Cap rate
- 6.72%
- Cash-on-cash
- 1.54%
- DSCR
- 1.07
- GRM
- 3.0
CMA / ARV
No comps found within radius.
Projected returns pro-forma
-3.0% appreciation · 4.92% rent growth · sell at horizon
- IRR
- -6.7%
- Equity multiple
- 0.74×
- Total profit
- $-4,113
- Equity at exit
- $8,275
- IRR
- 8.9%
- Equity multiple
- 1.86×
- Total profit
- $13,345
- Equity at exit
- $4,799
Cash invested: $15,540 (down + closing). Projections, not guarantees.
Landlord ↔ Tenant lean methodology
- Overall (STATE)
- 86 Strongly Landlord-Friendly
- State Utah
- 86 Strongly Landlord-Friendly · R+15
- County
- — inherits STATE
- City
- — inherits STATE
ZIP-level market 84057
- Rents YoY
- 4.9%
- Active inventory
- 143
- Price-to-rent
- 3.0×
Monthly cashflow live
- Estimated rent
- $1,561 high interval (Pro) →
- Mortgage (P&I)
- −$291
- Tax est. 1.5%
- −$69 /mo · $832/yr
- Insurance
- −$23
- HOA
- −$830
- Vacancy / Maint / Mgmt
- −$328
- Net cashflow
- $20
Break-even live
UW: 25.0% down · 7.5% · 30yr · 1.5% tax · 5.0% vac · 8.0% maint · 8.0% mgmt
Financing live
Cash to close
- Down payment
- $13,875
- Closing costs
- $1,665
- Reserves months
- —
- Total cash needed
- —
Loan-product check · same deal, 3 products live
Conventional
25% down · 7.5% · 30yr
- Down + closing
- —
- Monthly P&I
- —
- Monthly cashflow
- —
- DSCR
- —
- Eligible?
- —
Personal DTI + credit; lowest rate.
DSCR
20% down · 8.5% · 30yr
- Down + closing
- —
- Monthly P&I
- —
- Monthly cashflow
- —
- DSCR
- —
- Eligible?
- —
No personal income docs; deal must DSCR.
Hard money
10% down · 12.0% · 12mo
- Down + closing
- —
- Monthly P&I
- —
- Monthly cashflow
- —
- DSCR
- —
- Eligible?
- —
Short-term bridge; refi at stabilization.
Rent comps 40 comps
| Address | Beds | Baths | Sqft | Rent | $/sqft | DOM | Units | Dist |
|---|---|---|---|---|---|---|---|---|
| 289 N 1030 W Orem, UT | 2.0 | 1.0 | 1092 | $1,395 | $1.28 | 3d | 1 | 0.22mi |
| 231 N 1200 W Orem, UT | 3.0 | 2.0 | 1336 | $1,725 | $1.29 | 14d | 1 | 0.25mi |
| 782 N 1570 W Orem, UT | 3.0 | 1.5 | 1300 | $1,500 | $1.15 | 23d | 1 | 0.65mi |
| 1080 W 965 N #304 Orem, UT | 2.0 | 1.0 | 950 | $1,350 | $1.42 | 3d | 1 | 0.71mi |
| 952 W 965 N #215 Orem, UT | 3.0 | 2.0 | 1313 | $1,890 | $1.44 | 3d | 1 | 0.73mi |
| 1018 N 985 W #510 Orem, UT | 3.0 | 2.0 | 1442 | $1,700 | $1.18 | 3d | 1 | 0.76mi |
| 1018 N 985 W #508 Orem, UT | 3.0 | 2.0 | 1314 | $1,925 | $1.46 | 3d | 1 | 0.77mi |
| 1027 W 1033 North St Unit S203 Orem, UT | 2.0 | 1.0 | 780 | $1,405 | $1.80 | 3d | 1 | 0.77mi |
| 225 N 680 E Vineyard, UT | 3.0 | 2.0 | 1311 | $1,725 | $1.32 | 23d | 1 | 0.78mi |
| 215 N 680 E Vineyard, UT | 3.0 | 2.0 | 1311 | $1,725 | $1.32 | 23d | 1 | 0.78mi |
| 1030 N 995 W #913 Orem, UT | 3.0 | 2.0 | 1442 | $1,850 | $1.28 | 3d | 1 | 0.78mi |
| 1043 N 920 W Unit F609 Orem, UT | 2.0 | 1.0 | 951 | $1,600 | $1.68 | 3d | 1 | 0.82mi |
| 1043 N 920 W Unit F612 Orem, UT | 2.0 | 1.0 | 951 | $1,490 | $1.57 | 23d | 1 | 0.82mi |
| 217 N 670 E Unit 102 Vineyard, UT | 2.0 | 2.0 | 1039 | $1,480 | $1.42 | 23d | 1 | 0.83mi |
| 217 N 670 E Unit 104 Vineyard, UT | 1.0 | 1.0 | 813 | $1,285 | $1.58 | 23d | 1 | 0.83mi |
| 265 N 670 E Unit 205 Vineyard, UT | 2.0 | 2.0 | 1020 | $1,620 | $1.59 | 23d | 1 | 0.84mi |
| 265 N 670 E Unit 204 Vineyard, UT | 1.0 | 1.0 | 794 | $1,285 | $1.62 | 23d | 1 | 0.84mi |
| 279 N 670 E Unit 108 Vineyard, UT | 2.0 | 2.0 | 1020 | $1,480 | $1.45 | 23d | 1 | 0.85mi |
| 648 E 230 N Unit 307 Vineyard, UT | 2.0 | 2.0 | 1020 | $1,480 | $1.45 | 23d | 1 | 0.85mi |
| 648 E 230 N Unit 209 Vineyard, UT | 1.0 | 1.0 | 794 | $1,285 | $1.62 | 23d | 1 | 0.85mi |
| 662 E 230 N Unit 311 Vineyard, UT | 2.0 | 2.0 | 1020 | $1,480 | $1.45 | 23d | 1 | 0.86mi |
| 651 E 180 N Unit 210 Vineyard, UT | 1.0 | 1.0 | 794 | $1,285 | $1.62 | 23d | 1 | 0.86mi |
| 651 E 180 N Unit 312 Vineyard, UT | 3.0 | 2.0 | 1299 | $1,785 | $1.37 | 23d | 1 | 0.86mi |
| 624 E 300 N Vineyard, UT | 3.0 | 2.0 | 1323 | $1,785 | $1.35 | 23d | 1 | 0.86mi |
| 624 E 300 N Unit 206 Vineyard, UT | 2.0 | 2.0 | 1039 | $1,620 | $1.56 | 21d | 1 | 0.86mi |
| 623 E 250 N Vineyard, UT | 1.0 | 1.0 | 794 | $1,285 | $1.62 | 23d | 1 | 0.87mi |
| 623 E 250 N Unit 301 Vineyard, UT | 3.0 | 2.0 | 1324 | $1,920 | $1.45 | 23d | 1 | 0.87mi |
| 632 E 230 N Unit 306 Vineyard, UT | 2.0 | 2.0 | 1020 | $1,480 | $1.45 | 23d | 1 | 0.87mi |
| 631 E 180 N Unit 203 Vineyard, UT | 1.0 | 1.0 | 794 | $1,285 | $1.62 | 23d | 1 | 0.88mi |
| 631 E 180 N Unit 301 Vineyard, UT | 3.0 | 2.0 | 1299 | $1,785 | $1.37 | 23d | 1 | 0.88mi |
| 631 E 180 N Unit 105 Vineyard, UT | 2.0 | 2.0 | 1039 | $1,480 | $1.42 | 23d | 1 | 0.89mi |
| 266 N 590 E Unit 107 Vineyard, UT | 2.0 | 2.0 | 1020 | $1,480 | $1.45 | 23d | 1 | 0.89mi |
| 266 N 590 E Unit 110 Orem, UT | 1.0 | 1.0 | 794 | $1,285 | $1.62 | 23d | 1 | 0.89mi |
| 614 E 230 N Unit 111 Vineyard, UT | 2.0 | 2.0 | 1039 | $1,480 | $1.42 | 23d | 1 | 0.89mi |
| 615 E 180 N Unit 308 Vineyard, UT | 2.0 | 2.0 | 1020 | $1,480 | $1.45 | 23d | 1 | 0.90mi |
| 615 E 180 N Unit 312 Vineyard, UT | 3.0 | 2.0 | 1299 | $1,785 | $1.37 | 23d | 1 | 0.90mi |
| 594 E 255 N Unit 105 Orem, UT | 2.0 | 2.0 | 1039 | $1,480 | $1.42 | 23d | 1 | 0.91mi |
| 125 N Mill Rd Vineyard, UT | 1.0–3.0 | 1.0–2.0 | 933 | $1,410 | $1.51 | 14d | 10 | 0.91mi |
| 125 N Mill Rd Vineyard, UT | 1.0–3.0 | 1.0–2.0 | 933 | $1,410 | $1.51 | 3d | 10 | 0.91mi |
| 283 N 590 E Unit 301 Vineyard, UT | 3.0 | 2.0 | 1299 | $1,920 | $1.48 | 23d | 1 | 0.91mi |
HOA detail
- Monthly dues
- $830 · $9,960/yr
- Likely covers
- water
Listing history 11 events
-
2026-06-09status $55,500 Under Contract 31 DOM
-
2026-06-08days on market $55,500 Active 31 DOM
-
2026-06-07days on market $55,500 Active 30 DOM
-
2026-06-03days on market $55,500 Active 26 DOM
-
2026-06-03days on market $55,500 Active 25 DOM
-
2026-06-01days on market $55,500 Active 24 DOM
-
2026-05-31days on market $55,500 Active 23 DOM
-
2026-05-31days on market $55,500 Active 22 DOM
-
2026-05-09$60,000 Active
-
2006-08-18historical
-
2006-04-06$41,500
ⓘ Source: listings_history table (triggers on properties + properties_extension) + one-shot
backfill from property_details.listing_events for pre-trigger history.
Nearby sold comps map
Loading sold comps map…
Walkable amenities ~0.75 mi
Loading nearby amenities…
Taxation est. · year 1
- Rental income
- $18,737
- − Mortgage interest
- −$3,109
- − Property taxes
- −$832
- − Insurance
- −$278
- − Repairs & maintenance
- −$1,499
- − Management
- −$1,499
- − HOA
- −$9,960
- − Depreciation
- −$1,615
- Taxable loss
- −$54
- Est. tax savings @ 24.0%
- +$13
- After-tax cash flow
- $253/yr
For passive investors: Depreciation is non-cash, so a rental often shows a tax loss while cash-flowing — sheltering income. Rental losses are passive: they offset passive income freely, and up to $25,000/yr can offset ordinary (W-2) income if you actively participate and your MAGI is under $100k (phasing out to $0 by $150k); unused losses carry forward. On sale, claimed depreciation is recaptured at up to 25%, and gains may owe capital-gains tax (a 1031 exchange can defer both). Figures are a year-1 estimate at your 24.0% rate — not tax advice; consult a CPA.
Schools (NCES district)
- District
- Alpine District
- NCES district ID
- 4900030
- Math proficiency
- 45% ▼ -4.00%
- Reading proficiency
- 50% ▼ -2.00%
- Median HH income
- $68,595
- Composite
- 42.48/100
- National rank
- #3213
- State rank
- #25 of 80 in UT
Livability — Orem
- Score
- 86/100
- State rank
- #10
- US rank
- #389
Category grades
Schools grade is shown separately in the Schools card above.
Census & demographics
- Census place
- Orem, UT
- County
- Utah County · 661,754 people
- City population
- 94,197
- Metro
- Provo-Orem, UT
- Population (ZIP)
- 36,881
- Household income
- $82,780
- Rent vs Own
- Severe rent burden
- 676.0
Population outlook (Utah County) Hauer SSP2
- Today (2025)
- 693,420 people
- By 2030
- 757,324 · +9.2%
- By 2040
- 893,178 · +28.8%
- By 2050
- 1,035,842 · +49.4%
- By 2075
- 1,376,733 · +98.5%
- By 2100
- 1,609,388 · +132.1%
Race, ethnicity, and origin ACS 2023
- Neighborhood character
- Predominantly White (66%)
- Race & ethnicity
- White 66% Hispanic / Latino 25% Two or more races 13% Asian 2% Pacific Islander 1%
- Hispanic origin (detail)
- Mexican 17% Salvadoran 1%
- Common ancestry
- Italian 5% Slovak 4% Portuguese 2%
- Foreign-born
- 13% · Canada, Dominican Republic, China
- Languages at home
- 75% English-only · Spanish 19% Other Indo-European 2% Other Asian/Pacific 1%
Political lean MEDSL · Utah
- 2024 margin
- Solid R (+39.8) · D 28.5% · R 68.3% · Other 3.2%
- 2008→2024 swing
- +19.1pp toward D · 2008: -58.9pp · 2024: -39.8pp
- All cycles
- 2024: R+39.8 2020: R+41.0 2016: R+37.3 2012: R+78.5 2008: R+58.9
Not yet ingested
- Civics
- —
Market trends
- HPI YoY
- ▼ -365.90%
- Current HPI
- 319.4849
- Rent YoY
- ▲ 4.92%
- Metro
- Provo-Orem, UT
- State GDP YoY
- ▲ 3.54%
- F500 in state
- 2
Industry mix (Fortune 500 HQ in UT)
| Industry | F500 HQs | Revenue |
|---|---|---|
| Financial Services | 1 | $3B |
|
||
Price history
+44.6% since first listed3 events — show timeline
- 2026-05-09 Listed $60,000 WFRMLS
- 2006-08-18 Listing Removed — WFRMLS
- 2006-04-06 Listed $41,500 WFRMLS
Cash-flow waterfall
monthlySold comps — $/sqft
last 12 mo · ≤1 miLoading sold comps…