1071 Lexi Ct · Summerville, SC
Flood risk 1/10 · Minimal
- FEMA flood zone
- X (unshaded)
- Chance of flooding over 30 yrs
- 0.0%
- Est. flood insurance / yr
- $507 – $1,088
Fire risk 3/10 · Minor
- Est. fire insurance / yr
- $783 – $1,453
Heat risk 9/10 · Severe
- Hot days now (above 108°F)
- 7 days/yr
- Hot days in 30 yrs
- 17 days/yr
Wind risk 8/10 · Major
- Chance of severe wind over 30 yrs
- 99.0%
Air-quality risk 3/10 · Minor
- Unhealthy air days now
- 3 days/yr
- Unhealthy air days in 30 yrs
- 3 days/yr
Risk factors via First Street. Map © Google.
Why this score? — see what drove the D grade
The composite is a weighted blend of 9 inputs, each scored 0–100. Each bar is that input's sub-score; the figure is the points it added to the 100-point composite (weight × sub-score).
- Cash flow +11.8/30.0
- ARV discount +11.8/15.0
- Schools +4.1/10.0
- DSCR +3.5/10.0
- Rent growth +3.4/5.0
- 1% rule +3.2/10.0
- Livability +3.2/5.0
- Condition / age +2.5/5.0
- Appreciation +0.0/10.0
$229,900
🖨 Deal sheet (PDF) 📄 Offer letter ✓ Due diligence
Listing remarks MLS
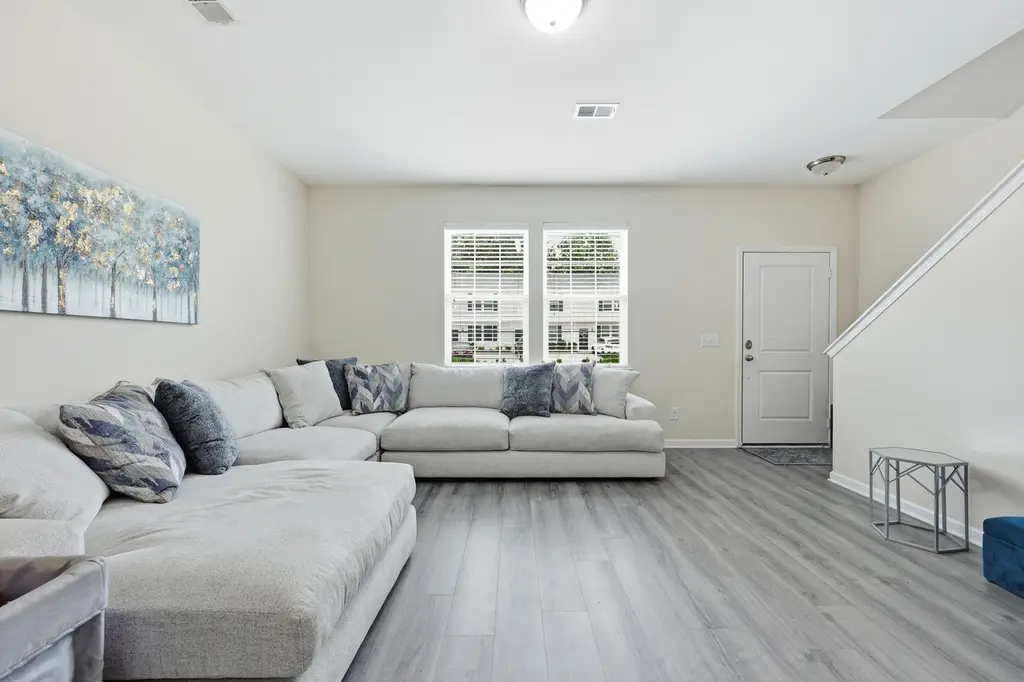
These townhomes feature an open floor plan with a spacious family room and eat in kitchen, a half bath and laundry room on the main level. Three bedrooms upstairs and two full baths. Located in the Oakbrook area of Summerville. Close to shopping, dining, entertainment, and in greatly sought after Dorchester 2 school district. Close to the Airport, Boeing, Bosch and the Air Force Base. This is an end unit.
Key facts
- Open floor plan
- Covered back patio
- En-suite bathroom
Tags
Property features AI
Finance
- HOA & community: Homeowners association fee of $140 per month
Exterior
- Utilities: Public sewer
- Home design: Single-family attached townhouse; Two levels
- Exterior features: Located in the Oakbrook Park subdivision
Interior
- Kitchen: Dishwasher; Electric range; Microwave; Refrigerator
- Bedrooms: 3 bedrooms; Primary bedroom on the upper level
- Bathrooms: 2 full bathrooms and 1 half bathroom
- Heating & cooling: Central heating; Central air conditioning
- Interior features: Smooth ceilings; Eat-in kitchen; Formal living room
- Laundry & utility: Dedicated laundry room
Neighborhood map
What this means for you Summary
Snapshot
- This is a 3-bed/2.0-bath townhouse listed at $230k.
Deal economics
- At list price, monthly cash flow is $-61 ($-734/yr) — negative.
- To cash-flow at today's rent, offer at most $219k (4.7% below list).
- To meet the 1% rule (rent ≥ 1% of price), the offer needs to be $189k (17.7% below list).
- Recommended offer: $189k (17.7% below list) — sets the bar for 1% rule.
- Cap rate 6.0% vs local median 3.9% in Summerville — top-decile yield for the area; either an underpriced asset or a hidden risk that comps aren't pricing in. Stress-test before assuming the spread holds.
Location & tenants
- Location reads 63/100 on livability (#167 in SC) — a middle-class / working-renter tenant base. Strengths: housing A+, cost of living B+; Watch: amenities F, commute F, health & safety F.
- Dorchester 02 (suburban): math 40% / reading 55% proficiency, ranked #12 of 80 in SC (top 15%) — families likely to look elsewhere, expect single-tenant / working-renter base with shorter leases.
- Zoned schools: Joseph R. Pye Elementary (math 49% / reading 55%, grade C-, #145 of 597 statewide, top 26%, 823 students, 55% FRL); Oakbrook Middle (math 25% / reading 39%, grade F, #119 of 229 statewide, top 54%, 1,006 students, 67% FRL); Ashley Ridge High (math 73% / reading 93%, grade A, #18 of 196 statewide, top 9%, 2,542 students, 50% FRL) — zoned schools average 57% FRL vs 36% district-wide (21 pts higher); higher-poverty schools than district average — tighter screening recommended.
- Market conditions: Rents rising (+3.6%/yr); 180 active listings in the ZIP; 40 comparable units currently listed for rent nearby; rentals at typical pace (median 21d on market — plan ~3-4 weeks tenant-placement turnaround); solid renter incomes; 1,199 units permitted in Dorchester County in 2024 (0 in 5+ unit buildings).
Forward outlook
- Local home prices are declining (-3.0%/yr); year-one equity from $2k of loan paydown is wiped out by about $7k of value loss. Plan a longer hold.
- Dorchester County population projected at +43% by 2050 — long-run rental-demand tailwind backs the buy-and-hold thesis.
Negotiation context
- It's been on market 22 days — a 2% lower offer ($226k) is reasonable based on typical stale-listing flexibility.
- 2 sale attempts since 7y ago with the ask held roughly flat each time — persistent listings suggest the price (not the market) is what's stuck; bring a comps-based counter.
- Current owner paid $164k; 41% above their basis — modest negotiation headroom, anchor on the comps not their cost.
Risks & watch-outs
- Climate carrying-cost: severe wind risk, 99% chance of damaging wind over 30y; extreme-heat days projected 7→17/yr by 2055 (HVAC capex compounding) — expect insurance premiums to compound above CPI over the hold.
Questions for the listing agent
- What do current leases actually rent for vs. the listed asking? Can we see a recent rent roll and the last 12 months of T-12 income?
- What does the HOA fee cover, when was the last increase, and are there any pending special assessments or reserve-fund shortfalls?
- Is there a deadline driving the sale (1031 exchange, divorce, estate, relocation)? That informs how much negotiation room exists.
- Schools are B-rated — typically a magnet for longer-tenancy family renters. What's the average tenant stay here, and is there a school-zone premium baked into asking?
- The area grade is low — what's the realistic commute time and amenity access for the typical tenant pool here? Any planned neighborhood developments (good or bad) we should know about?
- What's the average days-on-market for RENTAL listings here right now (not sales)? A rising rental-DOM trend means longer vacancies and softer asking-rent achievability than the comps imply.
- What's the recent tenant-quality profile in this submarket — average credit score on applications, eviction rate, late-payment / NSF rate, and stable-employment percentage? A property-management company in the area should have these aggregated.
- How much new for-sale + rental construction is in the pipeline within 1–3 miles? Heavy new supply typically softens prices + rents 12–24 months out; constrained supply supports both.
Investment metrics
- 1% rule
- 0.82% ✗
- Cap rate
- 5.97%
- Cash-on-cash
- -1.14%
- DSCR
- 0.95
- GRM
- 10.1
CMA / ARV
- ARV (on-the-fly)
- $254,181
- Comps found
- 12
Show comp detail 12 sales within ~0.75 mi
| Address | Dist | Beds/Ba | Sqft | Sold | Price | $/sf | Match |
|---|---|---|---|---|---|---|---|
| 1064 Lexi Ct | 0.04mi | 3/2.5 | 1,319 (+0%) | 2mo | $225,000 | $171 | 94 |
| 1076 Lexi Ct | 0.03mi | 2/2.5 (-1) | 1,319 (+0%) | 2mo | $214,000 | $162 | 90 |
| 1069 Lexi Ct | 0.01mi | 3/2.5 | 1,319 (+0%) | 11mo | $255,000 | $193 | 88 |
| 1001 Lexi Ct | 0.15mi | 3/2.5 | 1,328 (+1%) | 9mo | $239,000 | $180 | 82 |
| 4174 Hickory Ln | 0.24mi | 3/2.0 | 1,300 (-1%) | 6mo | $265,000 | $204 | 82 |
| 4153 Hickory Ln | 0.31mi | 3/2.0 | 1,220 (-7%) | 11mo | $252,000 | $207 | 64 |
| 106 Hardee Ave | 0.61mi | 2/2.0 (-1) | 1,282 (-3%) | 11mo | $235,000 | $183 | 53 |
| 214 Hardee Ave Ave | 0.74mi | 2/2.0 (-1) | 1,264 (-4%) | 10mo | $225,000 | $178 | 45 |
| 105 Hardee Ave | 0.62mi | 2/2.0 (-1) | 1,120 (-15%) | 4mo | $259,000 | $231 | 38 |
| 122 Stewart Pl | 0.57mi | 2/2.0 (-1) | 1,120 (-15%) | 10mo | $225,000 | $201 | 35 |
| 103 Dupont Way | 0.65mi | 2/2.0 (-1) | 1,120 (-15%) | 10mo | $210,000 | $188 | 32 |
| 105 Dupont Way | 0.66mi | 2/2.0 (-1) | 1,120 (-15%) | 10mo | $234,990 | $210 | 31 |
Match score weights: distance 35% · size 25% · config 20% · recency 20%. Top-matched comps best support the ARV.
Projected returns pro-forma
-3.0% appreciation · 3.62% rent growth · sell at horizon
- IRR
- -17.5%
- Equity multiple
- 0.38×
- Total profit
- $-39,952
- Equity at exit
- $34,279
- IRR
- -8.4%
- Equity multiple
- 0.46×
- Total profit
- $-34,832
- Equity at exit
- $19,878
Cash invested: $64,372 (down + closing). Projections, not guarantees.
Landlord ↔ Tenant lean methodology
- Overall (STATE)
- 90 Strongly Landlord-Friendly
- State South Carolina
- 90 Strongly Landlord-Friendly · R+6
- County
- — inherits STATE
- City
- — inherits STATE
ZIP-level market 29456
- Home prices YoY
- -15.1%
- Rents YoY
- 3.6%
- Active inventory
- 180
- Price-to-rent
- 10.1×
Monthly cashflow live
- Estimated rent
- $1,893 high interval (Pro) →
- Mortgage (P&I)
- −$1,206
- Tax from tax record
- −$115 /mo · $1,384/yr
- Insurance
- −$96
- HOA
- −$140
- Vacancy / Maint / Mgmt
- −$398
- Net cashflow
- $-61
Break-even live
Sensitivity live
| Price | -10% $69 | -5% $4 | +0% $-61 | +5% $-126 | +10% $-191 |
|---|---|---|---|---|---|
| Rent | -10% $-211 | -5% $-136 | +0% $-61 | +5% $14 | +10% $88 |
| Rate | -1.0pp $55 | -0.5pp $-3 | base $-61 | +0.5pp $-121 | +1.0pp $-181 |
UW: 25.0% down · 7.5% · 30yr · 1.5% tax · 5.0% vac · 8.0% maint · 8.0% mgmt
Financing live
Cash to close
- Down payment
- $57,475
- Closing costs
- $6,897
- Reserves months
- —
- Total cash needed
- —
Loan-product check · same deal, 3 products live
Conventional
25% down · 7.5% · 30yr
- Down + closing
- —
- Monthly P&I
- —
- Monthly cashflow
- —
- DSCR
- —
- Eligible?
- —
Personal DTI + credit; lowest rate.
DSCR
20% down · 8.5% · 30yr
- Down + closing
- —
- Monthly P&I
- —
- Monthly cashflow
- —
- DSCR
- —
- Eligible?
- —
No personal income docs; deal must DSCR.
Hard money
10% down · 12.0% · 12mo
- Down + closing
- —
- Monthly P&I
- —
- Monthly cashflow
- —
- DSCR
- —
- Eligible?
- —
Short-term bridge; refi at stabilization.
Rent comps 40 comps
| Address | Beds | Baths | Sqft | Rent | $/sqft | DOM | Units | Dist |
|---|---|---|---|---|---|---|---|---|
| 325 Midland Pkwy Summerville, SC | 1.0–3.0 | 1.0–2.0 | 1040 | $2,039 | $1.96 | 5d | 21 | 0.22mi |
| 9604 Blue Jay Ct Ladson, SC | 2.0 | 2.0 | 1100 | $1,549 | $1.41 | 25d | 1 | 0.29mi |
| 105 Hickory Ln Unit A Ladson, SC | 2.0 | 1.5 | 943 | $1,475 | $1.56 | 25d | 1 | 0.42mi |
| 107 Hickory Ln Unit D Ladson, SC | 2.0 | 1.5 | 943 | $1,550 | $1.64 | 5d | 1 | 0.43mi |
| 251 Grand Oaks Dr Ladson, SC | 3.0 | 3.5 | 1552 | $2,100 | $1.35 | 5d | 1 | 0.46mi |
| 148 Grand Oaks Dr Ladson, SC | 3.0 | 2.5 | 1540 | $2,149 | $1.40 | 13d | 1 | 0.46mi |
| 111 Finch St Ladson, SC | 3.0 | 2.0 | 1400 | $2,000 | $1.43 | 25d | 1 | 0.48mi |
| 184 Grand Oaks Dr Ladson, SC | 3.0 | 3.5 | 1552 | $2,025 | $1.30 | 5d | 1 | 0.49mi |
| 112 Stewart Pl Summerville, SC | 2.0 | 2.0 | 979 | $1,700 | $1.74 | 25d | 1 | 0.58mi |
| 9155 Parlor Dr Ladson, SC | 3.0 | 2.5 | 1473 | $1,950 | $1.32 | 16d | 1 | 0.65mi |
| 9155 Parlor Dr Ladson, SC | 3.0 | 2.5 | 1473 | $1,950 | $1.32 | 23d | 1 | 0.65mi |
| 614 Knowledge Dr Ladson, SC | 3.0 | 2.5 | 1860 | $2,550 | $1.37 | 13d | 1 | 0.67mi |
| 158 Hummingbird Ave Unit B Ladson, SC | 2.0 | 2.0 | 1000 | $1,700 | $1.70 | 25d | 1 | 0.75mi |
| 807 Sandpiper Dr Unit A Ladson, SC | 2.0 | 1.0 | 900 | $1,350 | $1.50 | 25d | 1 | 0.77mi |
| 825 Sandpiper Dr Unit B Ladson, SC | 2.0 | 2.0 | 1000 | $1,450 | $1.45 | 23d | 1 | 0.81mi |
| 108 Henrietta Dr Ladson, SC | 4.0 | 2.0 | 1429 | $2,161 | $1.51 | 16d | 1 | 0.82mi |
| 821 Sandpiper Dr Unit A Ladson, SC | 2.0 | 2.0 | 950 | $1,400 | $1.47 | 16d | 1 | 0.84mi |
| 126 Tuscany Ct Ladson, SC | 3.0 | 2.5 | 1360 | $1,795 | $1.32 | 21d | 1 | 0.85mi |
| 126 Tuscany Ct Ladson, SC | 3.0 | 2.5 | 1360 | $1,795 | $1.32 | 25d | 1 | 0.85mi |
| 101 Timber Ln Unit C Summerville, SC | 2.0 | 1.5 | 1000 | $1,375 | $1.38 | 25d | 1 | 0.88mi |
| 111 Springview Ln Summerville, SC | 1.0–3.0 | 1.0–2.0 | 1072 | $1,875 | $1.75 | 5d | 16 | 0.89mi |
| 216 Parlor Dr Unit A And B Ladson, SC | 2.0 | 2.0 | 1035 | $1,600 | $1.55 | 5d | 1 | 0.90mi |
| 1425 Old Trolley Rd Summerville, SC | 1.0–2.0 | 1.0–2.0 | 875 | $1,631 | $1.86 | 5d | 10 | 0.93mi |
| 5208 Copley Cir Summerville, SC | 3.0 | 2.0 | 1136 | $2,100 | $1.85 | 16d | 1 | 0.97mi |
| 950 Travelers Blvd Summerville, SC | 2.0 | 1.0 | 695 | $1,509 | $2.17 | 5d | 4 | 0.97mi |
| 1660 Old Trolley Rd Summerville, SC | 1.0–3.0 | 1.0–2.0 | 950 | $1,795 | $1.89 | 5d | 9 | 0.98mi |
| 101 Bridge Pointe Ln Summerville, SC | 2.0 | 3.0 | 1181 | $2,040 | $1.73 | 25d | 1 | 1.00mi |
| 101 Bridge Pointe Ln Summerville, SC | 2.0 | 2.0 | 1154 | $1,598 | $1.38 | 5d | 1 | 1.00mi |
| 101 Bridge Pointe Ln Summerville, SC | 3.0 | 3.0 | 1668 | $2,267 | $1.36 | 16d | 1 | 1.00mi |
| 111 Coopers Ridge Blvd Ladson, SC | 1.0–3.0 | 1.0–3.0 | 996 | $1,845 | $1.85 | 5d | 9 | 1.01mi |
| 106 Kimeran Ln Summerville, SC | 2.0 | 1.5 | 1000 | $1,350 | $1.35 | 21d | 1 | 1.01mi |
| 583 Travelers Blvd Summerville, SC | 2.0 | 2.5 | 1250 | $1,600 | $1.28 | 25d | 1 | 1.18mi |
| 3785 Ladson Rd Ladson, SC | 1.0–3.0 | 1.0–2.0 | 1020 | $2,043 | $2.00 | 5d | 26 | 1.29mi |
| 124 Miley Dr Summerville, SC | 3.0 | 2.0 | 1460 | $1,900 | $1.30 | 25d | 1 | 1.30mi |
| 3825 Ladson Rd Ladson, SC | 3.0 | 2.0 | 1311 | $1,923 | $1.47 | 25d | 1 | 1.34mi |
| 3825 Ladson Rd Ladson, SC | 2.0 | 2.0 | 1065 | $1,651 | $1.55 | 21d | 1 | 1.34mi |
| 9989 Dorchester Rd Summerville, SC | 1.0–2.0 | 1.0–2.0 | 865 | $1,683 | $1.95 | 5d | 18 | 1.34mi |
| 2041 Old Trolley Rd Summerville, SC | 2.0 | 2.0 | 966 | $1,440 | $1.49 | 25d | 1 | 1.39mi |
| 117 Lynches River Dr Summerville, SC | 3.0 | 2.5 | 1470 | $1,999 | $1.36 | 25d | 1 | 1.44mi |
| 160 Wainwright Mnr Summerville, SC | 3.0 | 2.5 | 1867 | $2,500 | $1.34 | 25d | 1 | 1.48mi |
HOA detail
- Monthly dues
- $140 · $1,680/yr
Listing history 17 events
-
2026-06-22days on market $229,900 Active 22 DOM
-
2026-06-19price $229,900 Active 19 DOM
-
2026-06-18days on market $238,999 Active 19 DOM
-
2026-06-17days on market $238,999 Active 18 DOM
-
2026-06-16days on market $238,999 Active 17 DOM
-
2026-06-15days on market $238,999 Active 16 DOM
-
2026-06-13days on market $238,999 Active 14 DOM
-
2026-06-13days on market $238,999 Active 13 DOM
-
2026-06-10days on market $238,999 Active 11 DOM
-
2026-06-09days on market $238,999 Active 10 DOM
-
2026-06-08days on market $238,999 Active 9 DOM
-
2026-06-07pricedays on market $238,999 Active 8 DOM
-
2026-06-03days on market $239,999 Active 4 DOM
-
2026-06-03days on market $239,999 Active 3 DOM
-
2026-06-01days on market $239,999 Active 2 DOM
-
2026-05-31remarks 699-char remark
-
2026-05-31$239,999 Active 1 DOM
ⓘ Source: listings_history table (triggers on properties + properties_extension) + one-shot
backfill from property_details.listing_events for pre-trigger history.
Tax reassessment forecast SC · Resets to sale price
- Current annual tax
- $1,384 · $115/mo
- Projected year-2 tax
- $1,384 · $115/mo
- Expected delta
- $0/yr ($0/mo · 0.0%)
ⓘ Screening estimate from a state-policy table — verify with the county assessor before closing.
Climate risk First Street
- Flood 1/10 Low FEMA zone X (unshaded) · 0% chance over 30 yrs
- Wildfire 3/10 Moderate
- Heat 9/10 Extreme 7 d/yr ≥108°F today · 17 d/yr by 30 yrs out
- Wind 8/10 Severe 99% chance of damaging wind over 30 yrs
- Air quality 3/10 Moderate 3 unhealthy d/yr today · 3 by 30 yrs out
Nearby sold comps map
Loading sold comps map…
Walkable amenities ~0.75 mi
Loading nearby amenities…
Taxation est. · year 1
- Rental income
- $22,717
- − Mortgage interest
- −$12,878
- − Property taxes
- −$1,384
- − Insurance
- −$1,150
- − Repairs & maintenance
- −$1,817
- − Management
- −$1,817
- − HOA
- −$1,680
- − Depreciation
- −$6,688
- Taxable loss
- −$4,697
- Est. tax savings @ 24.0%
- +$1,127
- After-tax cash flow
- $393/yr
For passive investors: Depreciation is non-cash, so a rental often shows a tax loss while cash-flowing — sheltering income. Rental losses are passive: they offset passive income freely, and up to $25,000/yr can offset ordinary (W-2) income if you actively participate and your MAGI is under $100k (phasing out to $0 by $150k); unused losses carry forward. On sale, claimed depreciation is recaptured at up to 25%, and gains may owe capital-gains tax (a 1031 exchange can defer both). Figures are a year-1 estimate at your 24.0% rate — not tax advice; consult a CPA.
Schools (NCES district)
- District
- Dorchester 02
- NCES district ID
- 4502010
- Math proficiency
- 40% ▼ -13.00%
- Reading proficiency
- 55% ▼ -4.00%
- Median HH income
- $57,937
- Composite
- 41.41/100
- National rank
- #3475
- State rank
- #12 of 80 in SC
Livability — Summerville
- Score
- 63/100
- State rank
- #167
- US rank
- #15058
Category grades
Schools grade is shown separately in the Schools card above.
Census & demographics
- County
- Dorchester County · 182,866 people
- City population
- 171,668
- Metro
- Charleston-North Charleston, SC
- Population (ZIP)
- 41,214
- Household income
- $78,361
- Rent vs Own
- Severe rent burden
- 1384.0
Population outlook (Dorchester County) Hauer SSP2
- Today (2025)
- 186,982 people
- By 2030
- 203,967 · +9.1%
- By 2040
- 237,160 · +26.8%
- By 2050
- 267,479 · +43.1%
- By 2075
- 333,025 · +78.1%
- By 2100
- 366,560 · +96.0%
Race, ethnicity, and origin ACS 2023
- Neighborhood character
- Diverse neighborhood (Simpson 0.67)
- Race & ethnicity
- White 47% Black 29% Hispanic / Latino 14% Two or more races 10% Asian 4%
- Hispanic origin (detail)
- Mexican 8% Puerto Rican 1%
- Common ancestry
- Romanian 2% Slovak 2% Lithuanian 2%
- Foreign-born
- 11% · Canada
- Languages at home
- 82% English-only · Spanish 10% Other Indo-European 3% Tagalog/Filipino 1%
Political lean MEDSL · Dorchester
- 2024 margin
- R (+14.6) · D 41.8% · R 56.4% · Other 1.9%
- 2008→2024 swing
- +0.9pp no change · 2008: -15.5pp · 2024: -14.6pp
- All cycles
- 2024: R+14.6 2020: R+10.5 2016: R+17.5 2012: R+16.0 2008: R+15.5
Not yet ingested
- Civics
- —
Market trends
- HPI YoY
- ▼ -55.17%
- Current HPI
- 310.9027
- Rent YoY
- ▲ 3.62%
- Metro
- Charleston-North Charleston, SC
- State GDP YoY
- ▲ 4.51%
- F500 in state
- 2
Industry mix (Fortune 500 HQ in SC)
| Industry | F500 HQs | Revenue |
|---|---|---|
| Packaging | 1 | $7B |
|
||
Price history
-52.0% since first listed7 events — show timeline
- 2026-05-30 Listed $239,999 Charleston Trident MLS
- 2019-08-16 Sold (Public Records) $163,500 Public Records
- 2019-08-13 Sold (MLS) $163,500 Charleston Trident MLS
- 2019-06-27 Contingent — Charleston Trident MLS
- 2019-05-20 Listed $165,000 Charleston Trident MLS
- 2014-12-18 Sold (Public Records) $150,000 Public Records
- 2011-07-05 Sold (Public Records) $500,000 Public Records
Property tax history
+57.7%/yrLatest (2025): $1,384 · -0.0% YoY. Source: county tax records.
Cash-flow waterfall
monthlySold comps — $/sqft
last 12 mo · ≤1 miLoading sold comps…