 Fourplex
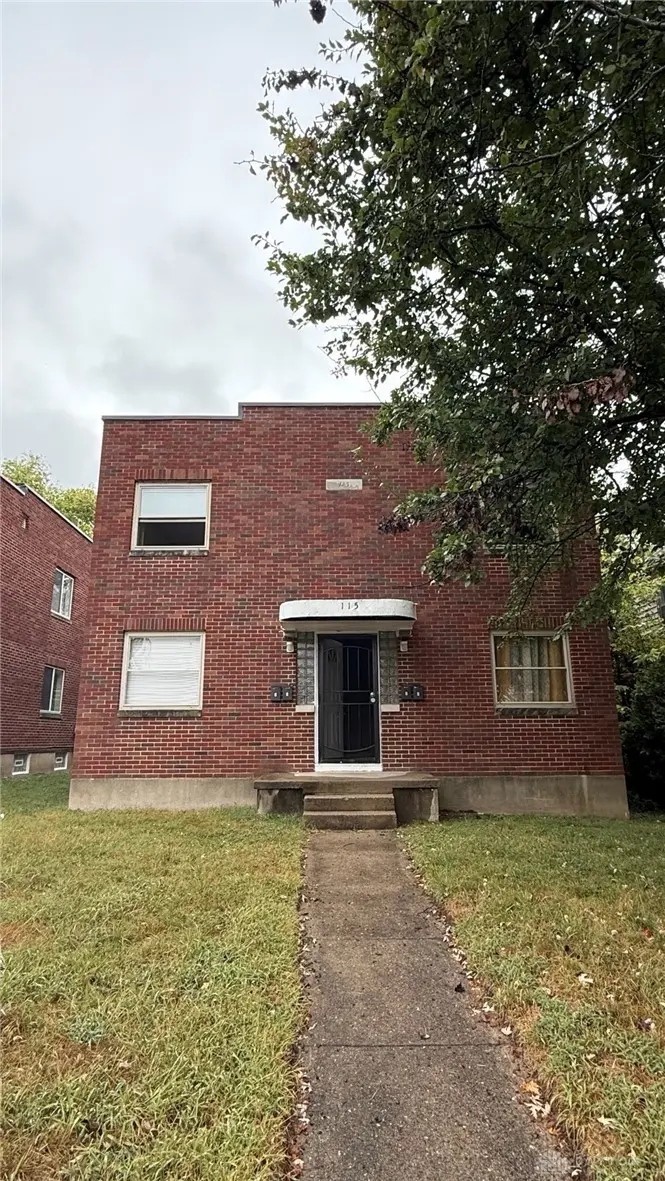
115 E Norman Ave · Dayton, OH
Flood risk 1/10 · Minimal
- FEMA flood zone
- X (unshaded)
- Chance of flooding over 30 yrs
- 0.0%
- Est. flood insurance / yr
- $473 – $860
Fire risk 1/10 · Minimal
- Est. fire insurance / yr
- $713 – $1,323
Heat risk 3/10 · Minor
- Hot days now (above 104°F)
- 7 days/yr
- Hot days in 30 yrs
- 18 days/yr
Wind risk 2/10 · Minimal
- Chance of severe wind over 30 yrs
- —
Air-quality risk 3/10 · Minor
- Unhealthy air days now
- 2 days/yr
- Unhealthy air days in 30 yrs
- 4 days/yr
Risk factors via First Street. Map © Google.
Why this score? — see what drove the C- grade
The composite is a weighted blend of 9 inputs, each scored 0–100. Each bar is that input's sub-score; the figure is the points it added to the 100-point composite (weight × sub-score).
- Cash flow +26.9/30.0
- DSCR +9.3/10.0
- 1% rule +6.9/10.0
- Rent growth +3.6/5.0
- Livability +3.2/5.0
- Condition / age +2.5/5.0
- Schools +1.3/10.0
- ARV discount +0.0/15.0
- Appreciation +0.0/10.0
$290,000
🖨 Deal sheet 📄 Offer letter ✓ Due diligence
Multi-family units
County records classify this as Multi-Family (5+ Unit). Listing-text estimate: 4 units. estimate disagrees with records
5+ unit building — per-unit beds/baths from public records are typically unavailable; the breakdown below (if shown) is an estimate from the listing text.
Listing remarks MLS
This four-unit multifamily property offers a fantastic investment opportunity with immediate income potential. Each of the four units features a comfortable 1-bedroom, 1-bathroom layout, appealing to a wide range of tenants. All units are currently tenant-occupied, providing stable, consistent cash flow from day one. Ideally located just minutes from downtown, residents enjoy convenient access to a variety of dining, shopping, and entertainment options. The property is also situated near a major hospital and the University of Dayton. Whether you're looking to expand your portfolio or secure a turnkey investment, this property combines strong rental demand with a prime setting.
Key facts
- Tenant occupied
- Stable cash flow
- Near major hospital
Tags
Neighborhood map
What this means for you Summary
Snapshot
- This is a 4 × 1-bed/1-bath units multifamily listed at $290k.
Deal economics
- At list price, monthly cash flow is $805 ($10k/yr) — positive. Per door: $201/mo.
- The deal already cash-flows at list — no discount required.
- Meets the 1% rule at list price ($3k rent vs $290k).
- Recommended offer: $273k (6.0% below list) — sets the bar for market timing.
- Cap rate 9.6% vs local median 7.4% in Dayton — top-decile yield for the area; either an underpriced asset or a hidden risk that comps aren't pricing in. Stress-test before assuming the spread holds.
Location & tenants
- Location reads 65/100 on livability (#716 in OH) — a middle-class / working-renter tenant base. Strengths: cost of living A+, housing A+, health & safety A; Watch: schools C-, amenities C-, crime F.
- Dayton City (urban): math 12% / reading 21% proficiency, ranked #641 of 656 in OH (top 98%) — low school quality limits family demand, transient renter base, plan for 1-2y turnover; 74% free/reduced lunch — lower-income household profile, screen leases tightly.
- Market conditions: Rents rising fast (+4.3%/yr); 134 active listings in the ZIP; lower-income renter base — watch delinquency; 907 units permitted in Montgomery County in 2024 (416 in 5+ unit buildings).
- At $3,448/mo this rent would consume 94% of the median local household income ($44k/yr) (locally 1475% of renters already pay >50% of income on rent) — very limited rent-growth headroom before tenants either downsize or default.
Forward outlook
- Local home prices are declining (-3.0%/yr); year-one equity from $2k of loan paydown is wiped out by about $9k of value loss. Plan a longer hold.
- Montgomery County population projected at -10% by 2050 — secular population decline; favor cash flow + early exit over multi-decade hold.
- At projected returns (-3.0% appreciation + 4.3% rent growth), your $81k cash investment doubles in ~9 years — after that, you're playing with house money.
Negotiation context
- It's been on market 83 days — a 6% lower offer ($273k) is reasonable based on typical stale-listing flexibility.
- 9 sale attempts since 16y ago with the ask held roughly flat each time — persistent listings suggest the price (not the market) is what's stuck; bring a comps-based counter.
- Current owner paid $190k; list at $290k implies a 53% gain — meaningful room to come down on a strong offer.
Risks & watch-outs
- Watch-outs: built in 1950 — expect roof / HVAC / electrical / plumbing capex.
Questions for the listing agent
- It's been on market 83 days. Have you received any prior offers? Is the seller open to a 6% concession, seller financing, or rate buy-down credit?
- Can we see the unit-by-unit rent roll, current vacancy, and any below-market leases? What's the average tenancy length?
- What capital expenditures (roof, boiler, parking lot, exteriors) have been made in the last 5 years, and what's planned in the next 2?
- Built in 1950 — when were the roof, HVAC, electrical panel, plumbing, and water heater last replaced?
- Why hasn't it sold? Are there any deal-killer items the seller is aware of (foundation, flood, title, zoning, code violations)?
- Is there a deadline driving the sale (1031 exchange, divorce, estate, relocation)? That informs how much negotiation room exists.
- Crime grade is F in this area — have there been break-ins, vandalism, or insurance claims at this property in the last 3 years? What carrier currently insures it and at what premium?
- What's the average days-on-market for RENTAL listings here right now (not sales)? A rising rental-DOM trend means longer vacancies and softer asking-rent achievability than the comps imply.
- What's the recent tenant-quality profile in this submarket — average credit score on applications, eviction rate, late-payment / NSF rate, and stable-employment percentage? A property-management company in the area should have these aggregated.
- How much new apartment / multifamily construction is in the pipeline within 1–3 miles? Heavy new supply (>2% of stock underway) typically softens rents 12–24 months out; light construction supports rent growth.
Investment metrics
- 1% rule
- 1.19% ✓
- Cap rate
- 9.62%
- Cash-on-cash
- 11.89%
- DSCR
- 1.53
- GRM
- 7.0
CMA / ARV
- ARV (median comp)
- $230,180
- List price
- $290,000
- Delta
- 25.99%
- Verdict
- OVERPRICED
- Comps
- 20 within 1.0 mi
Projected returns pro-forma
-3.0% appreciation · 4.34% rent growth · sell at horizon
- IRR
- 2.8%
- Equity multiple
- 1.11×
- Total profit
- $8,965
- Equity at exit
- $43,240
- IRR
- 13.6%
- Equity multiple
- 2.15×
- Total profit
- $93,661
- Equity at exit
- $25,074
Cash invested: $81,200 (down + closing). Projections, not guarantees.
Landlord ↔ Tenant lean methodology
- Overall (STATE)
- 73 Landlord-Friendly
- State Ohio
- 73 Landlord-Friendly · R+6
- County
- — inherits STATE
- City
- — inherits STATE
ZIP-level market 45405
- Rents YoY
- 4.3%
- Active inventory
- 134
- Price-to-rent
- 28.0×
Monthly cashflow live
- Estimated rent
- $3,448 high interval (Pro) →
- Mortgage (P&I)
- −$1,521
- Tax from tax record
- −$278 /mo · $3,332/yr
- Insurance
- −$121
- HOA
- −$0
- Vacancy / Maint / Mgmt
- −$724
- Net cashflow
- $805
Break-even live
4-unit breakdown (identical units grouped — click to expand)
| Units | Beds | Baths | Est. rent |
|---|---|---|---|
| 4× units | 1 | 1 | $3,448 |
| #1 | 1 | 1 | $862 |
| #2 | 1 | 1 | $862 |
| #3 | 1 | 1 | $862 |
| #4 | 1 | 1 | $862 |
| Total (4 units) | $3,448 | ||
UW: 25.0% down · 7.5% · 30yr · 1.5% tax · 5.0% vac · 8.0% maint · 8.0% mgmt
Financing live
Cash to close
- Down payment
- $72,500
- Closing costs
- $8,700
- Reserves months
- —
- Total cash needed
- —
Loan-product check · same deal, 3 products live
Conventional
25% down · 7.5% · 30yr
- Down + closing
- —
- Monthly P&I
- —
- Monthly cashflow
- —
- DSCR
- —
- Eligible?
- —
Personal DTI + credit; lowest rate.
DSCR
20% down · 8.5% · 30yr
- Down + closing
- —
- Monthly P&I
- —
- Monthly cashflow
- —
- DSCR
- —
- Eligible?
- —
No personal income docs; deal must DSCR.
Hard money
10% down · 12.0% · 12mo
- Down + closing
- —
- Monthly P&I
- —
- Monthly cashflow
- —
- DSCR
- —
- Eligible?
- —
Short-term bridge; refi at stabilization.
Listing history 50 events
-
2026-06-18days on market $290,000 Active 83 DOM
-
2026-06-17days on market $290,000 Active 82 DOM
-
2026-06-16days on market $290,000 Active 81 DOM
-
2026-06-15days on market $290,000 Active 80 DOM
-
2026-06-14days on market $290,000 Active 78 DOM
-
2026-06-13days on market $290,000 Active 77 DOM
-
2026-06-10days on market $290,000 Active 75 DOM
-
2026-06-09days on market $290,000 Active 74 DOM
-
2026-06-08days on market $290,000 Active 73 DOM
-
2026-06-07days on market $290,000 Active 72 DOM
-
2026-06-05days on market $290,000 Active 69 DOM
-
2026-06-03days on market $290,000 Active 68 DOM
-
2026-06-02days on market $290,000 Active 67 DOM
-
2026-06-01days on market $290,000 Active 66 DOM
-
2026-05-31days on market $290,000 Active 65 DOM
-
2026-03-27$290,000 Active 685-char remark
Show marketing remark (685 chars)
This four-unit multifamily property offers a fantastic investment opportunity with immediate income potential. Each of the four units features a comfortable 1-bedroom, 1-bathroom layout, appealing to a wide range of tenants. All units are currently tenant-occupied, providing stable, consistent cash flow from day one. Ideally located just minutes from downtown, residents enjoy convenient access to a variety of dining, shopping, and entertainment options. The property is also situated near a major hospital and the University of Dayton. Whether you're looking to expand your portfolio or secure a turnkey investment, this property combines strong rental demand with a prime setting.
-
2025-09-23soldstatus $190,000
-
2025-09-02soldstatus $190,000 Closed 739-char remark
Show marketing remark (739 chars)
Brick 4-unit multi-family offers the perfect mix of immediate income and future upside. Each unit features 1 bedroom and 1 full bathroom, ideal for long-term tenants or short-term rental potential. Two units are currently rented, while the other two are vacant and in need of cosmetic updates to be rent-ready — allowing the new owner to quickly increase cash flow. Brand new roof in 2024. Water heaters 2017. Rent of $2700+/mo easily obtainable here. Currently professionally managed. Ample off-street parking and separate utilities, this property is a prime investment for both seasoned investors and first-time multifamily buyers. Don’t miss this chance to own a durable, income-producing property with room to build equity.
-
2025-08-19historical ActiveUnderContract 739-char remark
Show marketing remark (739 chars)
Brick 4-unit multi-family offers the perfect mix of immediate income and future upside. Each unit features 1 bedroom and 1 full bathroom, ideal for long-term tenants or short-term rental potential. Two units are currently rented, while the other two are vacant and in need of cosmetic updates to be rent-ready — allowing the new owner to quickly increase cash flow. Brand new roof in 2024. Water heaters 2017. Rent of $2700+/mo easily obtainable here. Currently professionally managed. Ample off-street parking and separate utilities, this property is a prime investment for both seasoned investors and first-time multifamily buyers. Don’t miss this chance to own a durable, income-producing property with room to build equity.
-
2025-08-01$205,490 Active 739-char remark
Show marketing remark (739 chars)
Brick 4-unit multi-family offers the perfect mix of immediate income and future upside. Each unit features 1 bedroom and 1 full bathroom, ideal for long-term tenants or short-term rental potential. Two units are currently rented, while the other two are vacant and in need of cosmetic updates to be rent-ready — allowing the new owner to quickly increase cash flow. Brand new roof in 2024. Water heaters 2017. Rent of $2700+/mo easily obtainable here. Currently professionally managed. Ample off-street parking and separate utilities, this property is a prime investment for both seasoned investors and first-time multifamily buyers. Don’t miss this chance to own a durable, income-producing property with room to build equity.
-
2025-01-14soldstatus $210,000
-
2024-12-11historical
-
2024-12-10soldstatus $210,000 Closed
-
2024-12-09status Pending
-
2024-10-23status Pending
-
2024-08-07price $228,000
-
2024-05-21$229,000 Active
-
2024-03-15historical
-
2024-01-11price $224,995
-
2023-08-15status Active
-
2023-08-08status Pending
-
2023-05-08price $214,995
-
2023-03-14price $204,000
-
2022-10-25$209,000 Active
-
2022-06-05price $575
-
2021-05-21soldstatus $110,000 Closed
-
2021-05-21soldstatus $110,000 Sold
-
2021-05-10status Pending
-
2021-05-06$110,000 Active
-
2018-03-16soldstatus $67,795 Sold
-
2018-03-16soldstatus $67,795 Closed
-
2018-03-12soldstatus $67,495
-
2018-01-02historical Active/Pending
-
2017-12-11$67,495 Active
-
2017-07-22historical
-
2017-06-19price $18,000
-
2017-05-25$20,000 Active
-
2010-07-16historical
-
2010-03-01$14,000
-
2003-09-02soldstatus $80,000
ⓘ Source: listings_history table (triggers on properties + properties_extension) + one-shot
backfill from property_details.listing_events for pre-trigger history.
Tax reassessment forecast OH · Partial reset (capped growth)
- Current annual tax
- $3,332 · $278/mo
- Projected year-2 tax
- $3,928 · $327/mo
- Expected delta
- +$596/yr (+$50/mo · 17.9%)
ⓘ Screening estimate from a state-policy table — verify with the county assessor before closing.
Climate risk First Street
- Flood 1/10 Low FEMA zone X (unshaded) · 0% chance over 30 yrs
- Wildfire 1/10 Low
- Heat 3/10 Moderate 7 d/yr ≥104°F today · 18 d/yr by 30 yrs out
- Wind 2/10 Low
- Air quality 3/10 Moderate 2 unhealthy d/yr today · 4 by 30 yrs out
Nearby sold comps map
Loading sold comps map…
Walkable amenities ~0.75 mi
Loading nearby amenities…
Taxation est. · year 1
- Rental income
- $41,376
- − Mortgage interest
- −$16,245
- − Property taxes
- −$3,332
- − Insurance
- −$1,450
- − Repairs & maintenance
- −$3,310
- − Management
- −$3,310
- − Depreciation
- −$8,436
- Taxable income
- $5,293
- Est. tax owed @ 24.0%
- −$1,270
- After-tax cash flow
- $8,385/yr
For passive investors: Depreciation is non-cash, so a rental often shows a tax loss while cash-flowing — sheltering income. Rental losses are passive: they offset passive income freely, and up to $25,000/yr can offset ordinary (W-2) income if you actively participate and your MAGI is under $100k (phasing out to $0 by $150k); unused losses carry forward. On sale, claimed depreciation is recaptured at up to 25%, and gains may owe capital-gains tax (a 1031 exchange can defer both). Figures are a year-1 estimate at your 24.0% rate — not tax advice; consult a CPA.
Schools (NCES district)
- District
- Dayton City
- NCES district ID
- 3904384
- Math proficiency
- 12% ▼ -12.00%
- Reading proficiency
- 21% ▼ -11.00%
- Median HH income
- $28,688
- Composite
- 12.94/100
- National rank
- #9579
- State rank
- #641 of 656 in OH
Livability — Dayton
- Score
- 65/100
- State rank
- #716
- US rank
- #12895
Category grades
Schools grade is shown separately in the Schools card above.
Census & demographics
- Census place
- Dayton, OH
- County
- Montgomery County · 459,541 people
- City population
- 164,387
- Metro
- Dayton-Kettering, OH
- Population (ZIP)
- 18,955
- Household income
- $43,973
- Rent vs Own
- Severe rent burden
- 1475.0
Population outlook (Montgomery County) Hauer SSP2
- Today (2025)
- 523,241 people
- By 2030
- 514,948 · -1.6%
- By 2040
- 493,378 · -5.7%
- By 2050
- 469,639 · -10.2%
- By 2075
- 418,360 · -20.0%
- By 2100
- 353,315 · -32.5%
Race, ethnicity, and origin ACS 2023
- Neighborhood character
- Predominantly Black (68%)
- Race & ethnicity
- Black 68% White 23% Two or more races 7% Hispanic / Latino 3%
- Common ancestry
- Italian 1% Slovak 1%
- Foreign-born
- 3% · Canada
- Languages at home
- 95% English-only · Spanish 2% French/Haitian/Cajun 1%
Political lean MEDSL · Montgomery
- 2024 margin
- Toss-up / Even · D 49.8% · R 49.3%
- 2008→2024 swing
- -5.8pp toward R · 2008: 6.2pp · 2024: 0.5pp
- All cycles
- 2024: D+0.5 2020: D+2.2 2016: R+1.2 2012: D+3.1 2008: D+6.2
Not yet ingested
- Civics
- —
Market trends
- HPI YoY
- ▼ -125.58%
- Current HPI
- 173.4962
- Rent YoY
- ▲ 4.34%
- Metro
- Dayton-Kettering, OH
- State GDP YoY
- ▲ 1.98%
- F500 in state
- 48
Industry mix (Fortune 500 HQ in OH)
| Industry | F500 HQs | Revenue |
|---|---|---|
| Insurance | 3 | $145B |
|
||
| Industrial Machinery | 3 | $49B |
|
||
| Financial Services | 3 | $24B |
|
||
| Consumer Goods | 2 | $93B |
|
||
| Aerospace / Defense | 2 | $47B |
|
||
| Utilities | 2 | $33B |
|
||
Price history
+491.8% since first listed39 events — show timeline
- 2026-03-27 Listed $290,000 Dayton MLS
- 2025-09-23 Sold (Public Records) $190,000 Public Records
- 2025-09-02 Sold (MLS) $190,000 Dayton MLS
- 2025-08-19 Contingent — Dayton MLS
- 2025-08-01 Listed $205,490 Dayton MLS
- 2025-01-14 Sold (Public Records) $210,000 Public Records
- 2024-12-11 Listing Removed — Dayton MLS
- 2024-12-10 Sold (MLS) $210,000 Dayton MLS
- 2024-12-09 Pending — Dayton MLS
- 2024-10-23 Pending — Dayton MLS
- 2024-08-07 Price Changed $228,000 Dayton MLS
- 2024-05-21 Listed $229,000 Dayton MLS
- 2024-03-15 Listing Removed — Dayton MLS
- 2024-01-11 Price Changed $224,995 Dayton MLS
- 2023-08-15 Relisted — Dayton MLS
- 2023-08-08 Pending — Dayton MLS
- 2023-05-08 Price Changed $214,995 Dayton MLS
- 2023-03-14 Price Changed $204,000 Dayton MLS
- 2022-10-25 Listed $209,000 Dayton MLS
- 2022-06-05 Price Changed $575 RENT.
- 2021-05-21 Sold (MLS) $110,000 Dayton MLS
- 2021-05-21 Sold (MLS) $110,000 Dayton MLS
- 2021-05-10 Pending — Dayton MLS
- 2021-05-06 Listed $110,000 Dayton MLS
- 2018-03-16 Sold (MLS) $67,795 Dayton MLS
- 2018-03-16 Sold (MLS) $67,795 Dayton MLS
- 2018-03-12 Sold (Public Records) $67,495 Public Records
- 2018-01-02 Contingent — Dayton MLS
- 2017-12-11 Listed $67,495 Dayton MLS
- 2017-07-22 Listing Removed — Dayton MLS
- 2017-06-19 Price Changed $18,000 Dayton MLS
- 2017-05-25 Listed $20,000 Dayton MLS
- 2010-07-16 Listing Removed — Dayton MLS
- 2010-03-01 Listed $14,000 Dayton MLS
- 2003-09-02 Sold (Public Records) $80,000 Public Records
- 2000-05-05 Sold (Public Records) $55,000 Public Records
- 1998-02-13 Sold (Public Records) $55,000 Public Records
- 1993-08-17 Sold (Public Records) $58,900 Public Records
- 1987-12-29 Sold (Public Records) $49,000 Public Records
Property tax history
+10.4%/yrLatest (2025): $3,332 · -1.0% YoY. Source: county tax records.
Cash-flow waterfall
monthlySold comps — $/sqft
last 12 mo · ≤1 miLoading sold comps…