 Multi-family
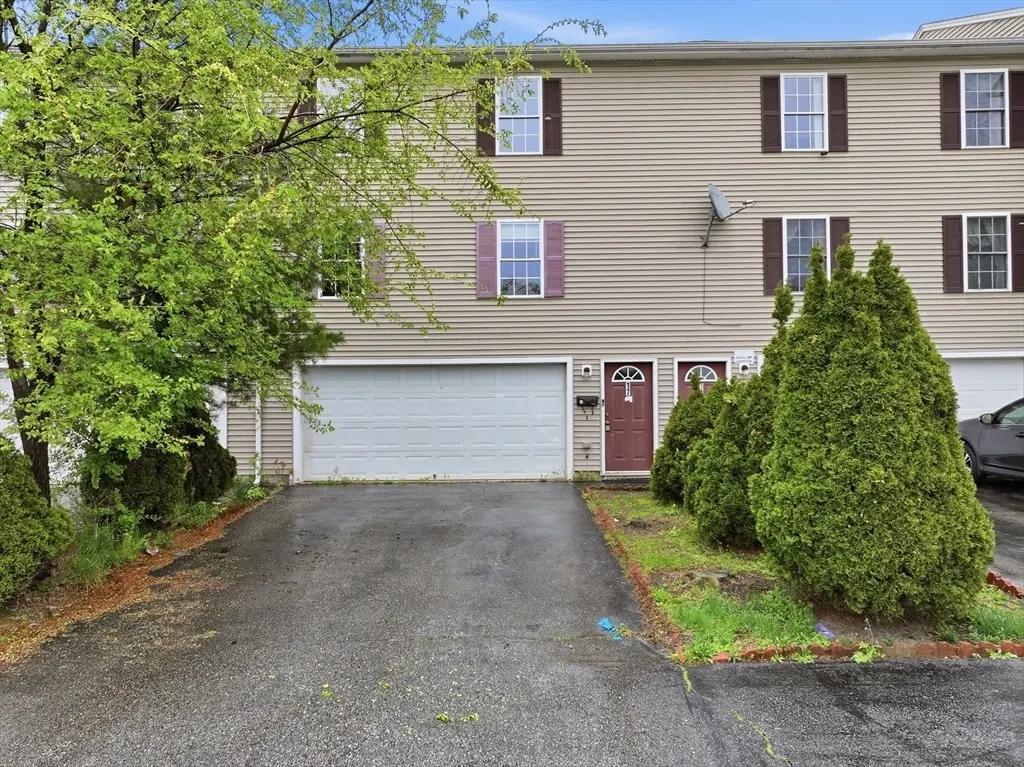
17 Bigelow St · Worcester, MA
Flood risk 5/10 · Moderate
- FEMA flood zone
- AE
- Chance of flooding over 30 yrs
- 0.52%
- Est. flood insurance / yr
- $2,026 – $9,024
Fire risk 1/10 · Minimal
- Est. fire insurance / yr
- $915 – $1,699
Heat risk 4/10 · Minor
- Hot days now (above 93°F)
- 7 days/yr
- Hot days in 30 yrs
- 17 days/yr
Wind risk 6/10 · Moderate
- Chance of severe wind over 30 yrs
- 27.0%
Air-quality risk 2/10 · Minimal
- Unhealthy air days now
- 1 days/yr
- Unhealthy air days in 30 yrs
- 2 days/yr
Risk factors via First Street. Map © Google.
Why this score? — see what drove the F grade
The composite is a weighted blend of 9 inputs, each scored 0–100. Each bar is that input's sub-score; the figure is the points it added to the 100-point composite (weight × sub-score).
- Cash flow +6.4/30.0
- Appreciation +4.6/10.0
- Livability +4.4/5.0
- ARV discount +3.5/15.0
- Condition / age +2.5/5.0
- Schools +2.0/10.0
- Rent growth +1.9/5.0
- 1% rule +0.9/10.0
- DSCR +0.7/10.0
$384,900
🖨 Deal sheet 📄 Offer letter ✓ Due diligence
Multi-family units
County records classify this as Multi-Family (2-4 Unit). Listing-text estimate: 1 unit. estimate disagrees with records
Listing remarks MLS
UNDER CONSTRUCTION, 99% COMPLETE, TAX RATE 16.16 PER 1000 FOR FY JUL02-JUN03. PREVIOUS VALUATION 52900 X 16.16 = 854 200 YDS TO CROMPTON PARK, 1/2 MILE TO 290. 2 MILES TO 146. 1 MILE TO UNION STATION.
Key facts
- 2,305 sq ft lot
- 2 garage spots
- Built 2003
Property features AI
Finance
- Other: Lot size approximately 0.05 acres; Public road frontage
- HOA & community: Not a senior community; Nearby community features: public transportation, medical facility, laundromat, highway access, public school, university
Exterior
- Parking: Attached garage with 2 garage spaces; Two covered parking spaces; Two open/off-street parking spaces (4 total spaces)
- Utilities: Public water; Public sewer; 110 volt electric
- Home design: Single family residence; Multi/split levels; Property is attached
- Construction: Shingle roof; Concrete perimeter foundation; Built year from public records (actual year not specified)
- Exterior features: Wood deck; Zero lot line
Interior
- Kitchen: Range; Refrigerator
- Bedrooms: Bedrooms included (number not specified)
- Bathrooms: One full bathroom; One half bathroom
- Heating & cooling: Baseboard heating; Cooling system (type listed as 'Other')
- Interior features: Five total rooms; Full basement
- Laundry & utility: Washer/dryer details not specified
Neighborhood map
What this means for you Summary
Snapshot
- This is a 3-bed/1.5-bath multifamily listed at $385k.
Deal economics
- At list price, monthly cash flow is $-1k ($-14k/yr) — negative.
- To cash-flow at today's rent, offer at most $186k (51.7% below list).
- To meet the 1% rule (rent ≥ 1% of price), the offer needs to be $229k (40.5% below list).
- Recommended offer: $186k (51.7% below list) — sets the bar for cash-flow.
Location & tenants
- Location reads 87/100 on livability (#9 in MA, #312 nationally) — a professional / high-income tenant draw. Strengths: crime A+, amenities A+, commute A+; Watch: schools C-, cost of living D.
- Worcester (urban): math 17% / reading 30% proficiency, ranked #280 of 302 in MA (top 93%) — low school quality limits family demand, transient renter base, plan for 1-2y turnover; 66% free/reduced lunch — lower-income household profile, screen leases tightly.
- Market conditions: Rents soft (-2.2%/yr); 25 active listings in the ZIP; 40 comparable units currently listed for rent nearby; rentals lingering (median 44d on market — plan ~5-8 weeks vacancy on turnover, expect pricing pressure); 50% of comp listings sitting > 30 days — soft ceiling on asking rent; 2,293 units permitted in Worcester County in 2024 (1,205 in 5+ unit buildings).
- At $2,290/mo this rent would consume 53% of the median local household income ($51k/yr) (locally 2517% of renters already pay >50% of income on rent) — very limited rent-growth headroom before tenants either downsize or default.
Forward outlook
- Local home prices are declining (-0.7%/yr); year-one equity from $3k of loan paydown is wiped out by about $3k of value loss. Plan a longer hold.
Negotiation context
- It's been on market 44 days — a 3% lower offer ($373k) is reasonable based on typical stale-listing flexibility.
- 2 sale attempts since 23y ago with the ask held roughly flat each time — persistent listings suggest the price (not the market) is what's stuck; bring a comps-based counter.
- Current owner paid $160k; list at $385k implies a 141% gain — meaningful room to come down on a strong offer.
Risks & watch-outs
- Watch-outs: flood insurance adds $460/mo.
- Climate carrying-cost: in FEMA flood zone AE (mandatory federal flood insurance); major wind risk, 27% chance of damaging wind over 30y — expect insurance premiums to compound above CPI over the hold.
Questions for the listing agent
- What do current leases actually rent for vs. the listed asking? Can we see a recent rent roll and the last 12 months of T-12 income?
- It's been on market 44 days. Have you received any prior offers? Is the seller open to a 52% concession, seller financing, or rate buy-down credit?
- What's the actual annual flood-insurance premium (NFIP or private), and is the property in a SFHA with mandatory coverage?
- Is there a deadline driving the sale (1031 exchange, divorce, estate, relocation)? That informs how much negotiation room exists.
- The area grade is low — what's the realistic commute time and amenity access for the typical tenant pool here? Any planned neighborhood developments (good or bad) we should know about?
- What's the average days-on-market for RENTAL listings here right now (not sales)? A rising rental-DOM trend means longer vacancies and softer asking-rent achievability than the comps imply.
- What's the recent tenant-quality profile in this submarket — average credit score on applications, eviction rate, late-payment / NSF rate, and stable-employment percentage? A property-management company in the area should have these aggregated.
- How much new apartment / multifamily construction is in the pipeline within 1–3 miles? Heavy new supply (>2% of stock underway) typically softens rents 12–24 months out; light construction supports rent growth.
Investment metrics
- 1% rule
- 0.59% ✗
- Cap rate
- 4.22%
- Cash-on-cash
- -7.42%
- DSCR
- 0.67
- GRM
- 14.0
CMA / ARV
- ARV (median comp)
- $353,696
- List price
- $384,900
- Delta
- 8.82%
- Verdict
- FAIR
- Comps
- 20 within 1.0 mi
Projected returns pro-forma
-0.73% appreciation · 0.0% rent growth · sell at horizon
- IRR
- -22.5%
- Equity multiple
- 0.05×
- Total profit
- $-102,461
- Equity at exit
- $97,987
- IRR
- -18.6%
- Equity multiple
- -0.58×
- Total profit
- $-170,374
- Equity at exit
- $107,285
Cash invested: $107,772 (down + closing). Projections, not guarantees.
Landlord ↔ Tenant lean methodology
- Overall (STATE)
- 20 Strongly Tenant-Friendly
- State Massachusetts
- 20 Strongly Tenant-Friendly · D+15
- County
- — inherits STATE
- City
- — inherits STATE
ZIP-level market 01610
- Home prices YoY
- -0.1%
- Rents YoY
- -2.2%
- Active inventory
- 25
- Price-to-rent
- 14.0×
Monthly cashflow live
- Estimated rent
- $2,290 high interval (Pro) →
- Mortgage (P&I)
- −$2,018
- Tax from tax record
- −$296 /mo · $3,553/yr
- Insurance
- −$160
- Flood insurance flood zone
- −$460 /mo · $5,525/yr
- HOA
- −$0
- Vacancy / Maint / Mgmt
- −$481
- Net cashflow
- $-1,126
Break-even live
UW: 25.0% down · 7.5% · 30yr · 1.5% tax · 5.0% vac · 8.0% maint · 8.0% mgmt
Financing live
Cash to close
- Down payment
- $96,225
- Closing costs
- $11,547
- Reserves months
- —
- Total cash needed
- —
Loan-product check · same deal, 3 products live
Conventional
25% down · 7.5% · 30yr
- Down + closing
- —
- Monthly P&I
- —
- Monthly cashflow
- —
- DSCR
- —
- Eligible?
- —
Personal DTI + credit; lowest rate.
DSCR
20% down · 8.5% · 30yr
- Down + closing
- —
- Monthly P&I
- —
- Monthly cashflow
- —
- DSCR
- —
- Eligible?
- —
No personal income docs; deal must DSCR.
Hard money
10% down · 12.0% · 12mo
- Down + closing
- —
- Monthly P&I
- —
- Monthly cashflow
- —
- DSCR
- —
- Eligible?
- —
Short-term bridge; refi at stabilization.
Rent comps 40 comps
| Address | Beds | Baths | Sqft | Rent | $/sqft | DOM | Units | Dist |
|---|---|---|---|---|---|---|---|---|
| 19 Endicott St Unit 3 Worcester, MA | 3.0 | 1.0 | 1134 | $2,200 | $1.94 | 43d | 1 | 0.13mi |
| 177 Washington St #3 Worcester, MA | 3.0 | 1.0 | 1200 | $1,950 | $1.62 | 43d | 1 | 0.13mi |
| 1 Green Island Blvd Worcester, MA | 3.0 | 1.0–2.0 | 904 | $3,731 | $4.13 | 14d | 27 | 0.24mi |
| 23 Millbury St Unit 25 Worcester, MA | 3.0 | 1.0 | 1225 | $1,895 | $1.55 | 23d | 1 | 0.25mi |
| 23 Millbury St Unit 25 Worcester, MA | 3.0 | 1.0 | 1225 | $1,895 | $1.55 | 43d | 1 | 0.25mi |
| 20 Perry Ave Unit 2 Worcester, MA | 2.0 | 1.0 | 950 | $1,695 | $1.78 | 14d | 1 | 0.26mi |
| 24 Suffield St Apt 3 Worcester, MA | 3.0 | 1.0 | 1450 | $2,450 | $1.69 | 23d | 1 | 0.30mi |
| 91 Ward St Unit 1 Worcester, MA | 3.0 | 2.0 | 1200 | $2,350 | $1.96 | 19d | 1 | 0.32mi |
| 5 Sterling St Apt 1 Worcester, MA | 3.0 | 1.0 | 900 | $2,200 | $2.44 | 23d | 1 | 0.34mi |
| 70 Seymour St Unit 2 Worcester, MA | 4.0 | 1.0 | 1500 | $2,550 | $1.70 | 43d | 1 | 0.35mi |
| 70 Seymour St Unit 1 Worcester, MA | 4.0 | 1.0 | 1500 | $2,600 | $1.73 | 43d | 1 | 0.35mi |
| 42 Dorchester St Unit 3 Worcester, MA | 4.0 | 1.0 | 1200 | $2,300 | $1.92 | 43d | 1 | 0.36mi |
| 11 Pattison St Unit 2 Worcester, MA | 3.0 | 1.0 | 1000 | $2,100 | $2.10 | 14d | 1 | 0.37mi |
| 91 Perry Ave Unit 3 Worcester, MA | 3.0 | 1.0 | 1203 | $2,000 | $1.66 | 43d | 1 | 0.37mi |
| 4 Vernon Ter Unit 2 Worcester, MA | 3.0 | 1.0 | 1200 | $2,000 | $1.67 | 43d | 1 | 0.39mi |
| 16 Hillside St Worcester, MA | 3.0 | 1.0 | 1200 | $2,200 | $1.83 | 21d | 1 | 0.41mi |
| 21 Sycamore St Unit 7 Worcester, MA | 3.0 | 1.0 | 875 | $1,725 | $1.97 | 43d | 1 | 0.42mi |
| 7 Hillside St Unit 3 Worcester, MA | 3.0 | 1.0 | 1500 | $2,100 | $1.40 | 43d | 1 | 0.42mi |
| 39 Harlem St Unit 3 Worcester, MA | 4.0 | 1.0 | 1332 | $2,300 | $1.73 | 43d | 1 | 0.45mi |
| 29 Arlington St Unit 2 Worcester, MA | 3.0 | 1.0 | 1850 | $2,500 | $1.35 | 43d | 1 | 0.45mi |
| 51 Arlington St Worcester, MA | 4.0 | 1.0 | 1400 | $2,350 | $1.68 | 43d | 1 | 0.45mi |
| 85 Green St Worcester, MA | 2.0 | 1.0–2.0 | 719 | $4,400 | $6.12 | 14d | 22 | 0.46mi |
| 48 Windham St Unit 3 Worcester, MA | 3.0 | 1.0 | 1391 | $1,950 | $1.40 | 43d | 1 | 0.46mi |
| 2 Hillside St Apt 3 Worcester, MA | 3.0 | 1.0 | 1305 | $1,998 | $1.53 | 21d | 1 | 0.46mi |
| 17 Hermon St Worcester, MA | 2.0 | 1.0–2.0 | 752 | $2,800 | $3.72 | 21d | 11 | 0.47mi |
| 8 S Harlem St Unit 3 Worcester, MA | 2.0 | 1.0 | 1100 | $1,850 | $1.68 | 43d | 1 | 0.48mi |
| 5 Madison St Worcester, MA | 2.0 | 1.0–2.0 | 811 | $3,720 | $4.59 | 23d | 1 | 0.49mi |
| 8 Euclid Ave Unit 1 Worcester, MA | 3.0 | 1.0 | 1050 | $1,800 | $1.71 | 23d | 1 | 0.50mi |
| 101 Providence St Unit 2nd Floor Worcester, MA | 3.0 | 1.0 | 1450 | $2,200 | $1.52 | 23d | 1 | 0.51mi |
| 48 Providence St Unit 1 Worcester, MA | 4.0 | 1.0 | 1600 | $2,800 | $1.75 | 43d | 1 | 0.51mi |
| 118 Vernon St Unit 2F Worcester, MA | 2.0 | 1.0 | 1250 | $1,900 | $1.52 | 43d | 1 | 0.51mi |
| 61 Providence St Unit 2 Worcester, MA | 4.0 | 2.0 | 1600 | $2,800 | $1.75 | 14d | 1 | 0.52mi |
| 21 Washburn St Unit A Worcester, MA | 3.0 | 2.0 | 1600 | $3,000 | $1.88 | 43d | 1 | 0.53mi |
| 14 Benefit Ter Unit 2 Worcester, MA | 4.0 | 1.0 | 1200 | $2,400 | $2.00 | 21d | 1 | 0.54mi |
| 23 Windham St Unit 1 Worcester, MA | 3.0 | 2.0 | 1353 | $2,350 | $1.74 | 23d | 1 | 0.54mi |
| 5 Mount Pleasant St Unit 3 Worcester, MA | 3.0 | 1.0 | 1422 | $2,200 | $1.55 | 14d | 1 | 0.55mi |
| 5 Mount Pleasant St Apt 2 Worcester, MA | 3.0 | 1.0 | 1422 | $2,500 | $1.76 | 43d | 1 | 0.55mi |
| 125 Vernon St Unit C Worcester, MA | 4.0 | 1.0 | 1200 | $2,700 | $2.25 | 14d | 1 | 0.56mi |
| 600 Main St Worcester, MA | 1.0–2.0 | 1.0 | 766 | $1,951 | $2.55 | 14d | 17 | 0.59mi |
| 2 Benefit St Unit 2 Worcester, MA | 2.0 | 1.0 | 900 | $1,850 | $2.06 | 43d | 1 | 0.60mi |
Listing history 19 events
-
2026-06-18days on market $384,900 Active 44 DOM
-
2026-06-17days on market $384,900 Active 43 DOM
-
2026-06-16days on market $384,900 Active 42 DOM
-
2026-06-15days on market $384,900 Active 41 DOM
-
2026-06-14days on market $384,900 Active 39 DOM
-
2026-06-10days on market $384,900 Active 36 DOM
-
2026-06-09days on market $384,900 Active 35 DOM
-
2026-06-08days on market $384,900 Active 34 DOM
-
2026-06-07days on market $384,900 Active 33 DOM
-
2026-06-05days on market $384,900 Active 30 DOM
-
2026-06-03days on market $384,900 Active 29 DOM
-
2026-06-02days on market $384,900 Active 28 DOM
-
2026-06-01days on market $384,900 Active 27 DOM
-
2026-05-31statusdays on market $384,900 Active 26 DOM
-
2026-05-31days on market $384,900 Price Changed 25 DOM
-
2026-05-05$394,000 New 588-char remark
-
2003-07-28soldstatus $159,900 202-char remark
Show marketing remark (202 chars)
UNDER CONSTRUCTION, 99% COMPLETE, TAX RATE 16.16 PER 1000 FOR FY JUL02-JUN03. PREVIOUS VALUATION 52900 X 16.16 = 854 200 YDS TO CROMPTON PARK, 1/2 MILE TO 290. 2 MILES TO 146. 1 MILE TO UNION STATION.
-
2003-06-05historical 202-char remark
Show marketing remark (202 chars)
UNDER CONSTRUCTION, 99% COMPLETE, TAX RATE 16.16 PER 1000 FOR FY JUL02-JUN03. PREVIOUS VALUATION 52900 X 16.16 = 854 200 YDS TO CROMPTON PARK, 1/2 MILE TO 290. 2 MILES TO 146. 1 MILE TO UNION STATION.
-
2003-05-30$159,900 202-char remark
Show marketing remark (202 chars)
UNDER CONSTRUCTION, 99% COMPLETE, TAX RATE 16.16 PER 1000 FOR FY JUL02-JUN03. PREVIOUS VALUATION 52900 X 16.16 = 854 200 YDS TO CROMPTON PARK, 1/2 MILE TO 290. 2 MILES TO 146. 1 MILE TO UNION STATION.
ⓘ Source: listings_history table (triggers on properties + properties_extension) + one-shot
backfill from property_details.listing_events for pre-trigger history.
Tax reassessment forecast MA · Partial reset (capped growth)
- Current annual tax
- $3,553 · $296/mo
- Projected year-2 tax
- $4,144 · $345/mo
- Expected delta
- +$591/yr (+$49/mo · 16.6%)
ⓘ Screening estimate from a state-policy table — verify with the county assessor before closing.
Climate risk First Street
- Flood 5/10 Major FEMA zone AE · 52% chance over 30 yrs
- Wildfire 1/10 Low
- Heat 4/10 Moderate 7 d/yr ≥93°F today · 17 d/yr by 30 yrs out
- Wind 6/10 Major 27% chance of damaging wind over 30 yrs
- Air quality 2/10 Low 1 unhealthy d/yr today · 2 by 30 yrs out
Nearby sold comps map
Loading sold comps map…
Walkable amenities ~0.75 mi
Loading nearby amenities…
Taxation est. · year 1
- Rental income
- $27,476
- − Mortgage interest
- −$21,560
- − Property taxes
- −$3,553
- − Insurance
- −$7,450
- − Repairs & maintenance
- −$2,198
- − Management
- −$2,198
- − Depreciation
- −$11,197
- Taxable loss
- −$20,680
- Est. tax savings @ 24.0%
- +$4,963
- After-tax cash flow
- $-8,555/yr
For passive investors: Depreciation is non-cash, so a rental often shows a tax loss while cash-flowing — sheltering income. Rental losses are passive: they offset passive income freely, and up to $25,000/yr can offset ordinary (W-2) income if you actively participate and your MAGI is under $100k (phasing out to $0 by $150k); unused losses carry forward. On sale, claimed depreciation is recaptured at up to 25%, and gains may owe capital-gains tax (a 1031 exchange can defer both). Figures are a year-1 estimate at your 24.0% rate — not tax advice; consult a CPA.
Schools (NCES district)
- District
- Worcester
- NCES district ID
- 2513230
- Math proficiency
- 17% ▼ -15.00%
- Reading proficiency
- 30% ▼ -8.00%
- Median HH income
- $45,063
- Composite
- 20.3/100
- National rank
- #8615
- State rank
- #280 of 302 in MA
Livability — Worcester
- Score
- 87/100
- State rank
- #9
- US rank
- #312
Category grades
Schools grade is shown separately in the Schools card above.
Census & demographics
- Census place
- Worcester, MA
- County
- Worcester County · 487,911 people
- City population
- 207,324
- Metro
- Worcester, MA-CT
- Population (ZIP)
- 30,444
- Household income
- $51,472
- Rent vs Own
- Severe rent burden
- 2517.0
Population outlook (Worcester County) Hauer SSP2
- Today (2025)
- 850,858 people
- By 2030
- 860,403 · +1.1%
- By 2040
- 869,902 · +2.2%
- By 2050
- 869,110 · +2.1%
- By 2075
- 870,120 · +2.3%
- By 2100
- 829,703 · -2.5%
Race, ethnicity, and origin ACS 2023
- Neighborhood character
- Diverse neighborhood (Simpson 0.69)
- Race & ethnicity
- Hispanic / Latino 42% White 34% Two or more races 21% Black 13% Asian 6%
- Hispanic origin (detail)
- Mexican 1% Puerto Rican 21% Dominican 8%
- Common ancestry
- Romanian 4% Lithuanian 3% Hispanic 2%
- Foreign-born
- 27% · Canada, Vietnam, China
- Languages at home
- 48% English-only · Spanish 35% Other Indo-European 4% Vietnamese 2%
Political lean MEDSL · Worcester
- 2024 margin
- D (+10.0) · D 53.9% · R 43.9% · Other 2.2%
- 2008→2024 swing
- -3.8pp toward R · 2008: 13.8pp · 2024: 10.0pp
- All cycles
- 2024: D+10.0 2020: D+17.8 2016: D+10.5 2012: D+9.2 2008: D+13.8
Not yet ingested
- Civics
- —
Market trends
- HPI YoY
- ▼ -0.73%
- Current HPI
- 485.4378
- Rent YoY
- ▼ -2.22%
- Metro
- Worcester, MA-CT
- State GDP YoY
- ▲ 2.28%
- F500 in state
- 38
Industry mix (Fortune 500 HQ in MA)
| Industry | F500 HQs | Revenue |
|---|---|---|
| Technology | 3 | $17B |
|
||
| Insurance | 2 | $84B |
|
||
| Retail | 2 | $76B |
|
||
| Life Sciences | 1 | $43B |
|
||
| Energy Technology | 1 | $31B |
|
||
| Aerospace / Defense | 1 | $18B |
|
||
Price history
+140.7% since first listed5 events — show timeline
- 2026-05-27 Price Changed $384,900 MLS PIN
- 2026-05-05 Listed $394,000 MLS PIN
- 2003-07-28 Sold (MLS) $159,900 MLS PIN
- 2003-06-05 Listing Removed — MLS PIN
- 2003-05-30 Listed $159,900 MLS PIN
Property tax history
+3.3%/yrLatest (2023): $3,553 · +10.0% YoY. Source: county tax records.
Cash-flow waterfall
monthlySold comps — $/sqft
last 12 mo · ≤1 miLoading sold comps…