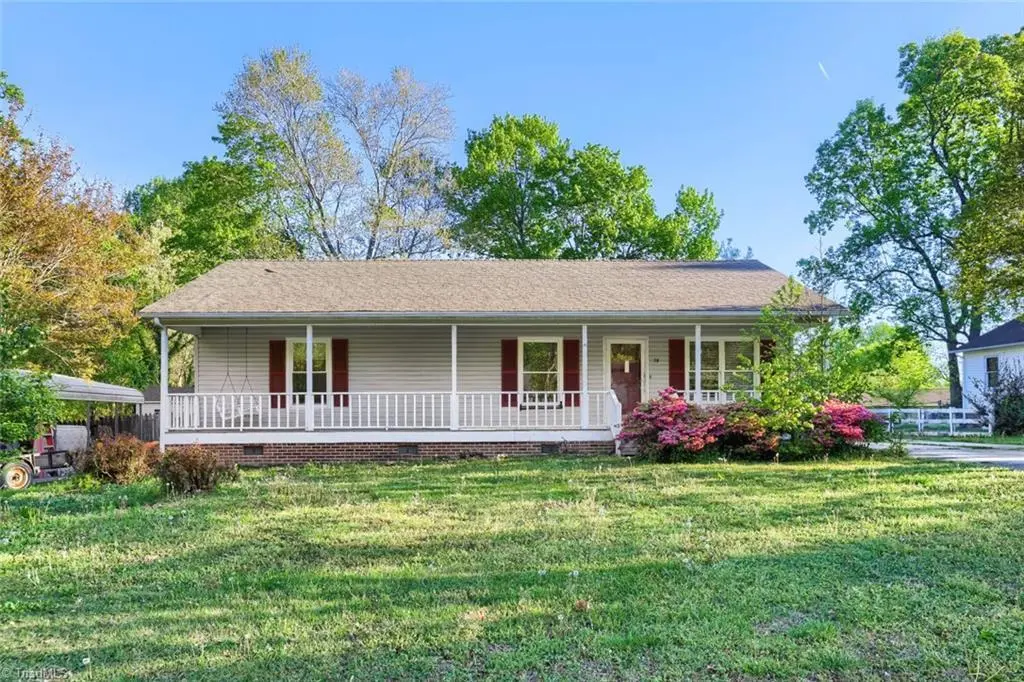
78 Lowery Dr · Thomasville, NC
Flood risk 1/10 · Minimal
- FEMA flood zone
- X (unshaded)
- Chance of flooding over 30 yrs
- 0.0%
- Est. flood insurance / yr
- $507 – $1,088
Fire risk 1/10 · Minimal
- Est. fire insurance / yr
- $906 – $1,684
Heat risk 5/10 · Moderate
- Hot days now (above 103°F)
- 7 days/yr
- Hot days in 30 yrs
- 17 days/yr
Wind risk 4/10 · Minor
- Chance of severe wind over 30 yrs
- 15.0%
Air-quality risk 2/10 · Minimal
- Unhealthy air days now
- 1 days/yr
- Unhealthy air days in 30 yrs
- 1 days/yr
Risk factors via First Street. Map © Google.
Why this score? — see what drove the D+ grade
The composite is a weighted blend of 9 inputs, each scored 0–100. Each bar is that input's sub-score; the figure is the points it added to the 100-point composite (weight × sub-score).
- ARV discount +15.0/15.0
- Cash flow +12.0/30.0
- Schools +4.3/10.0
- Livability +4.0/5.0
- Rent growth +3.6/5.0
- DSCR +3.5/10.0
- 1% rule +2.8/10.0
- Condition / age +2.5/5.0
- Appreciation +0.0/10.0
$165,000
🖨 Deal sheet (PDF) 📄 Offer letter ✓ Due diligence
Listing remarks MLS
Kitchen dining combo with ex/large island, ceramic tile, back splash and granite counter tops. Cathedral ceiling and new deck. Updated heat pump. Very large country front porch. A Super bargain!
Key facts
- Ample counter space
- Space for relaxing
- Natural light
Tags
Property features AI
Finance
- HOA & community: No homeowners association
Exterior
- Parking: Driveway
- Utilities: Public sewer; Unknown water heater
- Home design: Single-story house; Stick/site-built residential property; Built in 1989; Located on a publicly maintained road; Subdivision: Village Woods
- Construction: Vinyl siding construction
- Exterior features: Public water supply; No pool
Interior
- Kitchen: Kitchen on the main level
- Bedrooms: All bedrooms on the main level
- Bathrooms: 2 full bathrooms
- Heating & cooling: Central air conditioning; Electric forced-air heating
- Interior features: Primary bedroom on the main level; Crawl space basement
Neighborhood map
What this means for you Summary
Snapshot
- This is a 3-bed/2.0-bath single-family listed at $165k.
Deal economics
- At list price, monthly cash flow is $-41 ($-488/yr) — negative.
- To cash-flow at today's rent, offer at most $158k (4.4% below list).
- To meet the 1% rule (rent ≥ 1% of price), the offer needs to be $129k (21.8% below list).
- Recommended offer: $129k (21.8% below list) — sets the bar for 1% rule.
- Cap rate 6.0% vs local median 3.1% in Thomasville — top-decile yield for the area; either an underpriced asset or a hidden risk that comps aren't pricing in. Stress-test before assuming the spread holds.
Location & tenants
- Location reads 81/100 on livability (#16 in NC, #1,454 nationally) — a professional / high-income tenant draw. Strengths: commute A+, cost of living A+, housing A+; Watch: crime D+, schools F, employment F.
- Davidson County Schools (rural): math 50% / reading 50% proficiency, ranked #62 of 178 in NC (top 35%) — acceptable for families but not a draw, mixed tenant base, ~2y average lease.
- Market conditions: Rents rising fast (+4.3%/yr); 307 active listings in the ZIP; 8 comparable units currently listed for rent nearby; rentals at typical pace (median 22d on market — plan ~3-4 weeks tenant-placement turnaround); 990 units permitted in Davidson County in 2024 (54 in 5+ unit buildings).
Forward outlook
- Local home prices are declining (-3.0%/yr); year-one equity from $1k of loan paydown is wiped out by about $5k of value loss. Plan a longer hold.
- Davidson County population projected to shrink 6% by 2050 — rents likely to lag national; underwrite the cash flow, not the appreciation.
Negotiation context
- Only 6 days on market — expect competitive offers; lowballing is unlikely to land.
- 2 sale attempts since 5y ago with the ask held roughly flat each time — persistent listings suggest the price (not the market) is what's stuck; bring a comps-based counter.
Risks & watch-outs
- Climate carrying-cost: extreme-heat days projected 7→17/yr by 2055 (HVAC capex compounding) — expect insurance premiums to compound above CPI over the hold.
Questions for the listing agent
- What do current leases actually rent for vs. the listed asking? Can we see a recent rent roll and the last 12 months of T-12 income?
- Is there a deadline driving the sale (1031 exchange, divorce, estate, relocation)? That informs how much negotiation room exists.
- Schools are F-rated, which usually means shorter tenancies and higher turnover. Who's the typical renter profile here, and what's been the actual vacancy rate?
- Crime grade is D in this area — have there been break-ins, vandalism, or insurance claims at this property in the last 3 years? What carrier currently insures it and at what premium?
- The area grade is low — what's the realistic commute time and amenity access for the typical tenant pool here? Any planned neighborhood developments (good or bad) we should know about?
- What's the average days-on-market for RENTAL listings here right now (not sales)? A rising rental-DOM trend means longer vacancies and softer asking-rent achievability than the comps imply.
- What's the recent tenant-quality profile in this submarket — average credit score on applications, eviction rate, late-payment / NSF rate, and stable-employment percentage? A property-management company in the area should have these aggregated.
- How much new for-sale + rental construction is in the pipeline within 1–3 miles? Heavy new supply typically softens prices + rents 12–24 months out; constrained supply supports both.
Investment metrics
- 1% rule
- 0.78% ✗
- Cap rate
- 6.00%
- Cash-on-cash
- -1.06%
- DSCR
- 0.95
- GRM
- 10.7
CMA / ARV
- ARV (on-the-fly)
- $238,004
- Comps found
- 12
Show comp detail 12 sales within ~0.75 mi
| Address | Dist | Beds/Ba | Sqft | Sold | Price | $/sf | Match |
|---|---|---|---|---|---|---|---|
| 78 Lowery Dr | 0.00mi | 3/2.0 | 1,142 (-4%) | 0mo | $170,000 | $149 | 92 |
| 82 Lowery Dr | 0.03mi | 3/2.0 | 1,192 (-0%) | 9mo | $235,000 | $197 | 91 |
| 206 Bell Dr | 0.33mi | 3/2.0 | 1,200 (+0%) | 10mo | $256,000 | $213 | 76 |
| 212 Bell Dr | 0.31mi | 3/2.0 | 1,128 (-6%) | 8mo | $230,000 | $204 | 69 |
| 113 Bell Dr | 0.36mi | 3/2.0 | 1,250 (+4%) | 8mo | $249,000 | $199 | 69 |
| 9 Terry Dr | 0.38mi | 3/2.0 | 1,170 (-2%) | 14mo | $230,000 | $197 | 68 |
| 8 Brandy Wine Dr | 0.49mi | 3/2.0 | 1,235 (+3%) | 12mo | $249,000 | $202 | 62 |
| 208 Rockspring Dr | 0.58mi | 3/1.0 | 1,191 (-0%) | 12mo | $237,500 | $199 | 58 |
| 130 Albertson Rd | 0.48mi | 3/1.0 | 1,087 (-9%) | 1mo | $75,000 | $69 | 58 |
| 204 Rockspring Dr | 0.58mi | 3/2.0 | 1,315 (+10%) | 3mo | $240,000 | $183 | 54 |
| 621 Nance Dr | 0.73mi | 3/1.0 | 1,248 (+4%) | 13mo | $255,000 | $204 | 44 |
| 103 Albertson Rd | 0.65mi | 2/1.0 (-1) | 1,064 (-11%) | 12mo | $100,000 | $94 | 32 |
Match score weights: distance 35% · size 25% · config 20% · recency 20%. Top-matched comps best support the ARV.
Projected returns pro-forma
-3.0% appreciation · 4.34% rent growth · sell at horizon
- IRR
- -16.7%
- Equity multiple
- 0.40×
- Total profit
- $-27,594
- Equity at exit
- $24,602
- IRR
- -6.4%
- Equity multiple
- 0.57×
- Total profit
- $-20,051
- Equity at exit
- $14,266
Cash invested: $46,200 (down + closing). Projections, not guarantees.
Landlord ↔ Tenant lean methodology
- Overall (STATE)
- 85 Strongly Landlord-Friendly
- State North Carolina
- 85 Strongly Landlord-Friendly · R+3
- County
- — inherits STATE
- City
- — inherits STATE
ZIP-level market 27360
- Rents YoY
- 4.3%
- Active inventory
- 307
- Price-to-rent
- 10.7×
Monthly cashflow live
- Estimated rent
- $1,290 high interval (Pro) →
- Mortgage (P&I)
- −$865
- Tax from tax record
- −$126 /mo · $1,509/yr
- Insurance
- −$69
- HOA
- −$0
- Vacancy / Maint / Mgmt
- −$271
- Net cashflow
- $-41
Break-even live
Sensitivity live
| Price | -10% $53 | -5% $6 | +0% $-41 | +5% $-87 | +10% $-134 |
|---|---|---|---|---|---|
| Rent | -10% $-143 | -5% $-92 | +0% $-41 | +5% $10 | +10% $61 |
| Rate | -1.0pp $42 | -0.5pp $1 | base $-41 | +0.5pp $-83 | +1.0pp $-127 |
UW: 25.0% down · 7.5% · 30yr · 1.5% tax · 5.0% vac · 8.0% maint · 8.0% mgmt
Financing live
Cash to close
- Down payment
- $41,250
- Closing costs
- $4,950
- Reserves months
- —
- Total cash needed
- —
Loan-product check · same deal, 3 products live
Conventional
25% down · 7.5% · 30yr
- Down + closing
- —
- Monthly P&I
- —
- Monthly cashflow
- —
- DSCR
- —
- Eligible?
- —
Personal DTI + credit; lowest rate.
DSCR
20% down · 8.5% · 30yr
- Down + closing
- —
- Monthly P&I
- —
- Monthly cashflow
- —
- DSCR
- —
- Eligible?
- —
No personal income docs; deal must DSCR.
Hard money
10% down · 12.0% · 12mo
- Down + closing
- —
- Monthly P&I
- —
- Monthly cashflow
- —
- DSCR
- —
- Eligible?
- —
Short-term bridge; refi at stabilization.
Rent comps 8 comps
| Address | Beds | Baths | Sqft | Rent | $/sqft | DOM | Units | Dist |
|---|---|---|---|---|---|---|---|---|
| 1311 Blair St Thomasville, NC | 2.0 | 1.0–1.5 | 950 | $1,162 | $1.22 | 14d | 7 | 0.59mi |
| 1311 Blair St Apt 2A Thomasville, NC | 2.0 | 1.5 | 1000 | $1,249 | $1.25 | 21d | 1 | 0.61mi |
| 1311 Blair St Apt 2B Thomasville, NC | 2.0 | 1.5 | 1000 | $1,075 | $1.07 | 21d | 1 | 0.64mi |
| 1311 Blair St Unit 1305-D Thomasville, NC | 2.0 | 1.0 | 900 | $1,075 | $1.19 | 21d | 1 | 0.64mi |
| 5024 Ball Park Rd Thomasville, NC | 2.0 | 1.0 | 1269 | $1,100 | $0.87 | 24d | 1 | 0.69mi |
| 2020 Ball Park Rd Thomasville, NC | 3.0 | 2.0 | 1266 | $1,750 | $1.38 | 14d | 1 | 1.18mi |
| 103 Joe Moore Rd Thomasville, NC | 3.0 | 2.0 | 1086 | $1,670 | $1.54 | 24d | 1 | 1.48mi |
| 301 Culbreth Ave Thomasville, NC | 2.0 | 1.0 | 750 | $895 | $1.19 | 24d | 1 | 1.49mi |
Listing history 11 events
-
2026-04-29status Pending
-
2026-04-22$165,000 Active
-
2022-11-01soldstatus $585,500
-
2022-03-03price $1,370
-
2022-01-26soldstatus $168,500
-
2022-01-24soldstatus $168,400 Closed 194-char remark
Show marketing remark (194 chars)
Kitchen dining combo with ex/large island, ceramic tile, back splash and granite counter tops. Cathedral ceiling and new deck. Updated heat pump. Very large country front porch. A Super bargain!
-
2022-01-06status Pending 194-char remark
Show marketing remark (194 chars)
Kitchen dining combo with ex/large island, ceramic tile, back splash and granite counter tops. Cathedral ceiling and new deck. Updated heat pump. Very large country front porch. A Super bargain!
-
2021-12-14historical Due Diligence Period 194-char remark
Show marketing remark (194 chars)
Kitchen dining combo with ex/large island, ceramic tile, back splash and granite counter tops. Cathedral ceiling and new deck. Updated heat pump. Very large country front porch. A Super bargain!
-
2021-12-06$168,400 Active 194-char remark
Show marketing remark (194 chars)
Kitchen dining combo with ex/large island, ceramic tile, back splash and granite counter tops. Cathedral ceiling and new deck. Updated heat pump. Very large country front porch. A Super bargain!
-
2002-05-15soldstatus $107,500
-
1990-04-01soldstatus $65,500
ⓘ Source: listings_history table (triggers on properties + properties_extension) + one-shot
backfill from property_details.listing_events for pre-trigger history.
Tax reassessment forecast NC · Resets to sale price
- Current annual tax
- $1,509 · $126/mo
- Projected year-2 tax
- $1,509 · $126/mo
- Expected delta
- $0/yr ($0/mo · 0.0%)
ⓘ Screening estimate from a state-policy table — verify with the county assessor before closing.
Climate risk First Street
- Flood 1/10 Low FEMA zone X (unshaded) · 0% chance over 30 yrs
- Wildfire 1/10 Low
- Heat 5/10 Major 7 d/yr ≥103°F today · 17 d/yr by 30 yrs out
- Wind 4/10 Moderate 15% chance of damaging wind over 30 yrs
- Air quality 2/10 Low 1 unhealthy d/yr today · 1 by 30 yrs out
Nearby sold comps map
Loading sold comps map…
Walkable amenities ~0.75 mi
Loading nearby amenities…
Taxation est. · year 1
- Rental income
- $15,481
- − Mortgage interest
- −$9,243
- − Property taxes
- −$1,509
- − Insurance
- −$825
- − Repairs & maintenance
- −$1,238
- − Management
- −$1,238
- − Depreciation
- −$4,800
- Taxable loss
- −$3,373
- Est. tax savings @ 24.0%
- +$810
- After-tax cash flow
- $322/yr
For passive investors: Depreciation is non-cash, so a rental often shows a tax loss while cash-flowing — sheltering income. Rental losses are passive: they offset passive income freely, and up to $25,000/yr can offset ordinary (W-2) income if you actively participate and your MAGI is under $100k (phasing out to $0 by $150k); unused losses carry forward. On sale, claimed depreciation is recaptured at up to 25%, and gains may owe capital-gains tax (a 1031 exchange can defer both). Figures are a year-1 estimate at your 24.0% rate — not tax advice; consult a CPA.
Schools (NCES district)
- District
- Davidson County Schools
- NCES district ID
- 3701140
- Math proficiency
- 50% ▲ 2.00%
- Reading proficiency
- 50% ▲ 2.00%
- Median HH income
- $49,696
- Composite
- 42.76/100
- National rank
- #3157
- State rank
- #62 of 178 in NC
Livability — Thomasville
- Score
- 81/100
- State rank
- #16
- US rank
- #1454
Category grades
Schools grade is shown separately in the Schools card above.
Census & demographics
- Census place
- Thomasville, NC
- County
- Davidson County · 129,088 people
- City population
- 49,510
- Metro
- Winston-Salem, NC
- Population (ZIP)
- 49,510
- Household income
- $61,983
- Rent vs Own
- Severe rent burden
- 1052.0
Population outlook (Davidson County) Hauer SSP2
- Today (2025)
- 167,156 people
- By 2030
- 167,216 · +0.0%
- By 2040
- 164,524 · -1.6%
- By 2050
- 157,229 · -5.9%
- By 2075
- 138,084 · -17.4%
- By 2100
- 112,729 · -32.6%
Race, ethnicity, and origin ACS 2023
- Neighborhood character
- Predominantly White (71%)
- Race & ethnicity
- White 71% Hispanic / Latino 11% Black 11% Two or more races 11%
- Hispanic origin (detail)
- Mexican 7%
- Common ancestry
- Slovak 2% Serbian 1% Italian 1%
- Foreign-born
- 7% · Canada
- Languages at home
- 88% English-only · Spanish 10% Other Indo-European 1%
Political lean MEDSL · Davidson
- 2024 margin
- Solid R (+47.1) · D 25.9% · R 73.0% · Other 1.1%
- 2008→2024 swing
- -13.5pp toward R · 2008: -33.5pp · 2024: -47.1pp
- All cycles
- 2024: R+47.1 2020: R+47.5 2016: R+49.4 2012: R+40.9 2008: R+33.5
Not yet ingested
- Civics
- —
Market trends
- HPI YoY
- ▼ -146.33%
- Current HPI
- 243.0953
- Rent YoY
- ▲ 4.34%
- Metro
- Winston-Salem, NC
- State GDP YoY
- ▲ 3.28%
- F500 in state
- 26
Industry mix (Fortune 500 HQ in NC)
| Industry | F500 HQs | Revenue |
|---|---|---|
| Financial Services | 2 | $213B |
|
||
| Retail | 2 | $95B |
|
||
| Industrial Conglomerate | 1 | $38B |
|
||
| Metals / Steel | 1 | $35B |
|
||
| Utilities | 1 | $30B |
|
||
| Industrial Machinery | 1 | $19B |
|
||
Price history
+151.9% since first listed11 events — show timeline
- 2026-04-29 Pending — Triad MLS
- 2026-04-22 Listed $165,000 Triad MLS
- 2022-11-01 Sold (Public Records) $585,500 Public Records
- 2022-03-03 Price Changed $1,370 RENT.
- 2022-01-26 Sold (Public Records) $168,500 Public Records
- 2022-01-24 Sold (MLS) $168,400 Triad MLS
- 2022-01-06 Pending — Triad MLS
- 2021-12-14 Contingent — Triad MLS
- 2021-12-06 Listed $168,400 Triad MLS
- 2002-05-15 Sold (Public Records) $107,500 Public Records
- 1990-04-01 Sold (Public Records) $65,500 Public Records
Property tax history
+1.9%/yrLatest (2025): $1,509 · +0.0% YoY. Source: county tax records.
Cash-flow waterfall
monthlySold comps — $/sqft
last 12 mo · ≤1 miLoading sold comps…