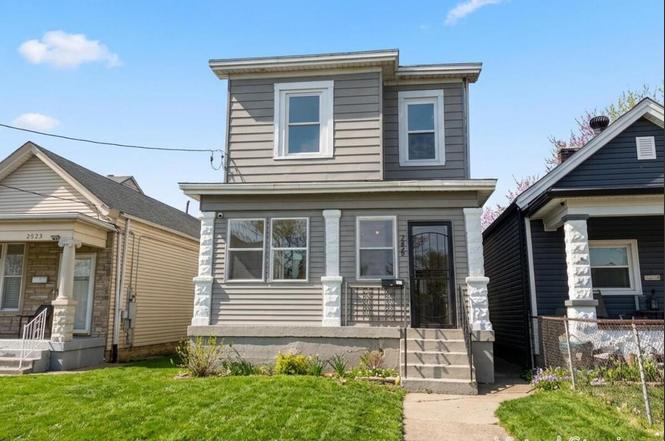
2823 W Main St · Louisville, KY
Flood risk 1/10 · Minimal
- FEMA flood zone
- X (unshaded)
- Chance of flooding over 30 yrs
- 0.0%
- Est. flood insurance / yr
- $473 – $860
Fire risk 1/10 · Minimal
- Est. fire insurance / yr
- $839 – $1,559
Heat risk 5/10 · Moderate
- Hot days now (above 105°F)
- 7 days/yr
- Hot days in 30 yrs
- 20 days/yr
Wind risk 2/10 · Minimal
- Chance of severe wind over 30 yrs
- 1.0%
Air-quality risk 2/10 · Minimal
- Unhealthy air days now
- 1 days/yr
- Unhealthy air days in 30 yrs
- 2 days/yr
Risk factors via First Street. Map © Google.
Why this score? — see what drove the A grade
The composite is a weighted blend of 9 inputs, each scored 0–100. Each bar is that input's sub-score; the figure is the points it added to the 100-point composite (weight × sub-score).
- Cash flow +30.0/30.0
- ARV discount +15.0/15.0
- 1% rule +10.0/10.0
- DSCR +10.0/10.0
- Appreciation +10.0/10.0
- Livability +3.2/5.0
- Rent growth +2.6/5.0
- Condition / age +2.5/5.0
- Schools +2.3/10.0
$87,000
🖨 Deal sheet 📄 Offer letter ✓ Due diligence
Listing remarks MLS
Welcome to this HUGE two story fully updated home. This home boasts over 1900 square feet of living space and updates include newer flooring, fresh paint, newer kitchen cabinets and granite counters in the kitchen, and more. You will enjoy the cozy living room, dining/bonus room and the updated kitchen. The first floor also features a spacious bedroom and full bathroom. As you make your way to the second level you find 3 spacious bedrooms and an additional full bathroom. Additionally there is a bonus room that can be used as an office, playroom, etc. This house is simply amazing and roomy and it comes at an affordable price. Schedule your showing today!
Key facts
- Convenient access
- Flexible layout
- Large yard
Tags
Property features AI
Finance
- HOA & community: No association fee
Exterior
- Utilities: Electricity connected; Natural gas
- Home design: Single-family residence; Traditional-style; 2 stories; Entry level: First floor
- Construction: Built in 1900; Aluminum siding; Shingle roof; Crawl space foundation
- Exterior features: Chain link fencing; Level lot; Sidewalks
Interior
- Kitchen: Kitchen on the first floor
- Bedrooms: Total of 5 bedrooms; Two first-floor bedrooms; Three second-floor bedrooms; No basement bedrooms; Primary bedroom on the first floor
- Bathrooms: Two full bathrooms; No half bathrooms
- Heating & cooling: Forced air heating; Central air conditioning
- Interior features: Seven total rooms (excluding bonus/other); Seven closets; Cellar basement; First-floor laundry
- Laundry & utility: Laundry room on the first floor
Neighborhood map
What this means for you Summary
Snapshot
- This is a 5-bed/2.0-bath single-family listed at $87k.
Deal economics
- At list price, monthly cash flow is $685 ($8k/yr) — positive.
- The deal already cash-flows at list — no discount required.
- Meets the 1% rule at list price ($2k rent vs $87k).
- Recommended offer: $82k (6.0% below list) — sets the bar for market timing.
- Cap rate 15.7% vs local median 5.0% in Louisville — top-decile yield for the area; either an underpriced asset or a hidden risk that comps aren't pricing in. Stress-test before assuming the spread holds.
Location & tenants
- Location reads 63/100 on livability (#333 in KY) — a middle-class / working-renter tenant base. Strengths: cost of living A+, housing A+; Watch: employment C-, health & safety D+, schools D-.
- Jefferson County (urban): math 19% / reading 35% proficiency, ranked #121 of 165 in KY (top 73%) — low school quality limits family demand, transient renter base, plan for 1-2y turnover.
- Market conditions: Rents flat; 140 active listings in the ZIP; 8 comparable units currently listed for rent nearby; rentals at typical pace (median 16d on market — plan ~3-4 weeks tenant-placement turnaround); lower-income renter base — watch delinquency; 2,836 units permitted in Jefferson County in 2024 (1,558 in 5+ unit buildings).
- At $1,690/mo this rent would consume 57% of the median local household income ($36k/yr) (locally 1148% of renters already pay >50% of income on rent) — very limited rent-growth headroom before tenants either downsize or default.
Forward outlook
- In year one you build about $9k of equity ($601 loan paydown + $9k appreciation (10.0% local appreciation)).
- Jefferson County population projected at +13% by 2050 — modest demand growth; plan on rents tracking national, not racing it.
- At projected returns (10.0% appreciation + 0.5% rent growth), your $24k cash investment doubles in ~2 years — after that, you're playing with house money.
- By year 4, paydown + projected appreciation supports a ~$33k cash-out refi (75% LTV) — recoverable capital for the next deal without selling this one.
Negotiation context
- It's been on market 82 days — a 6% lower offer ($82k) is reasonable based on typical stale-listing flexibility.
- 3 sale attempts since 17y ago; this cycle's ask has dropped $55k (39%) from the opening price — seller is motivated, your offer sets the floor, not the list.
Risks & watch-outs
- Watch-outs: built in 1900 — expect roof / HVAC / electrical / plumbing capex.
- Climate carrying-cost: extreme-heat days projected 7→20/yr by 2055 (HVAC capex compounding) — expect insurance premiums to compound above CPI over the hold.
Questions for the listing agent
- It's been on market 82 days. Have you received any prior offers? Is the seller open to a 6% concession, seller financing, or rate buy-down credit?
- Built in 1900 — when were the roof, HVAC, electrical panel, plumbing, and water heater last replaced?
- Why hasn't it sold? Are there any deal-killer items the seller is aware of (foundation, flood, title, zoning, code violations)?
- Is there a deadline driving the sale (1031 exchange, divorce, estate, relocation)? That informs how much negotiation room exists.
- Schools are D-rated, which usually means shorter tenancies and higher turnover. Who's the typical renter profile here, and what's been the actual vacancy rate?
- Crime grade is F in this area — have there been break-ins, vandalism, or insurance claims at this property in the last 3 years? What carrier currently insures it and at what premium?
- What's the average days-on-market for RENTAL listings here right now (not sales)? A rising rental-DOM trend means longer vacancies and softer asking-rent achievability than the comps imply.
- What's the recent tenant-quality profile in this submarket — average credit score on applications, eviction rate, late-payment / NSF rate, and stable-employment percentage? A property-management company in the area should have these aggregated.
- How much new for-sale + rental construction is in the pipeline within 1–3 miles? Heavy new supply typically softens prices + rents 12–24 months out; constrained supply supports both.
Investment metrics
- 1% rule
- 1.94% ✓
- Cap rate
- 15.74%
- Cash-on-cash
- 33.74%
- DSCR
- 2.50
- GRM
- 4.3
CMA / ARV
- ARV (on-the-fly)
- $155,520
- Comps found
- 8
Show comp detail 8 sales within ~0.75 mi
| Address | Dist | Beds/Ba | Sqft | Sold | Price | $/sf | Match |
|---|---|---|---|---|---|---|---|
| 2715 W Market St | 0.20mi | 4/2.0 (-1) | 1,735 (-10%) | 8mo | $139,000 | $80 | 63 |
| 3233 W Jefferson St | 0.42mi | 4/2.0 (-1) | 1,922 (+0%) | 15mo | $159,000 | $83 | 63 |
| 2535 Duncan St | 0.36mi | 5/2.0 | 2,100 (+9%) | 10mo | $170,000 | $81 | 59 |
| 2523 Saint Xavier St | 0.63mi | 4/1.0 (-1) | 1,894 (-1%) | 9mo | $30,000 | $16 | 52 |
| 2424 Saint Xavier St | 0.65mi | 4/2.5 (-1) | 1,921 (+0%) | 19mo | $190,650 | $99 | 47 |
| 2628 Bank St | 0.65mi | 4/2.0 (-1) | 2,166 (+13%) | 2mo | $165,500 | $76 | 42 |
| 2513 W Chestnut St | 0.63mi | 4/2.0 (-1) | 2,108 (+10%) | 14mo | $144,000 | $68 | 38 |
| 2711 W Chestnut St | 0.56mi | 4/1.5 (-1) | 1,737 (-10%) | 20mo | $148,000 | $85 | 34 |
Match score weights: distance 35% · size 25% · config 20% · recency 20%. Top-matched comps best support the ARV.
Projected returns pro-forma
10.0% appreciation · 0.51% rent growth · sell at horizon
- IRR
- 48.5%
- Equity multiple
- 4.57×
- Total profit
- $86,933
- Equity at exit
- $78,376
- IRR
- 41.2%
- Equity multiple
- 9.80×
- Total profit
- $214,247
- Equity at exit
- $169,022
Cash invested: $24,360 (down + closing). Projections, not guarantees.
Landlord ↔ Tenant lean methodology
- Overall (STATE)
- 83 Strongly Landlord-Friendly
- State Kentucky
- 83 Strongly Landlord-Friendly · R+16
- County
- — inherits STATE
- City
- — inherits STATE
ZIP-level market 40212
- Home prices YoY
- 11.0%
- Rents YoY
- 0.5%
- Active inventory
- 140
- Price-to-rent
- 4.3×
Monthly cashflow live
- Estimated rent
- $1,690 high interval (Pro) →
- Mortgage (P&I)
- −$456
- Tax from tax record
- −$158 /mo · $1,890/yr
- Insurance
- −$36
- HOA
- −$0
- Vacancy / Maint / Mgmt
- −$355
- Net cashflow
- $685
Break-even live
UW: 25.0% down · 7.5% · 30yr · 1.5% tax · 5.0% vac · 8.0% maint · 8.0% mgmt
Financing live
Cash to close
- Down payment
- $21,750
- Closing costs
- $2,610
- Reserves months
- —
- Total cash needed
- —
Loan-product check · same deal, 3 products live
Conventional
25% down · 7.5% · 30yr
- Down + closing
- —
- Monthly P&I
- —
- Monthly cashflow
- —
- DSCR
- —
- Eligible?
- —
Personal DTI + credit; lowest rate.
DSCR
20% down · 8.5% · 30yr
- Down + closing
- —
- Monthly P&I
- —
- Monthly cashflow
- —
- DSCR
- —
- Eligible?
- —
No personal income docs; deal must DSCR.
Hard money
10% down · 12.0% · 12mo
- Down + closing
- —
- Monthly P&I
- —
- Monthly cashflow
- —
- DSCR
- —
- Eligible?
- —
Short-term bridge; refi at stabilization.
Rent comps 8 comps
| Address | Beds | Baths | Sqft | Rent | $/sqft | DOM | Units | Dist |
|---|---|---|---|---|---|---|---|---|
| 205 N 26th St Louisville, KY | 5.0 | 2.0 | 1538 | $1,700 | $1.11 | 23d | 1 | 0.26mi |
| 2319 W Muhammad Ali Blvd Louisville, KY | 4.0 | 1.0 | 1644 | $1,300 | $0.79 | 16d | 1 | 0.65mi |
| 627 S 38th St Louisville, KY | 4.0 | 1.0 | 1300 | $1,349 | $1.04 | 16d | 1 | 1.05mi |
| 737 S 33rd St Louisville, KY | 4.0 | 1.0 | 1356 | $1,595 | $1.18 | 23d | 1 | 1.06mi |
| 820 Hazel St Louisville, KY | 4.0 | 2.0 | 1872 | $1,395 | $0.75 | 3d | 1 | 1.13mi |
| 858 S 23rd St Louisville, KY | 5.0 | 1.0 | 2228 | $2,100 | $0.94 | 17d | 1 | 1.25mi |
| 3909 W Broadway Louisville, KY | 5.0 | 2.0 | 2000 | $1,745 | $0.87 | 16d | 1 | 1.32mi |
| 722 S 40th St Unit NA Louisville, KY | 4.0 | 2.5 | 1556 | $1,700 | $1.09 | 3d | 1 | 1.41mi |
Listing history 14 events
-
2026-06-07status $87,000 Pending 82 DOM
-
2026-06-03days on market $87,000 Active 82 DOM
-
2026-06-02days on market $87,000 Active 81 DOM
-
2026-06-01days on market $87,000 Active 80 DOM
-
2026-05-31days on market $87,000 Active 79 DOM
-
2026-05-01price $102,500
-
2026-04-16price $113,600
-
2026-03-13$142,000 Active
-
2023-03-20soldstatus $150,000 Closed 662-char remark
Show marketing remark (662 chars)
Welcome to this HUGE two story fully updated home. This home boasts over 1900 square feet of living space and updates include newer flooring, fresh paint, newer kitchen cabinets and granite counters in the kitchen, and more. You will enjoy the cozy living room, dining/bonus room and the updated kitchen. The first floor also features a spacious bedroom and full bathroom. As you make your way to the second level you find 3 spacious bedrooms and an additional full bathroom. Additionally there is a bonus room that can be used as an office, playroom, etc. This house is simply amazing and roomy and it comes at an affordable price. Schedule your showing today!
-
2023-01-31status Pending 662-char remark
Show marketing remark (662 chars)
Welcome to this HUGE two story fully updated home. This home boasts over 1900 square feet of living space and updates include newer flooring, fresh paint, newer kitchen cabinets and granite counters in the kitchen, and more. You will enjoy the cozy living room, dining/bonus room and the updated kitchen. The first floor also features a spacious bedroom and full bathroom. As you make your way to the second level you find 3 spacious bedrooms and an additional full bathroom. Additionally there is a bonus room that can be used as an office, playroom, etc. This house is simply amazing and roomy and it comes at an affordable price. Schedule your showing today!
-
2023-01-23$145,000 Active 662-char remark
Show marketing remark (662 chars)
Welcome to this HUGE two story fully updated home. This home boasts over 1900 square feet of living space and updates include newer flooring, fresh paint, newer kitchen cabinets and granite counters in the kitchen, and more. You will enjoy the cozy living room, dining/bonus room and the updated kitchen. The first floor also features a spacious bedroom and full bathroom. As you make your way to the second level you find 3 spacious bedrooms and an additional full bathroom. Additionally there is a bonus room that can be used as an office, playroom, etc. This house is simply amazing and roomy and it comes at an affordable price. Schedule your showing today!
-
2021-11-02soldstatus $29,000
-
2009-04-06soldstatus $19,000 1019-char remark
Show marketing remark (1019 chars)
Attention Investors - this property appears to have been a duplex per PVA. Don't hesitate - see it today. Income generating potential. Addendums required for all offers, see online under disclosures. All offers must be LEGIBLE and include copy of pre-qual/proof of funds and earnest money check. Agents see Agent Notes and all listing remarks before submitting offers. Minimum $1000 earnest money, however seller may request more. Seller and seller's agent have no personal knowledge of property condition and make no representations or warranties as to the condition of the property; improvements or appurtenances, and that the property is sold ''As Is - Where Is'' condition with no warranties expressed or implied. Bank addendums control over standard board contract. All parties wishing to on deed must sign offer, contracts cannot be assigned. If purchasing under a business name, additional information may be required. SFNW First-time home buyers can receive an $8000 tax credit, just ask your agent for details.
-
2009-02-24$24,900 1019-char remark
Show marketing remark (1019 chars)
Attention Investors - this property appears to have been a duplex per PVA. Don't hesitate - see it today. Income generating potential. Addendums required for all offers, see online under disclosures. All offers must be LEGIBLE and include copy of pre-qual/proof of funds and earnest money check. Agents see Agent Notes and all listing remarks before submitting offers. Minimum $1000 earnest money, however seller may request more. Seller and seller's agent have no personal knowledge of property condition and make no representations or warranties as to the condition of the property; improvements or appurtenances, and that the property is sold ''As Is - Where Is'' condition with no warranties expressed or implied. Bank addendums control over standard board contract. All parties wishing to on deed must sign offer, contracts cannot be assigned. If purchasing under a business name, additional information may be required. SFNW First-time home buyers can receive an $8000 tax credit, just ask your agent for details.
ⓘ Source: listings_history table (triggers on properties + properties_extension) + one-shot
backfill from property_details.listing_events for pre-trigger history.
Tax reassessment forecast KY · Resets to sale price
- Current annual tax
- $1,890 · $158/mo
- Projected year-2 tax
- $1,890 · $158/mo
- Expected delta
- $0/yr ($0/mo · 0.0%)
ⓘ Screening estimate from a state-policy table — verify with the county assessor before closing.
Climate risk First Street
- Flood 1/10 Low FEMA zone X (unshaded) · 0% chance over 30 yrs
- Wildfire 1/10 Low
- Heat 5/10 Major 7 d/yr ≥105°F today · 20 d/yr by 30 yrs out
- Wind 2/10 Low 100% chance of damaging wind over 30 yrs
- Air quality 2/10 Low 1 unhealthy d/yr today · 2 by 30 yrs out
Nearby sold comps map
Loading sold comps map…
Walkable amenities ~0.75 mi
Loading nearby amenities…
Taxation est. · year 1
- Rental income
- $20,278
- − Mortgage interest
- −$4,873
- − Property taxes
- −$1,890
- − Insurance
- −$435
- − Repairs & maintenance
- −$1,622
- − Management
- −$1,622
- − Depreciation
- −$2,531
- Taxable income
- $7,304
- Est. tax owed @ 24.0%
- −$1,753
- After-tax cash flow
- $6,467/yr
For passive investors: Depreciation is non-cash, so a rental often shows a tax loss while cash-flowing — sheltering income. Rental losses are passive: they offset passive income freely, and up to $25,000/yr can offset ordinary (W-2) income if you actively participate and your MAGI is under $100k (phasing out to $0 by $150k); unused losses carry forward. On sale, claimed depreciation is recaptured at up to 25%, and gains may owe capital-gains tax (a 1031 exchange can defer both). Figures are a year-1 estimate at your 24.0% rate — not tax advice; consult a CPA.
Schools (NCES district)
- District
- Jefferson County
- NCES district ID
- 2102990
- Math proficiency
- 19% ▼ -17.00%
- Reading proficiency
- 35% ▼ -11.00%
- Median HH income
- $47,885
- Composite
- 23.45/100
- National rank
- #7884
- State rank
- #121 of 165 in KY
Livability — Louisville
- Score
- 63/100
- State rank
- #333
- US rank
- #15887
Category grades
Schools grade is shown separately in the Schools card above.
Census & demographics
- Census place
- Louisville, KY
- County
- Jefferson County · 790,184 people
- City population
- 769,292
- Metro
- Louisville/Jefferson County, KY-IN
- Population (ZIP)
- 14,661
- Household income
- $35,753
- Rent vs Own
- Severe rent burden
- 1148.0
Population outlook (Jefferson County) Hauer SSP2
- Today (2025)
- 823,112 people
- By 2030
- 849,343 · +3.2%
- By 2040
- 895,696 · +8.8%
- By 2050
- 933,630 · +13.4%
- By 2075
- 1,028,262 · +24.9%
- By 2100
- 1,072,675 · +30.3%
Race, ethnicity, and origin ACS 2023
- Neighborhood character
- Majority Black (60%)
- Race & ethnicity
- Black 60% White 37% Two or more races 2% Hispanic / Latino 1%
- Common ancestry
- Slovak 1% Lithuanian 1% Iranian 1%
- Foreign-born
- 1% · Canada
- Languages at home
- 98% English-only · Spanish 1%
Political lean MEDSL · Jefferson
- 2024 margin
- D (+16.6) · D 57.4% · R 40.9% · Other 1.7%
- 2008→2024 swing
- +4.5pp toward D · 2008: 12.0pp · 2024: 16.6pp
- All cycles
- 2024: D+16.6 2020: D+20.1 2016: D+13.3 2012: D+11.1 2008: D+12.0
Not yet ingested
- Civics
- —
Market trends
- HPI YoY
- ▲ 29.02%
- Current HPI
- 293.2624
- Rent YoY
- ▲ 0.51%
- Metro
- Louisville/Jefferson County, KY-IN
- State GDP YoY
- ▲ 1.81%
- F500 in state
- 4
Industry mix (Fortune 500 HQ in KY)
| Industry | F500 HQs | Revenue |
|---|---|---|
| Healthcare | 1 | $118B |
|
||
| Food / Beverage | 1 | $7B |
|
||
Price history
+311.6% since first listed9 events — show timeline
- 2026-05-01 Price Changed $102,500 Metro Search MLS
- 2026-04-16 Price Changed $113,600 Metro Search MLS
- 2026-03-13 Listed $142,000 Metro Search MLS
- 2023-03-20 Sold (MLS) $150,000 Metro Search MLS
- 2023-01-31 Pending — Metro Search MLS
- 2023-01-23 Listed $145,000 Metro Search MLS
- 2021-11-02 Sold (Public Records) $29,000 Public Records
- 2009-04-06 Sold (MLS) $19,000 Metro Search MLS
- 2009-02-24 Listed $24,900 Metro Search MLS
Property tax history
+11.7%/yrLatest (2025): $1,890 · -1.9% YoY. Source: county tax records.
Cash-flow waterfall
monthlySold comps — $/sqft
last 12 mo · ≤1 miLoading sold comps…