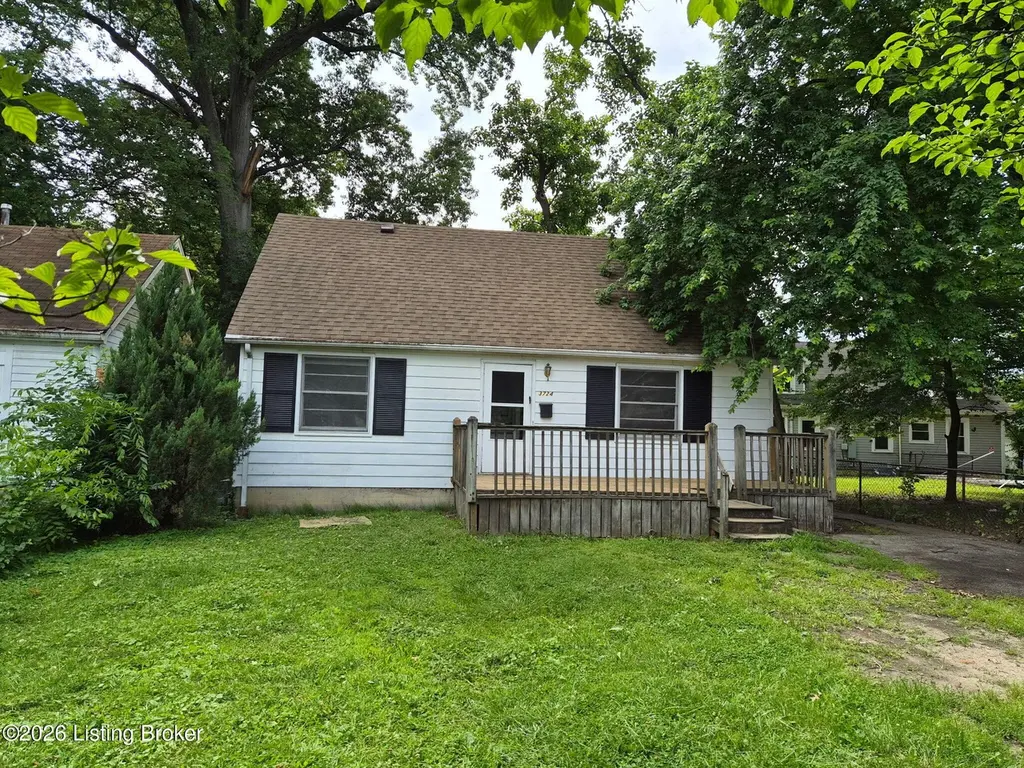
3724 Warren Ave · Louisville, KY
Flood risk 7/10 · Major
- FEMA flood zone
- X (unshaded)
- Chance of flooding over 30 yrs
- 0.77%
- Est. flood insurance / yr
- $507 – $1,088
Fire risk 1/10 · Minimal
- Est. fire insurance / yr
- $839 – $1,559
Heat risk 5/10 · Moderate
- Hot days now (above 105°F)
- 7 days/yr
- Hot days in 30 yrs
- 20 days/yr
Wind risk 2/10 · Minimal
- Chance of severe wind over 30 yrs
- 1.0%
Air-quality risk 2/10 · Minimal
- Unhealthy air days now
- 1 days/yr
- Unhealthy air days in 30 yrs
- 3 days/yr
Risk factors via First Street. Map © Google.
Why this score? — see what drove the D+ grade
The composite is a weighted blend of 9 inputs, each scored 0–100. Each bar is that input's sub-score; the figure is the points it added to the 100-point composite (weight × sub-score).
- Cash flow +16.8/30.0
- ARV discount +10.1/15.0
- DSCR +5.2/10.0
- 1% rule +4.1/10.0
- Rent growth +3.8/5.0
- Livability +3.2/5.0
- Condition / age +2.5/5.0
- Schools +2.3/10.0
- Appreciation +0.0/10.0
$180,000
🖨 Deal sheet (PDF) 📄 Offer letter ✓ Due diligence
Listing remarks MLS
Welcome Home! This freshly painted, turn-key, spacious 4 bedroom cape cod is is a rare find in today's market. The sellers have lovingly maintained this property over the years, replacing the furnace in 2009, and the roof in 2012. Recent updates include new flooring in the kitchen, bathroom, utility room, and in 3 of the 4 bedrooms. The kitchen also features new countertops, new appliances, new sink faucet and updated LED lighting. The bathroom has been updated as well with a new sink, new faucet and new LED lighting. Call for your private showing today!
Key facts
- 4,400 sq ft lot
- Parking
- Built 1953
Property features AI
Finance
- HOA & community: No association fee
Exterior
- Parking: Driveway
- Utilities: Electricity connected; Natural gas service
- Home design: Single-family residence; Cape Cod style; Two stories; Built in 1953
- Construction: Aluminum siding; Shingle roof; Crawl space foundation
- Exterior features: Lot approximately 0.1 acre; Subdivision: LENOX
Interior
- Kitchen: Kitchen located on the first floor
- Bedrooms: Four bedrooms total; Two bedrooms on the first floor; Two bedrooms on the second floor; Primary bedroom on the first floor
- Bathrooms: One full bathroom on the first floor
- Heating & cooling: Forced air heating (natural gas); Central air conditioning
- Interior features: Six total rooms; Eight closets; No basement
- Laundry & utility: Laundry room on the first floor; First-floor laundry
Neighborhood map
What this means for you Summary
Snapshot
- This is a 4-bed/1.0-bath single-family listed at $180k.
Deal economics
- At list price, monthly cash flow is $49 ($585/yr) — positive.
- The deal already cash-flows at list — no discount required.
- To meet the 1% rule (rent ≥ 1% of price), the offer needs to be $164k (9.2% below list).
- Recommended offer: $164k (9.2% below list) — sets the bar for 1% rule.
- Cap rate 7.1% vs local median 5.0% in Louisville — top-decile yield for the area; either an underpriced asset or a hidden risk that comps aren't pricing in. Stress-test before assuming the spread holds.
Location & tenants
- Location reads 63/100 on livability (#333 in KY) — a middle-class / working-renter tenant base. Strengths: cost of living A+, housing A+; Watch: employment C-, health & safety D+, crime F.
- Jefferson County (urban): math 19% / reading 35% proficiency, ranked #121 of 165 in KY (top 73%) — low school quality limits family demand, transient renter base, plan for 1-2y turnover.
- Zoned schools: Semple Elementary (math 2% / reading 12%, grade F, #662 of 676 statewide, top 99%, 574 students, 79% FRL); Frederick Law Olmsted Academy North (math 5% / reading 15%, grade F, #217 of 217 statewide, top 100%, 510 students, 74% FRL); Iroquois High (math 12% / reading 8%, grade F, #245 of 254 statewide, top 97%, 1,090 students, 74% FRL) — zoned schools average 76% FRL vs 56% district-wide (20 pts higher); higher-poverty schools than district average — tighter screening recommended.
- Zoned-school proficiency averages 9% at this address vs 27% district-wide (-18 pts) — the specific schools serving this property underperform the Jefferson County average; the district grade overstates school quality for this exact location.
- Market conditions: Rents rising fast (+5.2%/yr); 118 active listings in the ZIP; 30 comparable units currently listed for rent nearby; rentals at typical pace (median 26d on market — plan ~3-4 weeks tenant-placement turnaround); lower-income renter base — watch delinquency; 2,836 units permitted in Jefferson County in 2024 (1,558 in 5+ unit buildings).
Forward outlook
- Local home prices are declining (-3.0%/yr); year-one equity from $1k of loan paydown is wiped out by about $5k of value loss. Plan a longer hold.
- Jefferson County population projected at +13% by 2050 — modest demand growth; plan on rents tracking national, not racing it.
Negotiation context
- Only 13 days on market — expect competitive offers; lowballing is unlikely to land.
- 5 sale attempts since 20y ago with the ask held roughly flat each time — persistent listings suggest the price (not the market) is what's stuck; bring a comps-based counter.
- Current owner paid $150k; 20% above their basis — modest negotiation headroom, anchor on the comps not their cost.
Risks & watch-outs
- Watch-outs: flood insurance adds $66/mo; built in 1953 — expect roof / HVAC / electrical / plumbing capex.
- Climate carrying-cost: major flood risk; extreme-heat days projected 7→20/yr by 2055 (HVAC capex compounding) — expect insurance premiums to compound above CPI over the hold.
Questions for the listing agent
- Built in 1953 — when were the roof, HVAC, electrical panel, plumbing, and water heater last replaced?
- What's the actual annual flood-insurance premium (NFIP or private), and is the property in a SFHA with mandatory coverage?
- Is there a deadline driving the sale (1031 exchange, divorce, estate, relocation)? That informs how much negotiation room exists.
- Schools are D-rated, which usually means shorter tenancies and higher turnover. Who's the typical renter profile here, and what's been the actual vacancy rate?
- Crime grade is F in this area — have there been break-ins, vandalism, or insurance claims at this property in the last 3 years? What carrier currently insures it and at what premium?
- The area grade is low — what's the realistic commute time and amenity access for the typical tenant pool here? Any planned neighborhood developments (good or bad) we should know about?
- What's the average days-on-market for RENTAL listings here right now (not sales)? A rising rental-DOM trend means longer vacancies and softer asking-rent achievability than the comps imply.
- What's the recent tenant-quality profile in this submarket — average credit score on applications, eviction rate, late-payment / NSF rate, and stable-employment percentage? A property-management company in the area should have these aggregated.
- How much new for-sale + rental construction is in the pipeline within 1–3 miles? Heavy new supply typically softens prices + rents 12–24 months out; constrained supply supports both.
Investment metrics
- 1% rule
- 0.91% ✗
- Cap rate
- 7.06%
- Cash-on-cash
- 2.74%
- DSCR
- 1.12
- GRM
- 9.2
CMA / ARV
- ARV (on-the-fly)
- $191,055
- Comps found
- 12
Show comp detail 12 sales within ~0.75 mi
| Address | Dist | Beds/Ba | Sqft | Sold | Price | $/sf | Match |
|---|---|---|---|---|---|---|---|
| 1006 Camden Ave | 0.14mi | 4/2.0 | 1,322 (-2%) | 7mo | $140,000 | $106 | 79 |
| 717 Camden Ave | 0.32mi | 4/1.0 | 1,445 (+7%) | 9mo | $135,000 | $93 | 67 |
| 1123 W Whitney Ave | 0.31mi | 3/1.0 (-1) | 1,508 (+11%) | 2mo | $170,000 | $113 | 60 |
| 1225 Manitau Ave | 0.47mi | 3/1.0 (-1) | 1,450 (+7%) | 3mo | $185,000 | $128 | 59 |
| 576 Longfield Ave | 0.61mi | 3/1.0 (-1) | 1,414 (+4%) | 1mo | $179,300 | $127 | 58 |
| 4519 S 6th St | 0.44mi | 5/2.5 (+1) | 1,274 (-6%) | 1mo | $185,000 | $145 | 58 |
| 824 Dresden Ave | 0.51mi | 4/2.0 | 1,225 (-10%) | 2mo | $173,000 | $141 | 55 |
| 1009 W Ashland Ave | 0.27mi | 3/2.0 (-1) | 1,525 (+12%) | 4mo | $240,000 | $157 | 54 |
| 811 Denmark St | 0.43mi | 3/1.0 (-1) | 1,193 (-12%) | 7mo | $120,000 | $101 | 50 |
| 1190 Bicknell Ave | 0.53mi | 3/2.0 (-1) | 1,500 (+11%) | 2mo | $250,000 | $167 | 47 |
| 1116 Dresden Ave | 0.49mi | 3/1.0 (-1) | 1,200 (-11%) | 8mo | $174,500 | $145 | 46 |
| 3668 Woodruff Ave | 0.45mi | 3/3.0 (-1) | 1,158 (-14%) | 6mo | $212,500 | $184 | 37 |
Match score weights: distance 35% · size 25% · config 20% · recency 20%. Top-matched comps best support the ARV.
Projected returns pro-forma
-3.0% appreciation · 5.16% rent growth · sell at horizon
- IRR
- -12.0%
- Equity multiple
- 0.56×
- Total profit
- $-22,406
- Equity at exit
- $26,839
- IRR
- 0.0%
- Equity multiple
- 1.00×
- Total profit
- $157
- Equity at exit
- $15,563
Cash invested: $50,400 (down + closing). Projections, not guarantees.
Landlord ↔ Tenant lean methodology
- Overall (STATE)
- 83 Strongly Landlord-Friendly
- State Kentucky
- 83 Strongly Landlord-Friendly · R+16
- County
- — inherits STATE
- City
- — inherits STATE
ZIP-level market 40215
- Home prices YoY
- -34.4%
- Rents YoY
- 5.2%
- Active inventory
- 118
- Price-to-rent
- 9.2×
Monthly cashflow live
- Estimated rent
- $1,635 high interval (Pro) →
- Mortgage (P&I)
- −$944
- Tax from tax record
- −$158 /mo · $1,890/yr
- Insurance
- −$75
- Flood insurance flood zone
- −$66 /mo · $798/yr
- HOA
- −$0
- Vacancy / Maint / Mgmt
- −$343
- Net cashflow
- $49
Break-even live
Sensitivity live
| Price | -10% $151 | -5% $100 | +0% $49 | +5% $-2 | +10% $-53 |
|---|---|---|---|---|---|
| Rent | -10% $-80 | -5% $-16 | +0% $49 | +5% $113 | +10% $178 |
| Rate | -1.0pp $139 | -0.5pp $95 | base $49 | +0.5pp $2 | +1.0pp $-45 |
UW: 25.0% down · 7.5% · 30yr · 1.5% tax · 5.0% vac · 8.0% maint · 8.0% mgmt
Financing live
Cash to close
- Down payment
- $45,000
- Closing costs
- $5,400
- Reserves months
- —
- Total cash needed
- —
Loan-product check · same deal, 3 products live
Conventional
25% down · 7.5% · 30yr
- Down + closing
- —
- Monthly P&I
- —
- Monthly cashflow
- —
- DSCR
- —
- Eligible?
- —
Personal DTI + credit; lowest rate.
DSCR
20% down · 8.5% · 30yr
- Down + closing
- —
- Monthly P&I
- —
- Monthly cashflow
- —
- DSCR
- —
- Eligible?
- —
No personal income docs; deal must DSCR.
Hard money
10% down · 12.0% · 12mo
- Down + closing
- —
- Monthly P&I
- —
- Monthly cashflow
- —
- DSCR
- —
- Eligible?
- —
Short-term bridge; refi at stabilization.
Rent comps 30 comps
| Address | Beds | Baths | Sqft | Rent | $/sqft | DOM | Units | Dist |
|---|---|---|---|---|---|---|---|---|
| 910 W Whitney Ave Louisville, KY | 3.0 | 1.0 | 1186 | $1,450 | $1.22 | 13d | 1 | 0.26mi |
| 910 W Whitney Ave Louisville, KY | 3.0 | 1.0 | 1186 | $1,450 | $1.22 | 3d | 1 | 0.26mi |
| 4513 S 6th St Louisville, KY | 3.0 | 2.0 | 1581 | $2,650 | $1.68 | 25d | 1 | 0.43mi |
| 925 W Evelyn Ave Louisville, KY | 3.0 | 1.5 | 1520 | $1,650 | $1.09 | 25d | 1 | 0.47mi |
| 4010 Taylor Blvd Louisville, KY | 4.0 | 2.0 | 1612 | $3,000 | $1.86 | 18d | 1 | 0.50mi |
| 4133 S 5th St Louisville, KY | 4.0 | 1.0 | 1200 | $1,435 | $1.20 | 18d | 1 | 0.51mi |
| 551 Denmark St Louisville, KY | 3.0 | 1.5 | 1160 | $1,700 | $1.47 | 25d | 1 | 0.53mi |
| 3746 Kahlert Ave Louisville, KY | 3.0 | 1.0 | 955 | $1,350 | $1.41 | 18d | 1 | 0.59mi |
| 3717 Wheeler Ave Louisville, KY | 3.0 | 2.0 | 1124 | $1,450 | $1.29 | 25d | 1 | 0.62mi |
| 615 Dresden Ave Louisville, KY | 3.0 | 1.0 | 884 | $1,450 | $1.64 | 25d | 1 | 0.63mi |
| 4007 Southern Pkwy Unit 1 Louisville, KY | 4.0 | 1.0 | 1500 | $1,395 | $0.93 | 5d | 1 | 0.72mi |
| 3909 Southern Pkwy Unit 2 Louisville, KY | 3.0 | 1.0 | 1000 | $1,100 | $1.10 | 5d | 1 | 0.78mi |
| 3860 Southern Pkwy Louisville, KY | 3.0 | 1.0 | 1064 | $1,250 | $1.17 | 25d | 1 | 0.78mi |
| 310 W Kenton St Louisville, KY | 3.0 | 2.0 | 1295 | $1,350 | $1.04 | 25d | 1 | 0.83mi |
| 3627 Parthenia Ave Louisville, KY | 3.0 | 1.0 | 900 | $1,245 | $1.38 | 25d | 1 | 0.85mi |
| 4000 Churchman Ave Louisville, KY | 3.0 | 1.0 | 1000 | $1,200 | $1.20 | 18d | 1 | 0.87mi |
| 1522 Clara Ave Louisville, KY | 3.0 | 2.0 | 1150 | $1,150 | $1.00 | 25d | 1 | 0.89mi |
| 119 E Southern Heights Ave Louisville, KY | 3.0 | 1.0 | 1000 | $1,250 | $1.25 | 25d | 1 | 0.91mi |
| 3524 Georgetown Cir Unit 3530 Louisville, KY | 3.0 | 1.0 | 886 | $1,350 | $1.52 | 5d | 1 | 1.08mi |
| 3524 Georgetown Cir Louisville, KY | 1.0–3.0 | 1.0 | 684 | $1,350 | $1.97 | 25d | 2 | 1.08mi |
| 3524 Georgetown Cir Louisville, KY | 1.0–3.0 | 1.0 | 684 | $1,350 | $1.97 | 16d | 4 | 1.08mi |
| 3102 Grant Ave Louisville, KY | 4.0 | 2.0 | 1603 | $1,595 | $1.00 | 25d | 1 | 1.13mi |
| 519 Forum Ave Louisville, KY | 3.0 | 1.5 | 1693 | $1,600 | $0.95 | 25d | 1 | 1.16mi |
| 1517 Shingo Ave Louisville, KY | 3.0 | 2.0 | 1100 | $1,349 | $1.23 | 25d | 1 | 1.18mi |
| 1507 Arling Ave Louisville, KY | 3.0 | 2.0 | 1148 | $1,275 | $1.11 | 18d | 1 | 1.23mi |
| 2826 Taylor Blvd Louisville, KY | 3.0 | 1.0 | 1044 | $1,345 | $1.29 | 25d | 1 | 1.33mi |
| 5013 Wabash Pl Louisville, KY | 3.0 | 2.0 | 1080 | $1,400 | $1.30 | 25d | 1 | 1.41mi |
| 1301 Lillian Ave Louisville, KY | 3.0 | 1.0 | 974 | $1,250 | $1.28 | 18d | 1 | 1.41mi |
| 5033 Wabash Pl Louisville, KY | 3.0 | 1.5 | 1156 | $1,350 | $1.17 | 25d | 1 | 1.44mi |
| 315 M St Unit 101 Louisville, KY | 3.0 | 1.5 | 1200 | $1,800 | $1.50 | 13d | 1 | 1.50mi |
Listing history 9 events
-
2026-06-21days on market $180,000 Active 13 DOM
-
2026-06-18days on market $180,000 Active 10 DOM
-
2026-06-17days on market $180,000 Active 9 DOM
-
2026-06-16days on market $180,000 Active 8 DOM
-
2026-06-15days on market $180,000 Active 7 DOM
-
2026-06-13days on market $180,000 Active 5 DOM
-
2026-06-10days on market $180,000 Active 2 DOM
-
2026-06-09remarks 255-char remark
-
2026-06-09$180,000 Active 1 DOM
ⓘ Source: listings_history table (triggers on properties + properties_extension) + one-shot
backfill from property_details.listing_events for pre-trigger history.
Tax reassessment forecast KY · Resets to sale price
- Current annual tax
- $1,890 · $158/mo
- Projected year-2 tax
- $1,890 · $158/mo
- Expected delta
- $0/yr ($0/mo · 0.0%)
ⓘ Screening estimate from a state-policy table — verify with the county assessor before closing.
Climate risk First Street
- Flood 7/10 Severe FEMA zone X (unshaded) · 77% chance over 30 yrs
- Wildfire 1/10 Low
- Heat 5/10 Major 7 d/yr ≥105°F today · 20 d/yr by 30 yrs out
- Wind 2/10 Low 100% chance of damaging wind over 30 yrs
- Air quality 2/10 Low 1 unhealthy d/yr today · 3 by 30 yrs out
Nearby sold comps map
Loading sold comps map…
Walkable amenities ~0.75 mi
Loading nearby amenities…
Taxation est. · year 1
- Rental income
- $19,621
- − Mortgage interest
- −$10,083
- − Property taxes
- −$1,890
- − Insurance
- −$1,697
- − Repairs & maintenance
- −$1,570
- − Management
- −$1,570
- − Depreciation
- −$5,236
- Taxable loss
- −$2,425
- Est. tax savings @ 24.0%
- +$582
- After-tax cash flow
- $1,168/yr
For passive investors: Depreciation is non-cash, so a rental often shows a tax loss while cash-flowing — sheltering income. Rental losses are passive: they offset passive income freely, and up to $25,000/yr can offset ordinary (W-2) income if you actively participate and your MAGI is under $100k (phasing out to $0 by $150k); unused losses carry forward. On sale, claimed depreciation is recaptured at up to 25%, and gains may owe capital-gains tax (a 1031 exchange can defer both). Figures are a year-1 estimate at your 24.0% rate — not tax advice; consult a CPA.
Schools (NCES district)
- District
- Jefferson County
- NCES district ID
- 2102990
- Math proficiency
- 19% ▼ -17.00%
- Reading proficiency
- 35% ▼ -11.00%
- Median HH income
- $47,885
- Composite
- 23.45/100
- National rank
- #7884
- State rank
- #121 of 165 in KY
Livability — Louisville
- Score
- 63/100
- State rank
- #333
- US rank
- #15887
Category grades
Schools grade is shown separately in the Schools card above.
Census & demographics
- Census place
- Louisville, KY
- County
- Jefferson County · 790,184 people
- City population
- 769,292
- Metro
- Louisville/Jefferson County, KY-IN
- Population (ZIP)
- 20,532
- Household income
- $43,725
- Rent vs Own
- Severe rent burden
- 997.0
Population outlook (Jefferson County) Hauer SSP2
- Today (2025)
- 823,112 people
- By 2030
- 849,343 · +3.2%
- By 2040
- 895,696 · +8.8%
- By 2050
- 933,630 · +13.4%
- By 2075
- 1,028,262 · +24.9%
- By 2100
- 1,072,675 · +30.3%
Race, ethnicity, and origin ACS 2023
- Neighborhood character
- Diverse neighborhood (Simpson 0.63)
- Race & ethnicity
- White 51% Black 33% Two or more races 11% Hispanic / Latino 6% Asian 2%
- Hispanic origin (detail)
- Mexican 2% Cuban 3%
- Common ancestry
- Slovak 1% Romanian 1% Serbian 1%
- Foreign-born
- 9% · Canada, Vietnam
- Languages at home
- 88% English-only · Spanish 5% Other Indo-European 2% Arabic 1%
Political lean MEDSL · Jefferson
- 2024 margin
- D (+16.6) · D 57.4% · R 40.9% · Other 1.7%
- 2008→2024 swing
- +4.5pp toward D · 2008: 12.0pp · 2024: 16.6pp
- All cycles
- 2024: D+16.6 2020: D+20.1 2016: D+13.3 2012: D+11.1 2008: D+12.0
Not yet ingested
- Civics
- —
Market trends
- HPI YoY
- ▼ -119.35%
- Current HPI
- 227.8248
- Rent YoY
- ▲ 5.16%
- Metro
- Louisville/Jefferson County, KY-IN
- State GDP YoY
- ▲ 1.81%
- F500 in state
- 4
Industry mix (Fortune 500 HQ in KY)
| Industry | F500 HQs | Revenue |
|---|---|---|
| Healthcare | 1 | $118B |
|
||
| Food / Beverage | 1 | $7B |
|
||
Price history
+125.0% since first listed14 events — show timeline
- 2026-06-08 Listed $180,000 Metro Search MLS
- 2022-04-13 Sold (Public Records) $150,000 Public Records
- 2022-03-29 Sold (MLS) $150,000 Metro Search MLS
- 2022-03-17 Contingent — Metro Search MLS
- 2022-03-07 Listed $159,900 Metro Search MLS
- 2022-03-07 Listing Removed — Metro Search MLS
- 2022-02-11 Listed $169,900 Metro Search MLS
- 2009-01-14 Sold (Public Records) $30,900 Public Records
- 2009-01-09 Sold (MLS) $30,900 Metro Search MLS
- 2008-11-13 Listed $30,900 Metro Search MLS
- 2008-10-07 Sold (Public Records) $53,600 Public Records
- 2006-05-08 Sold (Public Records) $80,000 Public Records
- 2006-05-01 Sold (MLS) $80,000 Metro Search MLS
- 2006-03-29 Listed $80,000 Metro Search MLS
Property tax history
+8.6%/yrLatest (2025): $1,890 · -1.9% YoY. Source: county tax records.
Cash-flow waterfall
monthlySold comps — $/sqft
last 12 mo · ≤1 miLoading sold comps…