950 7th Ave S #14 · Naples, FL
Flood risk 9/10 · Severe
- FEMA flood zone
- AE
- Chance of flooding over 30 yrs
- 0.99%
- Est. flood insurance / yr
- $1,737 – $8,500
Fire risk 3/10 · Minor
- Est. fire insurance / yr
- $947 – $1,759
Heat risk 10/10 · Severe
- Hot days now (above 107°F)
- 7 days/yr
- Hot days in 30 yrs
- 26 days/yr
Wind risk 10/10 · Severe
- Chance of severe wind over 30 yrs
- 99.0%
Air-quality risk 3/10 · Minor
- Unhealthy air days now
- 3 days/yr
- Unhealthy air days in 30 yrs
- 3 days/yr
Risk factors via First Street. Map © Google.
Why this score? — see what drove the D+ grade
The composite is a weighted blend of 9 inputs, each scored 0–100. Each bar is that input's sub-score; the figure is the points it added to the 100-point composite (weight × sub-score).
- Cash flow +9.6/30.0
- ARV discount +7.5/15.0
- Appreciation +7.0/10.0
- Schools +5.0/10.0
- Rent growth +4.7/5.0
- Livability +4.0/5.0
- 1% rule +3.0/10.0
- DSCR +2.7/10.0
- Condition / age +2.5/5.0
$550,000
🖨 Deal sheet (PDF) 📄 Offer letter ✓ Due diligence
Listing remarks
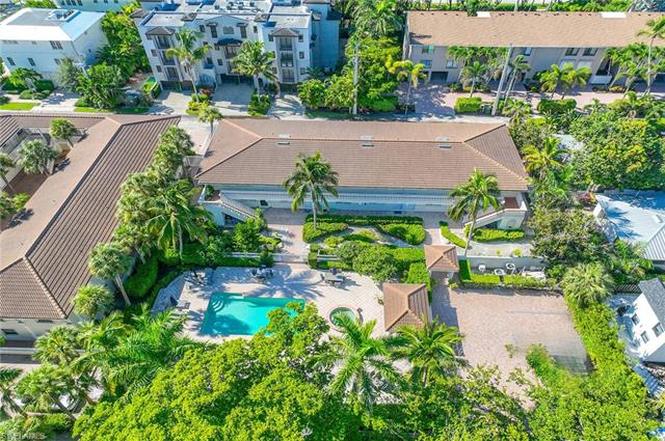
Welcome to Castleton Gardens, where Old Naples charm meets easy coastal living. This beautifully updated first-floor condominium is offered turnkey furnished and features one bedroom, one bath and tasteful finishes throughout. The kitchen includes quartz countertops, new appliances, and designer cabinetry, while the living area is highlighted by crown molding, LED lighting, plantation shutters, updated fixtures and new hurricane-impact windows. The spacious bedroom features a walk-in closet, and the renovated bath adds a clean, modern touch. In-unit laundry and the ease of single-level living provide everyday convenience. Castleton Gardens is a boutique, gated community offering a resort-st
Key facts
- Quartz countertops
- Led lighting
- New appliances
Tags
Property features AI
Finance
- Other: 32 units in complex; 10 units in building; 1 unit per floor; 1 floor total; Subdivision: Castleton Gardens; Restrictions include architectural controls, deeded restrictions, no commercial use, no RVs
- Financial info: Total annual recurring fees reported; One-time fees reported
- HOA & community: Quarterly condo fee; Condo fee covers cable, irrigation water, lawn/land maintenance, manager, exterior pest control, sewer and water; Professional management; Community amenities include BBQ/picnic area, beach access, bike storage, cabana, community pool, community spa/hot tub, and internet access; Gated community
Exterior
- Parking: 1 assigned parking space (common)
- Security: Gated community
- Utilities: Central water; Central sewer; Cable available
- Home design: Residential property; Low-rise (1-3 stories); Florida-style building; Rear exposure facing south; Located in Olde Naples
- Construction: Concrete block construction; Stucco exterior; Tile roof; Built in 1971
- Exterior features: Courtyard; Pool/club view; Central irrigation; Zero lot line
Interior
- Kitchen: Electric cooktop; Range; Microwave; Dishwasher; Garbage disposal; Refrigerator
- Bedrooms: 1 bedroom
- Flooring: Carpet; Tile
- Bathrooms: Master bath with shower only; 1 full bathroom
- Heating & cooling: Central electric heat; Central electric cooling
- Interior features: Cable prewire; Fire sprinkler system; High-speed internet available; Smoke detectors; Breakfast bar; Turnkey furnished
- Laundry & utility: Washer and dryer in residence
Neighborhood map
What this means for you Summary
Snapshot
- This is a 1-bed/1.0-bath condo listed at $550k.
Deal economics
- At list price, monthly cash flow is $-798 ($-10k/yr) — negative.
- To cash-flow at today's rent, offer at most $409k (25.6% below list).
- To meet the 1% rule (rent ≥ 1% of price), the offer needs to be $442k (19.7% below list).
- Recommended offer: $409k (25.6% below list) — sets the bar for cash-flow.
Location & tenants
- Location reads 80/100 on livability (#126 in FL, #1,903 nationally) — a professional / high-income tenant draw. Strengths: crime A+, amenities A+, employment A+; Watch: commute D+, cost of living F.
- Collier (suburban): math 60% / reading 56% proficiency, ranked #16 of 73 in FL (top 22%) — acceptable for families but not a draw, mixed tenant base, ~2y average lease.
- Zoned schools: Lake Park Elementary School (math 76% / reading 77%, grade A, #185 of 2,144 statewide, top 9%, 502 students, 39% FRL); Gulfview Middle School (math 78% / reading 68%, grade A, #44 of 571 statewide, top 8%, 582 students, 40% FRL); Naples High School (math 47% / reading 52%, grade D, #179 of 667 statewide, top 29%, 1,719 students, 39% FRL) — zoned schools average 39% FRL vs 55% district-wide (16 pts lower); this property's tenant base skews higher-income than the district average.
- Market conditions: Rents rising fast (+8.8%/yr); 616 active listings in the ZIP; 23 comparable units currently listed for rent nearby; rentals at typical pace (median 26d on market — plan ~3-4 weeks tenant-placement turnaround); high-income renter base; 3,520 units permitted in Collier County in 2024 (959 in 5+ unit buildings).
- This rent runs 40% of the median local income ($131k/yr) — at the standard rent-burdened threshold; future hikes will face affordability resistance.
Forward outlook
- In year one you build about $26k of equity ($4k loan paydown + $22k appreciation (4.1% local appreciation)).
- Collier County population projected at +30% by 2050 — long-run rental-demand tailwind backs the buy-and-hold thesis.
- By year 2, paydown + projected appreciation supports a ~$42k cash-out refi (75% LTV) — recoverable capital for the next deal without selling this one.
Negotiation context
- It's been on market 303 days — a 12% lower offer ($484k) is reasonable based on typical stale-listing flexibility.
- 2 sale attempts since 9y ago; this cycle's ask is 20% above the opening price — seller raised mid-cycle; expect resistance to lowballs.
- Current owner paid $305k; list at $550k implies a 80% gain — meaningful room to come down on a strong offer.
Risks & watch-outs
- Watch-outs: flood insurance adds $427/mo.
- Climate carrying-cost: in FEMA flood zone AE (mandatory federal flood insurance); severe wind risk, 99% chance of damaging wind over 30y; extreme-heat days projected 7→26/yr by 2055 (HVAC capex compounding) — expect insurance premiums to compound above CPI over the hold.
Questions for the listing agent
- What do current leases actually rent for vs. the listed asking? Can we see a recent rent roll and the last 12 months of T-12 income?
- It's been on market 303 days. Have you received any prior offers? Is the seller open to a 26% concession, seller financing, or rate buy-down credit?
- Built in 1971 — when were the roof, HVAC, electrical panel, plumbing, and water heater last replaced?
- What's the actual annual flood-insurance premium (NFIP or private), and is the property in a SFHA with mandatory coverage?
- What does the HOA fee cover, when was the last increase, and are there any pending special assessments or reserve-fund shortfalls?
- Any open or pending special assessments — roof, HVAC, plumbing, elevator, façade? What's the per-unit balance and payoff schedule, and is the seller paying it off at close or rolling it to the buyer?
- Why hasn't it sold? Are there any deal-killer items the seller is aware of (foundation, flood, title, zoning, code violations)?
- Is there a deadline driving the sale (1031 exchange, divorce, estate, relocation)? That informs how much negotiation room exists.
- Schools are B-rated — typically a magnet for longer-tenancy family renters. What's the average tenant stay here, and is there a school-zone premium baked into asking?
- The area grade is low — what's the realistic commute time and amenity access for the typical tenant pool here? Any planned neighborhood developments (good or bad) we should know about?
- What's the average days-on-market for RENTAL listings here right now (not sales)? A rising rental-DOM trend means longer vacancies and softer asking-rent achievability than the comps imply.
- What's the recent tenant-quality profile in this submarket — average credit score on applications, eviction rate, late-payment / NSF rate, and stable-employment percentage? A property-management company in the area should have these aggregated.
- How much new apartment / multifamily construction is in the pipeline within 1–3 miles? Heavy new supply (>2% of stock underway) typically softens rents 12–24 months out; light construction supports rent growth.
Investment metrics
- 1% rule
- 0.80% ✗
- Cap rate
- 5.48%
- Cash-on-cash
- -2.90%
- DSCR
- 0.87
- GRM
- 10.4
CMA / ARV
No comps found within radius.
Projected returns pro-forma
4.08% appreciation · 8.0% rent growth · sell at horizon
- IRR
- 7.4%
- Equity multiple
- 1.46×
- Total profit
- $71,328
- Equity at exit
- $281,546
- IRR
- 11.9%
- Equity multiple
- 3.15×
- Total profit
- $331,282
- Equity at exit
- $462,649
Cash invested: $154,000 (down + closing). Projections, not guarantees.
Landlord ↔ Tenant lean methodology
- Overall (STATE)
- 87 Strongly Landlord-Friendly
- State Florida
- 87 Strongly Landlord-Friendly · R+3
- County
- — inherits STATE
- City
- — inherits STATE
ZIP-level market 34102
- Home prices YoY
- 1.3%
- Rents YoY
- 8.8%
- Active inventory
- 616
- Price-to-rent
- 10.4×
Monthly cashflow live
- Estimated rent
- $4,418 high interval (Pro) →
- Mortgage (P&I)
- −$2,884
- Tax from tax record
- −$116 /mo · $1,389/yr
- Insurance
- −$229
- Flood insurance flood zone
- −$427 /mo · $5,118/yr
- HOA
- −$633
- Vacancy / Maint / Mgmt
- −$928
- Net cashflow
- $-798
Break-even live
Sensitivity live
| Price | -10% $-487 | -5% $-642 | +0% $-798 | +5% $-954 | +10% $-1,109 |
|---|---|---|---|---|---|
| Rent | -10% $-1,147 | -5% $-973 | +0% $-798 | +5% $-624 | +10% $-449 |
| Rate | -1.0pp $-521 | -0.5pp $-658 | base $-798 | +0.5pp $-941 | +1.0pp $-1,086 |
UW: 25.0% down · 7.5% · 30yr · 1.5% tax · 5.0% vac · 8.0% maint · 8.0% mgmt
Financing live
Cash to close
- Down payment
- $137,500
- Closing costs
- $16,500
- Reserves months
- —
- Total cash needed
- —
Loan-product check · same deal, 3 products live
Conventional
25% down · 7.5% · 30yr
- Down + closing
- —
- Monthly P&I
- —
- Monthly cashflow
- —
- DSCR
- —
- Eligible?
- —
Personal DTI + credit; lowest rate.
DSCR
20% down · 8.5% · 30yr
- Down + closing
- —
- Monthly P&I
- —
- Monthly cashflow
- —
- DSCR
- —
- Eligible?
- —
No personal income docs; deal must DSCR.
Hard money
10% down · 12.0% · 12mo
- Down + closing
- —
- Monthly P&I
- —
- Monthly cashflow
- —
- DSCR
- —
- Eligible?
- —
Short-term bridge; refi at stabilization.
Rent comps 23 comps
| Address | Beds | Baths | Sqft | Rent | $/sqft | DOM | Units | Dist |
|---|---|---|---|---|---|---|---|---|
| 950 7th Ave S #23 Naples, FL | 1.0 | 1.0 | 631 | $3,250 | $5.15 | 15d | 1 | 0.04mi |
| 980 7th Ave S Naples, FL | 1.0 | 1.0 | 540 | $7,500 | $13.89 | 25d | 2 | 0.06mi |
| 655 8th Ave S Unit 1504166P Naples, FL | 1.0 | 1.0 | 505 | $5,346 | $10.59 | 15d | 1 | 0.25mi |
| 960 7th St S #103 Naples, FL | 1.0 | 1.0 | 534 | $5,000 | $9.36 | 25d | 1 | 0.26mi |
| 803 River Point Dr Unit 201B Naples, FL | 1.0 | 1.0 | 715 | $2,300 | $3.22 | 25d | 1 | 0.36mi |
| 540 4th Ave S #13 Naples, FL | 1.0 | 1.0 | 580 | $5,000 | $8.62 | 25d | 1 | 0.42mi |
| 480 5th St S #102 Naples, FL | 1.0 | 1.0 | 600 | $6,500 | $10.83 | 25d | 1 | 0.46mi |
| 101 8th St S Naples, FL | 1.0 | 1.0–2.0 | 940 | $12,600 | $13.40 | 25d | 4 | 0.50mi |
| 101 8th St S Naples, FL | 1.0 | 1.0–2.0 | 940 | $12,600 | $13.40 | 15d | 4 | 0.50mi |
| 473 12th Ave S Naples, FL | 1.0–2.0 | 1.0–2.0 | 700 | $3,000 | $4.29 | 25d | 2 | 0.56mi |
| 666 3rd St S Naples, FL | 1.0–2.0 | 1.0–2.0 | 932 | $2,500 | $2.68 | 15d | 2 | 0.57mi |
| 940 3rd St S Naples, FL | 1.0–2.0 | 1.0–2.0 | 870 | $2,800 | $3.22 | 25d | 2 | 0.58mi |
| 291 8th Ave S Unit 291A Naples, FL | 1.0 | 1.0 | 550 | $3,900 | $7.09 | 25d | 1 | 0.59mi |
| 1360 Chesapeake Ave Unit 1372 Naples, FL | 1.0 | 1.0 | 600 | $1,850 | $3.08 | 25d | 1 | 0.67mi |
| 175 5th Ave S Naples, FL | 2.0 | 2.0 | 732 | $14,000 | $19.13 | 25d | 2 | 0.69mi |
| 1295 Gulf Shore Blvd S #218 Naples, FL | 2.0 | 2.0 | 662 | $10,479 | $15.83 | 25d | 1 | 0.83mi |
| 1950 Mayfair ST Unit 817 Naples, FL | 1.0 | 1.0 | 710 | $3,295 | $4.64 | 15d | 1 | 0.84mi |
| 1950 Mayfair ST Unit 1021 Naples, FL | 1.0 | 1.0 | 710 | $3,520 | $4.96 | 15d | 1 | 0.84mi |
| 1950 Mayfair ST Unit 921 Naples, FL | 1.0 | 1.0 | 710 | $3,420 | $4.82 | 15d | 1 | 0.84mi |
| 1950 Mayfair ST Unit 802 Naples, FL | 1.0 | 1.0 | 710 | $3,355 | $4.73 | 15d | 1 | 0.84mi |
| 1950 Mayfair ST Unit 716 Naples, FL | 1.0 | 1.0 | 710 | $3,330 | $4.69 | 15d | 1 | 0.84mi |
| 1950 Mayfair St Naples, FL | 3.0 | 1.0–3.5 | 1514 | $5,505 | $3.63 | 15d | 109 | 0.88mi |
| 2134 Palm St Naples, FL | 1.0 | 1.0 | 600 | $7,500 | $12.50 | 25d | 1 | 1.02mi |
HOA detail condo
- Monthly dues
- $633 · $7,596/yr
- Likely covers
- security
- Assessments
- None detected in remarks — confirm with the listing agent.
Listing history 19 events
-
2026-06-22days on market $550,000 Active 303 DOM
-
2026-06-18days on market $550,000 Active 300 DOM
-
2026-06-17days on market $550,000 Active 299 DOM
-
2026-06-16days on market $550,000 Active 298 DOM
-
2026-06-15days on market $550,000 Active 297 DOM
-
2026-06-10days on market $550,000 Active 292 DOM
-
2026-06-09days on market $550,000 Active 291 DOM
-
2026-06-08days on market $550,000 Active 290 DOM
-
2026-06-07days on market $550,000 Active 289 DOM
-
2026-06-02days on market $550,000 Active 284 DOM
-
2026-06-01days on market $550,000 Active 283 DOM
-
2026-05-31days on market $550,000 Active 282 DOM
-
2026-05-30days on market $550,000 Active 281 DOM
-
2026-01-28price $550,000
-
2025-08-22$459,000 Active
-
2019-01-09soldstatus $305,000
-
2018-04-09historical
-
2017-12-14$319,000 Active
-
2006-05-02soldstatus $419,000
ⓘ Source: listings_history table (triggers on properties + properties_extension) + one-shot
backfill from property_details.listing_events for pre-trigger history.
Tax reassessment forecast FL · Resets to sale price
- Current annual tax
- $1,389 · $116/mo
- Projected year-2 tax
- $4,565 · $380/mo
- Expected delta
- +$3,176/yr (+$265/mo · 228.7%)
ⓘ Screening estimate from a state-policy table — verify with the county assessor before closing.
Climate risk First Street
- Flood 9/10 Extreme FEMA zone AE · 99% chance over 30 yrs
- Wildfire 3/10 Moderate
- Heat 10/10 Extreme 7 d/yr ≥107°F today · 26 d/yr by 30 yrs out
- Wind 10/10 Extreme 99% chance of damaging wind over 30 yrs
- Air quality 3/10 Moderate 3 unhealthy d/yr today · 3 by 30 yrs out
Nearby sold comps map
Loading sold comps map…
Walkable amenities ~0.75 mi
Loading nearby amenities…
Taxation est. · year 1
- Rental income
- $53,022
- − Mortgage interest
- −$30,809
- − Property taxes
- −$1,389
- − Insurance
- −$7,868
- − Repairs & maintenance
- −$4,242
- − Management
- −$4,242
- − HOA
- −$7,596
- − Depreciation
- −$16,000
- Taxable loss
- −$19,124
- Est. tax savings @ 24.0%
- +$4,590
- After-tax cash flow
- $-4,988/yr
For passive investors: Depreciation is non-cash, so a rental often shows a tax loss while cash-flowing — sheltering income. Rental losses are passive: they offset passive income freely, and up to $25,000/yr can offset ordinary (W-2) income if you actively participate and your MAGI is under $100k (phasing out to $0 by $150k); unused losses carry forward. On sale, claimed depreciation is recaptured at up to 25%, and gains may owe capital-gains tax (a 1031 exchange can defer both). Figures are a year-1 estimate at your 24.0% rate — not tax advice; consult a CPA.
Schools (NCES district)
- District
- Collier
- NCES district ID
- 1200330
- Math proficiency
- 60% ▼ -4.00%
- Reading proficiency
- 56% ▼ -2.00%
- Median HH income
- $58,275
- Composite
- 50.23/100
- National rank
- #1892
- State rank
- #16 of 73 in FL
Livability — Naples
- Score
- 80/100
- State rank
- #126
- US rank
- #1903
Category grades
Schools grade is shown separately in the Schools card above.
Census & demographics
- Census place
- Naples, FL
- County
- Collier County · 396,295 people
- City population
- 344,941
- Metro
- Naples-Marco Island, FL
- Population (ZIP)
- 11,179
- Household income
- $130,929
- Rent vs Own
- Severe rent burden
- 333.0
Population outlook (Collier County) Hauer SSP2
- Today (2025)
- 420,858 people
- By 2030
- 450,054 · +6.9%
- By 2040
- 502,232 · +19.3%
- By 2050
- 544,932 · +29.5%
- By 2075
- 627,203 · +49.0%
- By 2100
- 659,015 · +56.6%
Race, ethnicity, and origin ACS 2023
- Neighborhood character
- Predominantly White (79%)
- Race & ethnicity
- White 79% Hispanic / Latino 9% Two or more races 8% Black 8% Asian 1%
- Hispanic origin (detail)
- Cuban 6%
- Common ancestry
- Hispanic 4% Lithuanian 4% Romanian 4%
- Foreign-born
- 17% · Canada, China
- Languages at home
- 87% English-only · Spanish 7% French/Haitian/Cajun 4% German/W. Germanic 1%
Political lean MEDSL · Collier
- 2024 margin
- Solid R (+33.1) · D 33.1% · R 66.2%
- 2008→2024 swing
- -10.6pp toward R · 2008: -22.5pp · 2024: -33.1pp
- All cycles
- 2024: R+33.1 2020: R+24.7 2016: R+26.0 2012: R+30.1 2008: R+22.5
Not yet ingested
- Civics
- —
Market trends
- HPI YoY
- ▲ 4.08%
- Current HPI
- 328.2755
- Rent YoY
- ▲ 8.75%
- Metro
- Naples-Marco Island, FL
- State GDP YoY
- ▲ 3.28%
- F500 in state
- 36
Industry mix (Fortune 500 HQ in FL)
| Industry | F500 HQs | Revenue |
|---|---|---|
| Industrial Technology | 2 | $29B |
|
||
| Insurance | 2 | $17B |
|
||
| Retail | 1 | $60B |
|
||
| Technology Distribution | 1 | $58B |
|
||
| Homebuilding | 1 | $35B |
|
||
| Technology Manufacturing | 1 | $35B |
|
||
Price history
+31.3% since first listed6 events — show timeline
- 2026-01-28 Price Changed $550,000 NAPLESMLS
- 2025-08-22 Listed $459,000 NAPLESMLS
- 2019-01-09 Sold (Public Records) $305,000 Public Records
- 2018-04-09 Listing Removed — NAPLESMLS
- 2017-12-14 Listed $319,000 NAPLESMLS
- 2006-05-02 Sold (Public Records) $419,000 Public Records
Property tax history
-0.9%/yrLatest (2025): $1,389 · -57.6% YoY. Source: county tax records.
Cash-flow waterfall
monthlySold comps — $/sqft
last 12 mo · ≤1 miLoading sold comps…