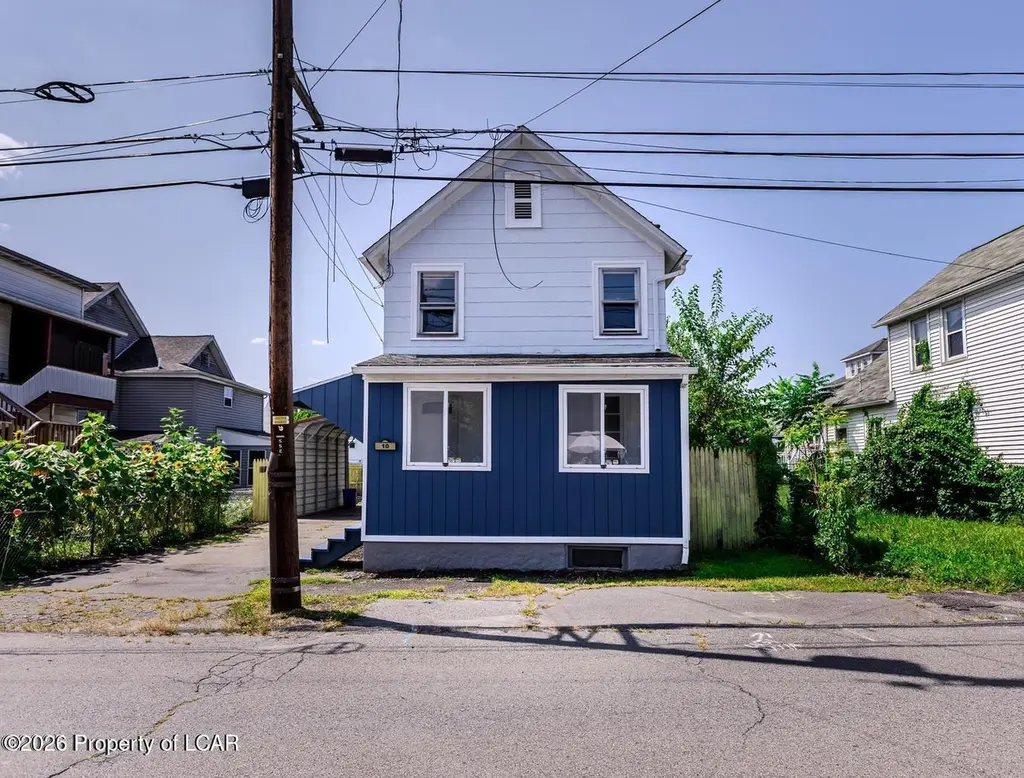
10 North St · Plains, PA
Flood risk 6/10 · Moderate
- FEMA flood zone
- AE
- Chance of flooding over 30 yrs
- 0.7%
- Est. flood insurance / yr
- $1,737 – $8,500
Fire risk 3/10 · Minor
- Est. fire insurance / yr
- $511 – $949
Heat risk 4/10 · Minor
- Hot days now (above 93°F)
- 7 days/yr
- Hot days in 30 yrs
- 17 days/yr
Wind risk 3/10 · Minor
- Chance of severe wind over 30 yrs
- 4.0%
Air-quality risk 2/10 · Minimal
- Unhealthy air days now
- 1 days/yr
- Unhealthy air days in 30 yrs
- 2 days/yr
Risk factors via First Street. Map © Google.
Why this score? — see what drove the B- grade
The composite is a weighted blend of 9 inputs, each scored 0–100. Each bar is that input's sub-score; the figure is the points it added to the 100-point composite (weight × sub-score).
- Cash flow +26.9/30.0
- ARV discount +15.0/15.0
- DSCR +9.3/10.0
- 1% rule +7.0/10.0
- Livability +3.9/5.0
- Rent growth +2.5/5.0
- Condition / age +2.5/5.0
- Schools +2.1/10.0
- Appreciation +0.0/10.0
$105,000
🖨 Deal sheet 📄 Offer letter ✓ Due diligence
Listing remarks
Opportunity awaits at 10 North Street in Plains Township! This 2-bedroom, 1-bath home offers over 1,000 square feet of living space and is perfect for investors, flippers, or buyers looking to build sweat equity. Featuring a functional layout and fenced yard. With solid potential and affordable pricing, this is a great opportunity to renovate, customize, or add to your investment portfolio.
Key facts
- Fenced yard
- Functional layout
- 3,520 sq ft lot
Tags
Property features AI
Exterior
- Utilities: Public water; Public sewer
- Home design: Single-family residential; Two levels
- Construction: Asbestos construction material
- Exterior features: Fenced yard
Interior
- Bathrooms: One full bathroom
- Heating & cooling: Natural gas heating; Heating present
- Interior features: Five total rooms; Basement
Neighborhood map
What this means for you Summary
Snapshot
- This is a 2-bed/1.0-bath single-family listed at $105k.
Deal economics
- At list price, monthly cash flow is $-134 ($-2k/yr) — negative.
- To cash-flow at today's rent, offer at most $81k (22.6% below list).
- Meets the 1% rule at list price ($1k rent vs $105k).
- Recommended offer: $81k (22.6% below list) — sets the bar for cash-flow.
- Cap rate 9.6% vs local median 4.8% in Plains — top-decile yield for the area; either an underpriced asset or a hidden risk that comps aren't pricing in. Stress-test before assuming the spread holds.
Location & tenants
- Location reads 78/100 on livability (#286 in PA, #2,528 nationally) — a middle-class / working-renter tenant base. Strengths: crime A+, cost of living A+, housing A+; Watch: schools C-, employment D+, amenities D.
- Wilkes-Barre Area SD (urban): math 19% / reading 32% proficiency, ranked #469 of 539 in PA (top 87%) — low school quality limits family demand, transient renter base, plan for 1-2y turnover; 61% free/reduced lunch — lower-income household profile, screen leases tightly.
- Market conditions: 74 active listings in the ZIP; 8 comparable units currently listed for rent nearby; rentals lingering (median 44d on market — plan ~5-8 weeks vacancy on turnover, expect pricing pressure); 50% of comp listings sitting > 30 days — soft ceiling on asking rent; 349 units permitted in Luzerne County in 2024 (16 in 5+ unit buildings).
Forward outlook
- Local home prices are declining (-3.0%/yr); year-one equity from $726 of loan paydown is wiped out by about $3k of value loss. Plan a longer hold.
- Luzerne County population projected at +4% by 2050 — modest demand growth; plan on rents tracking national, not racing it.
Negotiation context
- It's been on market 40 days — a 3% lower offer ($102k) is reasonable based on typical stale-listing flexibility.
Risks & watch-outs
- Watch-outs: flood insurance adds $427/mo; built in 1920 — expect roof / HVAC / electrical / plumbing capex.
- Climate carrying-cost: in FEMA flood zone AE (mandatory federal flood insurance) — expect insurance premiums to compound above CPI over the hold.
Questions for the listing agent
- What do current leases actually rent for vs. the listed asking? Can we see a recent rent roll and the last 12 months of T-12 income?
- It's been on market 40 days. Have you received any prior offers? Is the seller open to a 23% concession, seller financing, or rate buy-down credit?
- Built in 1920 — when were the roof, HVAC, electrical panel, plumbing, and water heater last replaced?
- What's the actual annual flood-insurance premium (NFIP or private), and is the property in a SFHA with mandatory coverage?
- Is there a deadline driving the sale (1031 exchange, divorce, estate, relocation)? That informs how much negotiation room exists.
- What's the average days-on-market for RENTAL listings here right now (not sales)? A rising rental-DOM trend means longer vacancies and softer asking-rent achievability than the comps imply.
- What's the recent tenant-quality profile in this submarket — average credit score on applications, eviction rate, late-payment / NSF rate, and stable-employment percentage? A property-management company in the area should have these aggregated.
- How much new for-sale + rental construction is in the pipeline within 1–3 miles? Heavy new supply typically softens prices + rents 12–24 months out; constrained supply supports both.
Investment metrics
- 1% rule
- 1.20% ✓
- Cap rate
- 9.63%
- Cash-on-cash
- 11.92%
- DSCR
- 1.53
- GRM
- 6.9
CMA / ARV
- ARV (median comp)
- $162,917
- List price
- $105,000
- Delta
- -35.55%
- Verdict
- UNDERPRICED
- Comps
- 20 within 1.0 mi
Show comp detail 9 sales within ~0.75 mi
| Address | Dist | Beds/Ba | Sqft | Sold | Price | $/sf | Match |
|---|---|---|---|---|---|---|---|
| 26 Kennedy Dr | 0.53mi | 2/1.0 | 1,060 (+0%) | 2mo | $221,600 | $209 | 73 |
| 29 Bergh St | 0.43mi | 2/1.0 | 1,040 (-2%) | 9mo | $112,500 | $108 | 70 |
| 173 St Clair St | 0.61mi | 2/1.0 | 1,056 (0%) | 21mo | $137,000 | $130 | 54 |
| 330 E Thomas St | 0.38mi | 3/1.5 (+1) | 1,175 (+11%) | 4mo | $245,000 | $209 | 53 |
| 10 Cook St | 0.39mi | 2/1.0 | 900 (-15%) | 7mo | $85,000 | $94 | 52 |
| 102 E Main Rear St | 0.47mi | 3/1.0 (+1) | 900 (-15%) | 0mo | $90,000 | $100 | 48 |
| 85 Saint Clair St | 0.74mi | 2/1.0 | 1,120 (+6%) | 14mo | $140,000 | $125 | 44 |
| 21 W Bergh St | 0.42mi | 3/1.0 (+1) | 1,186 (+12%) | 19mo | $151,500 | $128 | 39 |
| 69 Finn St | 0.53mi | 3/1.0 (+1) | 1,160 (+10%) | 20mo | $210,000 | $181 | 37 |
Match score weights: distance 35% · size 25% · config 20% · recency 20%. Top-matched comps best support the ARV.
Projected returns pro-forma
-3.0% appreciation · 3.0% rent growth · sell at horizon
- IRR
- -25.3%
- Equity multiple
- 0.14×
- Total profit
- $-25,307
- Equity at exit
- $15,656
- IRR
- -20.4%
- Equity multiple
- -0.09×
- Total profit
- $-31,972
- Equity at exit
- $9,078
Cash invested: $29,400 (down + closing). Projections, not guarantees.
Landlord ↔ Tenant lean methodology
- Overall (STATE)
- 62 Landlord-Friendly
- State Pennsylvania
- 62 Landlord-Friendly · EVEN
- County
- — inherits STATE
- City
- — inherits STATE
ZIP-level market 18705
- Home prices YoY
- -22.7%
- Active inventory
- 74
- Price-to-rent
- 6.9×
Monthly cashflow live
- Estimated rent
- $1,261 high interval (Pro) →
- Mortgage (P&I)
- −$551
- Tax from tax record
- −$110 /mo · $1,319/yr
- Insurance
- −$44
- Flood insurance flood zone
- −$427 /mo · $5,118/yr
- HOA
- −$0
- Vacancy / Maint / Mgmt
- −$265
- Net cashflow
- $-134
Break-even live
UW: 25.0% down · 7.5% · 30yr · 1.5% tax · 5.0% vac · 8.0% maint · 8.0% mgmt
Financing live
Cash to close
- Down payment
- $26,250
- Closing costs
- $3,150
- Reserves months
- —
- Total cash needed
- —
Loan-product check · same deal, 3 products live
Conventional
25% down · 7.5% · 30yr
- Down + closing
- —
- Monthly P&I
- —
- Monthly cashflow
- —
- DSCR
- —
- Eligible?
- —
Personal DTI + credit; lowest rate.
DSCR
20% down · 8.5% · 30yr
- Down + closing
- —
- Monthly P&I
- —
- Monthly cashflow
- —
- DSCR
- —
- Eligible?
- —
No personal income docs; deal must DSCR.
Hard money
10% down · 12.0% · 12mo
- Down + closing
- —
- Monthly P&I
- —
- Monthly cashflow
- —
- DSCR
- —
- Eligible?
- —
Short-term bridge; refi at stabilization.
Rent comps 8 comps
| Address | Beds | Baths | Sqft | Rent | $/sqft | DOM | Units | Dist |
|---|---|---|---|---|---|---|---|---|
| 19 Center St Plains, PA | 2.0 | 1.5 | 1100 | $1,295 | $1.18 | 43d | 1 | 0.05mi |
| 214 Mayock St Unit 3 Wilkes-Barre, PA | 2.0 | 1.0 | 1000 | $1,150 | $1.15 | 43d | 1 | 0.39mi |
| 26 E Carey St Apt 4 Wilkes-Barre, PA | 3.0 | 1.0 | 1050 | $1,300 | $1.24 | 13d | 1 | 0.95mi |
| 17 E Carey St Unit 3 Wilkes-Barre, PA | 2.0 | 1.0 | 1000 | $1,200 | $1.20 | 43d | 1 | 0.98mi |
| 13 Charles St Unit 15 Wilkes-Barre, PA | 3.0 | 1.0 | 1300 | $1,550 | $1.19 | 13d | 1 | 1.14mi |
| 102 Maffett St Wilkes-Barre, PA | 1.0 | 1.0 | 800 | $1,200 | $1.50 | 43d | 1 | 1.20mi |
| 123 W Carey St Wilkes Barre, PA | 3.0 | 2.0 | 1375 | $1,650 | $1.20 | 13d | 1 | 1.37mi |
| 680 Wildflower Dr Wilkes-Barre, PA | 1.0–2.0 | 1.0 | 1116 | $3,815 | $3.42 | 13d | 1 | 1.47mi |
Listing history 18 events
-
2026-06-18days on market $105,000 Active 40 DOM
-
2026-06-17days on market $105,000 Active 39 DOM
-
2026-06-16days on market $105,000 Active 38 DOM
-
2026-06-15days on market $105,000 Active 37 DOM
-
2026-06-14days on market $105,000 Active 35 DOM
-
2026-06-13days on market $105,000 Active 34 DOM
-
2026-06-10days on market $105,000 Active 32 DOM
-
2026-06-09days on market $105,000 Active 31 DOM
-
2026-06-08days on market $105,000 Active 30 DOM
-
2026-06-07days on market $105,000 Active 29 DOM
-
2026-06-03price $105,000 Active 24 DOM
-
2026-06-02days on market $115,000 Active 24 DOM
-
2026-06-01days on market $115,000 Active 23 DOM
-
2026-05-31days on market $115,000 Active 22 DOM
-
2026-05-30days on market $115,000 Active 21 DOM
-
2026-05-10$115,000 Active 393-char remark
-
2025-09-24price $114,000
-
2025-09-02price $119,000
ⓘ Source: listings_history table (triggers on properties + properties_extension) + one-shot
backfill from property_details.listing_events for pre-trigger history.
Tax reassessment forecast PA · Partial reset (capped growth)
- Current annual tax
- $1,319 · $110/mo
- Projected year-2 tax
- $1,489 · $124/mo
- Expected delta
- +$170/yr (+$14/mo · 12.9%)
ⓘ Screening estimate from a state-policy table — verify with the county assessor before closing.
Climate risk First Street
- Flood 6/10 Major FEMA zone AE · 70% chance over 30 yrs
- Wildfire 3/10 Moderate
- Heat 4/10 Moderate 7 d/yr ≥93°F today · 17 d/yr by 30 yrs out
- Wind 3/10 Moderate 4% chance of damaging wind over 30 yrs
- Air quality 2/10 Low 1 unhealthy d/yr today · 2 by 30 yrs out
Nearby sold comps map
Loading sold comps map…
Walkable amenities ~0.75 mi
Loading nearby amenities…
Taxation est. · year 1
- Rental income
- $15,136
- − Mortgage interest
- −$5,882
- − Property taxes
- −$1,319
- − Insurance
- −$5,644
- − Repairs & maintenance
- −$1,211
- − Management
- −$1,211
- − Depreciation
- −$3,055
- Taxable loss
- −$3,185
- Est. tax savings @ 24.0%
- +$764
- After-tax cash flow
- $-849/yr
For passive investors: Depreciation is non-cash, so a rental often shows a tax loss while cash-flowing — sheltering income. Rental losses are passive: they offset passive income freely, and up to $25,000/yr can offset ordinary (W-2) income if you actively participate and your MAGI is under $100k (phasing out to $0 by $150k); unused losses carry forward. On sale, claimed depreciation is recaptured at up to 25%, and gains may owe capital-gains tax (a 1031 exchange can defer both). Figures are a year-1 estimate at your 24.0% rate — not tax advice; consult a CPA.
Schools (NCES district)
- District
- Wilkes-Barre Area SD
- NCES district ID
- 4226300
- Math proficiency
- 19% ▼ -2.00%
- Reading proficiency
- 32% ▼ -9.00%
- Median HH income
- $37,420
- Composite
- 21.22/100
- National rank
- #8409
- State rank
- #469 of 539 in PA
Livability — Plains
- Score
- 78/100
- State rank
- #286
- US rank
- #2528
Category grades
Schools grade is shown separately in the Schools card above.
Census & demographics
- County
- Luzerne County · 118,885 people
- Metro
- Scranton--Wilkes-Barre, PA
- Population (ZIP)
- 15,624
- Household income
- $59,344
- Rent vs Own
- Severe rent burden
- 549.0
Population outlook (Luzerne County) Hauer SSP2
- Today (2025)
- 319,505 people
- By 2030
- 319,943 · +0.1%
- By 2040
- 322,643 · +1.0%
- By 2050
- 330,817 · +3.5%
- By 2075
- 379,145 · +18.7%
- By 2100
- 431,908 · +35.2%
Race, ethnicity, and origin ACS 2023
- Neighborhood character
- Predominantly White (68%)
- Race & ethnicity
- White 68% Hispanic / Latino 22% Two or more races 11% Black 4%
- Hispanic origin (detail)
- Mexican 7% Puerto Rican 5% Dominican 9%
- Common ancestry
- Romanian 19% Scotch-Irish 3% Polish 2%
- Foreign-born
- 11% · Canada
- Languages at home
- 79% English-only · Spanish 17% Other Indo-European 2% Russian/Polish/Slavic 1%
Political lean MEDSL · Luzerne
- 2024 margin
- R (+19.2) · D 40.0% · R 59.2%
- 2008→2024 swing
- -27.6pp toward R · 2008: 8.4pp · 2024: -19.2pp
- All cycles
- 2024: R+19.2 2020: R+14.4 2016: R+19.6 2012: D+4.8 2008: D+8.4
Not yet ingested
- Civics
- —
Market trends
- HPI YoY
- ▼ -71.77%
- Current HPI
- 243.9176
- Rent YoY
- —
- Metro
- Scranton--Wilkes-Barre, PA
- State GDP YoY
- ▲ 1.68%
- F500 in state
- 34
Industry mix (Fortune 500 HQ in PA)
| Industry | F500 HQs | Revenue |
|---|---|---|
| Healthcare | 2 | $309B |
|
||
| Insurance | 2 | $27B |
|
||
| Telecommunications / Media | 1 | $124B |
|
||
| Industrial Distribution | 1 | $22B |
|
||
| Financial Services | 1 | $20B |
|
||
| Chemicals / Materials | 1 | $18B |
|
||
Price history
-11.8% since first listed4 events — show timeline
- 2026-06-02 Price Changed $105,000 LCAR
- 2026-05-10 Listed $115,000 LCAR
- 2025-09-24 Price Changed $114,000 LCAR
- 2025-09-02 Price Changed $119,000 LCAR
Property tax history
+1.6%/yrLatest (2026): $1,319 · +4.2% YoY. Source: county tax records.
Cash-flow waterfall
monthlySold comps — $/sqft
last 12 mo · ≤1 miLoading sold comps…