5738 Shady Nook Ct · Loveland, CO
Flood risk 1/10 · Minimal
- FEMA flood zone
- X (unshaded)
- Chance of flooding over 30 yrs
- 0.0%
- Est. flood insurance / yr
- $507 – $1,088
Fire risk 7/10 · Major
- Est. fire insurance / yr
- $939 – $1,743
Heat risk 3/10 · Minor
- Hot days now (above 92°F)
- 7 days/yr
- Hot days in 30 yrs
- 16 days/yr
Wind risk 1/10 · Minimal
- Chance of severe wind over 30 yrs
- —
Air-quality risk 5/10 · Moderate
- Unhealthy air days now
- 9 days/yr
- Unhealthy air days in 30 yrs
- 10 days/yr
Risk factors via First Street. Map © Google.
Why this score? — see what drove the B grade
The composite is a weighted blend of 9 inputs, each scored 0–100. Each bar is that input's sub-score; the figure is the points it added to the 100-point composite (weight × sub-score).
- Cash flow +30.0/30.0
- DSCR +10.0/10.0
- 1% rule +9.3/10.0
- ARV discount +7.5/15.0
- Condition / age +4.0/5.0
- Livability +3.7/5.0
- Schools +3.4/10.0
- Rent growth +3.3/5.0
- Appreciation +0.0/10.0
$139,999
🖨 Deal sheet 📄 Offer letter ✓ Due diligence
Listing remarks
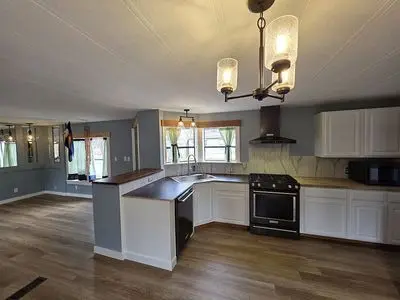
$139,999 | Fully Remodeled | Corner Lot | Turnkey Recently remodeled 3 bed / 2 bath manufactured home in Alpine Vista Village in Loveland. Approx. 1,216 sq. ft. on a corner lot with modern finishes, great natural light, two new decks, usable outdoor space, and sunset views from the property. Home is located on a leased lot in Alpine Vista Village, lot rent is approximately $1100/month. Buyer must be approved by Alpine Vista Village. Park rules and lot rent apply. The home has a clean, solid, finished feel throughout, with updates inside and out. The main living area has an open kitchen/living layout with new flooring, updated trim, hardware, fresh finishes, and warm wood accents. The kitch
Key facts
- Fully remodeled
- Usable outdoor space
- Modern finishes
Tags
Neighborhood map
What this means for you Summary
Snapshot
- This is a 3-bed/2.0-bath other listed at $140k. Condition is rated good.
Deal economics
- At list price, monthly cash flow is $611 ($7k/yr) — positive.
- The deal already cash-flows at list — no discount required.
- Meets the 1% rule at list price ($2k rent vs $140k).
- Recommended offer: $136k (3.0% below list) — sets the bar for market timing.
- Cap rate 11.5% vs local median 2.9% in Loveland — top-decile yield for the area; either an underpriced asset or a hidden risk that comps aren't pricing in. Stress-test before assuming the spread holds.
Location & tenants
- Location reads 73/100 on livability (#52 in CO) — a middle-class / working-renter tenant base. Strengths: housing A+, health & safety A+, amenities A; Watch: crime C-, commute F, cost of living F.
- Thompson School District R-2J (suburban): math 28% / reading 48% proficiency, ranked #28 of 86 in CO (top 33%) — families likely to look elsewhere, expect single-tenant / working-renter base with shorter leases.
- Market conditions: Rents rising (+3.1%/yr); 436 active listings in the ZIP; 9 comparable units currently listed for rent nearby; rentals at typical pace (median 23d on market — plan ~3-4 weeks tenant-placement turnaround); solid renter incomes; 1,786 units permitted in Larimer County in 2024 (402 in 5+ unit buildings).
Forward outlook
- Local home prices are declining (-3.0%/yr); year-one equity from $968 of loan paydown is wiped out by about $4k of value loss. Plan a longer hold.
- Larimer County population projected at +51% by 2050 — long-run rental-demand tailwind backs the buy-and-hold thesis.
- At projected returns (-3.0% appreciation + 3.1% rent growth), your $39k cash investment doubles in ~7 years — after that, you're playing with house money.
Negotiation context
- It's been on market 37 days — a 3% lower offer ($136k) is reasonable based on typical stale-listing flexibility.
Risks & watch-outs
- Climate carrying-cost: major wildfire risk — expect insurance premiums to compound above CPI over the hold.
Questions for the listing agent
- It's been on market 37 days. Have you received any prior offers? Is the seller open to a 3% concession, seller financing, or rate buy-down credit?
- Is there a deadline driving the sale (1031 exchange, divorce, estate, relocation)? That informs how much negotiation room exists.
- What's the average days-on-market for RENTAL listings here right now (not sales)? A rising rental-DOM trend means longer vacancies and softer asking-rent achievability than the comps imply.
- What's the recent tenant-quality profile in this submarket — average credit score on applications, eviction rate, late-payment / NSF rate, and stable-employment percentage? A property-management company in the area should have these aggregated.
- How much new for-sale + rental construction is in the pipeline within 1–3 miles? Heavy new supply typically softens prices + rents 12–24 months out; constrained supply supports both.
Investment metrics
- 1% rule
- 1.43% ✓
- Cap rate
- 11.53%
- Cash-on-cash
- 18.71%
- DSCR
- 1.83
- GRM
- 5.8
CMA / ARV
No comps found within radius.
Projected returns pro-forma
-3.0% appreciation · 3.11% rent growth · sell at horizon
- IRR
- 10.6%
- Equity multiple
- 1.42×
- Total profit
- $16,494
- Equity at exit
- $20,874
- IRR
- 19.8%
- Equity multiple
- 2.67×
- Total profit
- $65,522
- Equity at exit
- $12,105
Cash invested: $39,200 (down + closing). Projections, not guarantees.
Landlord ↔ Tenant lean methodology
- Overall (STATE)
- 38 Tenant-Leaning
- State Colorado
- 38 Tenant-Leaning · D+4
- County
- — inherits STATE
- City
- — inherits STATE
ZIP-level market 80538
- Rents YoY
- 3.1%
- Active inventory
- 436
- Price-to-rent
- 5.8×
Monthly cashflow live
- Estimated rent
- $1,998 high interval (Pro) →
- Mortgage (P&I)
- −$734
- Tax est. 1.5%
- −$175 /mo · $2,100/yr
- Insurance
- −$58
- HOA
- −$0
- Vacancy / Maint / Mgmt
- −$420
- Net cashflow
- $611
Break-even live
UW: 25.0% down · 7.5% · 30yr · 1.5% tax · 5.0% vac · 8.0% maint · 8.0% mgmt
Financing live
Cash to close
- Down payment
- $35,000
- Closing costs
- $4,200
- Reserves months
- —
- Total cash needed
- —
Loan-product check · same deal, 3 products live
Conventional
25% down · 7.5% · 30yr
- Down + closing
- —
- Monthly P&I
- —
- Monthly cashflow
- —
- DSCR
- —
- Eligible?
- —
Personal DTI + credit; lowest rate.
DSCR
20% down · 8.5% · 30yr
- Down + closing
- —
- Monthly P&I
- —
- Monthly cashflow
- —
- DSCR
- —
- Eligible?
- —
No personal income docs; deal must DSCR.
Hard money
10% down · 12.0% · 12mo
- Down + closing
- —
- Monthly P&I
- —
- Monthly cashflow
- —
- DSCR
- —
- Eligible?
- —
Short-term bridge; refi at stabilization.
Rent comps 9 comps
| Address | Beds | Baths | Sqft | Rent | $/sqft | DOM | Units | Dist |
|---|---|---|---|---|---|---|---|---|
| 6444 Eden Garden Dr Loveland, CO | 1.0–3.0 | 1.0–2.0 | 1033 | $2,200 | $2.13 | 23d | 1 | 0.61mi |
| 4950 Basswood Dr Unit 4952 Loveland, CO | 2.0 | 1.0 | 930 | $1,495 | $1.61 | 13d | 1 | 0.61mi |
| 4952 Basswood Dr Loveland, CO | 2.0 | 1.0 | 930 | $1,619 | $1.74 | 13d | 1 | 0.61mi |
| 4927 Basswood Dr Loveland, CO | 2.0 | 1.0 | 900 | $1,695 | $1.88 | 13d | 1 | 0.65mi |
| 4885 Basswood Dr Loveland, CO | 2.0 | 2.0 | 894 | $1,595 | $1.78 | 23d | 1 | 0.71mi |
| 4838 Basswood Dr Loveland, CO | 2.0 | 1.0 | 936 | $1,433 | $1.53 | 23d | 1 | 0.74mi |
| 4832 Basswood Dr Unit 4838 Loveland, CO | 2.0 | 1.0 | 936 | $1,300 | $1.39 | 23d | 1 | 0.74mi |
| 4830 N Grant Ave Loveland, CO | 1.0–3.0 | 1.0–2.0 | 866 | $1,925 | $2.22 | 23d | 1 | 0.77mi |
| 1375 W 45th St Loveland, CO | 3.0 | 2.0 | 1221 | $2,480 | $2.03 | 23d | 1 | 1.37mi |
Listing history 16 events
-
2026-06-18days on market $139,999 Active 37 DOM
-
2026-06-17days on market $139,999 Active 36 DOM
-
2026-06-16days on market $139,999 Active 35 DOM
-
2026-06-15days on market $139,999 Active 34 DOM
-
2026-06-14days on market $139,999 Active 32 DOM
-
2026-06-13days on market $139,999 Active 31 DOM
-
2026-06-10days on market $139,999 Active 29 DOM
-
2026-06-09days on market $139,999 Active 28 DOM
-
2026-06-08days on market $139,999 Active 27 DOM
-
2026-06-07days on market $139,999 Active 26 DOM
-
2026-06-03days on market $139,999 Active 22 DOM
-
2026-06-02days on market $139,999 Active 21 DOM
-
2026-06-01days on market $139,999 Active 20 DOM
-
2026-05-31days on market $139,999 Active 19 DOM
-
2026-05-30days on market $139,999 Active 18 DOM
-
2026-05-13$139,999 Active
ⓘ Source: listings_history table (triggers on properties + properties_extension) + one-shot
backfill from property_details.listing_events for pre-trigger history.
Climate risk First Street
- Flood 1/10 Low FEMA zone X (unshaded) · 0% chance over 30 yrs
- Wildfire 7/10 Severe
- Heat 3/10 Moderate 7 d/yr ≥92°F today · 16 d/yr by 30 yrs out
- Wind 1/10 Low
- Air quality 5/10 Major 9 unhealthy d/yr today · 10 by 30 yrs out
Nearby sold comps map
Loading sold comps map…
Walkable amenities ~0.75 mi
Loading nearby amenities…
Taxation est. · year 1
- Rental income
- $23,980
- − Mortgage interest
- −$7,842
- − Property taxes
- −$2,100
- − Insurance
- −$700
- − Repairs & maintenance
- −$1,918
- − Management
- −$1,918
- − Depreciation
- −$4,073
- Taxable income
- $5,429
- Est. tax owed @ 24.0%
- −$1,303
- After-tax cash flow
- $6,032/yr
For passive investors: Depreciation is non-cash, so a rental often shows a tax loss while cash-flowing — sheltering income. Rental losses are passive: they offset passive income freely, and up to $25,000/yr can offset ordinary (W-2) income if you actively participate and your MAGI is under $100k (phasing out to $0 by $150k); unused losses carry forward. On sale, claimed depreciation is recaptured at up to 25%, and gains may owe capital-gains tax (a 1031 exchange can defer both). Figures are a year-1 estimate at your 24.0% rate — not tax advice; consult a CPA.
Condition & rehab AI · 1 photo
This recently remodeled home offers a clean, modern interior with new flooring and fresh finishes, making it ready for move-in. Exterior painting and gutter maintenance would further enhance its curb appeal and value.
Value-add opportunities
- Both Paint exterior — Enhances curb appeal and resale value
- Both Clean and maintain gutters — Improves drainage and overall home appearance
Renovation cost estimate screening
Value-add ROI direction
- Both Paint exterior — Enhances curb appeal and resale value ↑
- Both Clean and maintain gutters — Improves drainage and overall home appearance ↑
ⓘ Cost ranges are severity-bucket heuristics (US national rule-of-thumb). Get contractor quotes + a written scope before underwriting a rehab budget.
Schools (NCES district)
- District
- Thompson School District R-2J
- NCES district ID
- 0805400
- Math proficiency
- 28% ▼ -7.00%
- Reading proficiency
- 48% ▬ 0.00%
- Median HH income
- $63,040
- Composite
- 34.01/100
- National rank
- #5313
- State rank
- #28 of 86 in CO
Livability — Loveland
- Score
- 73/100
- State rank
- #52
- US rank
- #5353
Category grades
Schools grade is shown separately in the Schools card above.
Census & demographics
- County
- Larimer County · 338,255 people
- City population
- 94,535
- Metro
- Fort Collins, CO
- Population (ZIP)
- 50,110
- Household income
- $86,671
- Rent vs Own
- Severe rent burden
- 1447.0
Population outlook (Larimer County) Hauer SSP2
- Today (2025)
- 415,361 people
- By 2030
- 457,762 · +10.2%
- By 2040
- 542,310 · +30.6%
- By 2050
- 627,048 · +51.0%
- By 2075
- 833,722 · +100.7%
- By 2100
- 952,590 · +129.3%
Race, ethnicity, and origin ACS 2023
- Neighborhood character
- Predominantly White (80%)
- Race & ethnicity
- White 80% Hispanic / Latino 15% Two or more races 10% Black 1%
- Hispanic origin (detail)
- Mexican 12%
- Common ancestry
- Italian 5% Lithuanian 3% Slovak 3%
- Foreign-born
- 4% · Canada, China
- Languages at home
- 93% English-only · Spanish 6%
Political lean MEDSL · Larimer
- 2024 margin
- D (+17.6) · D 57.4% · R 39.8% · Other 2.9%
- 2008→2024 swing
- +7.9pp toward D · 2008: 9.7pp · 2024: 17.6pp
- All cycles
- 2024: D+17.6 2020: D+15.4 2016: D+4.9 2012: D+5.2 2008: D+9.7
Not yet ingested
- Civics
- —
Market trends
- HPI YoY
- ▼ -515.25%
- Current HPI
- 242.9397
- Rent YoY
- ▲ 3.11%
- Metro
- Fort Collins, CO
- State GDP YoY
- ▲ 1.95%
- F500 in state
- 14
Industry mix (Fortune 500 HQ in CO)
| Industry | F500 HQs | Revenue |
|---|---|---|
| Technology Distribution | 1 | $31B |
|
||
| Food / Agriculture | 1 | $18B |
|
||
| Packaging | 1 | $14B |
|
||
| Healthcare | 1 | $13B |
|
||
| Energy | 1 | $10B |
|
||
| Technology | 1 | $4B |
|
||
Price history
1 event — show timeline
- 2026-05-13 Listed $139,999 FSBO.com
Cash-flow waterfall
monthlySold comps — $/sqft
last 12 mo · ≤1 miLoading sold comps…