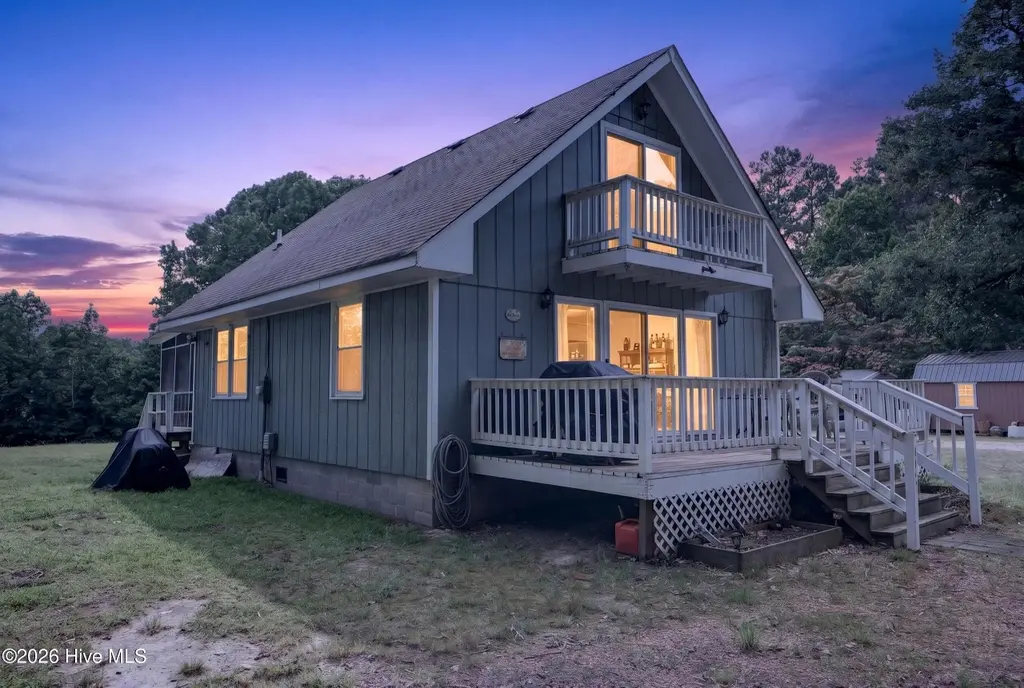
115 Pirate Cove Way · Hertford, NC
Flood risk 8/10 · Major
- FEMA flood zone
- X (unshaded)
- Chance of flooding over 30 yrs
- 0.97%
- Est. flood insurance / yr
- $507 – $1,088
Fire risk 2/10 · Minimal
- Est. fire insurance / yr
- $906 – $1,684
Heat risk 9/10 · Severe
- Hot days now (above 106°F)
- 7 days/yr
- Hot days in 30 yrs
- 17 days/yr
Wind risk 8/10 · Major
- Chance of severe wind over 30 yrs
- 99.0%
Air-quality risk 1/10 · Minimal
- Unhealthy air days now
- 0 days/yr
- Unhealthy air days in 30 yrs
- 0 days/yr
Risk factors via First Street. Map © Google.
Why this score? — see what drove the D grade
The composite is a weighted blend of 9 inputs, each scored 0–100. Each bar is that input's sub-score; the figure is the points it added to the 100-point composite (weight × sub-score).
- Appreciation +10.0/10.0
- Cash flow +8.5/30.0
- ARV discount +7.5/15.0
- Schools +3.9/10.0
- Livability +2.9/5.0
- Rent growth +2.5/5.0
- Condition / age +2.5/5.0
- DSCR +2.3/10.0
- 1% rule +1.6/10.0
$219,000
🖨 Deal sheet 📄 Offer letter ✓ Due diligence
Listing remarks
Looking for an affordable waterfront retreat? Welcome to 115 Pirate Cove Way, a charming canal-front property offering quick and easy access to the Albemarle Sound. Conveniently located near the Holiday Island community boat ramp, this home is also just a short distance from the community pool, clubhouse, and waterfront access area. Designed for relaxation and recreation, this 3-bedroom, 1.5-bath home is an ideal weekend getaway or vacation retreat. Enjoy outdoor living on the spacious front deck, perfect for grilling and soaking up the sun, or unwind on the screened rear porch overlooking the peaceful canal. Situated just a few miles off Highway 17, this property offers a quiet country set
Key facts
- 0.24 acre lot
- Community pool
- Built 1976
Property features AI
Finance
- HOA & community: Homeowners association with annual fee of $36 (about $3/month); Community clubhouse; Community pool
Exterior
- Parking: Unpaved parking
- Utilities: Public water; Septic tank sewer; Cable available; Water connected
- Home design: Single-family residence; One and one-half levels (2 stories); Entry level: 1; Located in Holiday Island subdivision
- Construction: Frame construction; See remarks for additional construction details; Block foundation; Built (year not specified)
- Exterior features: Deck; Canal-front waterfront; Has a view; No fencing; Shingle roof
Interior
- Kitchen: Refrigerator; Electric range
- Flooring: Carpet
- Bathrooms: 1 full bathroom; 1 half bathroom
- Heating & cooling: Baseboard heating (electric); Wall/window cooling units; Ceiling fan(s)
- Interior features: Ceiling fan(s); Unfurnished; Total of 5 rooms; No basement
- Laundry & utility: Washer hookup; Electric water heater
Neighborhood map
What this means for you Summary
Snapshot
- This is a 2-bed/1.5-bath other listed at $219k.
Deal economics
- At list price, monthly cash flow is $-260 ($-3k/yr) — negative.
- To cash-flow at today's rent, offer at most $173k (21.0% below list).
- To meet the 1% rule (rent ≥ 1% of price), the offer needs to be $144k (34.4% below list).
- Recommended offer: $144k (34.4% below list) — sets the bar for 1% rule.
- Cap rate 5.2% vs local median 2.2% in Hertford — top-decile yield for the area; either an underpriced asset or a hidden risk that comps aren't pricing in. Stress-test before assuming the spread holds.
Location & tenants
- Location reads 58/100 on livability (#570 in NC) — a working-class tenant base; expect higher turnover. Strengths: cost of living A+, housing A+, crime A; Watch: amenities F, commute F, employment F.
- Perquimans County Schools (rural): math 44% / reading 48% proficiency, ranked #83 of 178 in NC (top 47%) — families likely to look elsewhere, expect single-tenant / working-renter base with shorter leases.
- Zoned schools: Perquimans Central (391 students, 65% FRL); Perquimans County Middle (math 39% / reading 48%, grade D, #182 of 475 statewide, top 40%, 366 students, 59% FRL); Perquimans County High (math 47% / reading 42%, grade F, #352 of 535 statewide, top 68%, 518 students, 59% FRL).
- Market conditions: 339 active listings in the ZIP; 46 units permitted in Perquimans County in 2024 (0 in 5+ unit buildings).
Forward outlook
- In year one you build about $23k of equity ($2k loan paydown + $22k appreciation (10.0% local appreciation)).
- Perquimans County population projected at -16% by 2050 — secular population decline; favor cash flow + early exit over multi-decade hold.
- By year 2, paydown + projected appreciation supports a ~$38k cash-out refi (75% LTV) — recoverable capital for the next deal without selling this one.
Negotiation context
- Only 6 days on market — expect competitive offers; lowballing is unlikely to land.
- Current owner paid $76k; list at $219k implies a 188% gain — meaningful room to come down on a strong offer.
Risks & watch-outs
- Watch-outs: flood insurance adds $66/mo.
- Climate carrying-cost: severe flood risk; severe wind risk, 99% chance of damaging wind over 30y; extreme-heat days projected 7→17/yr by 2055 (HVAC capex compounding) — expect insurance premiums to compound above CPI over the hold.
Questions for the listing agent
- What do current leases actually rent for vs. the listed asking? Can we see a recent rent roll and the last 12 months of T-12 income?
- Built in 1976 — when were the roof, HVAC, electrical panel, plumbing, and water heater last replaced?
- What's the actual annual flood-insurance premium (NFIP or private), and is the property in a SFHA with mandatory coverage?
- What does the HOA fee cover, when was the last increase, and are there any pending special assessments or reserve-fund shortfalls?
- Is there a deadline driving the sale (1031 exchange, divorce, estate, relocation)? That informs how much negotiation room exists.
- Schools are F-rated, which usually means shorter tenancies and higher turnover. Who's the typical renter profile here, and what's been the actual vacancy rate?
- The area grade is low — what's the realistic commute time and amenity access for the typical tenant pool here? Any planned neighborhood developments (good or bad) we should know about?
- What's the average days-on-market for RENTAL listings here right now (not sales)? A rising rental-DOM trend means longer vacancies and softer asking-rent achievability than the comps imply.
- What's the recent tenant-quality profile in this submarket — average credit score on applications, eviction rate, late-payment / NSF rate, and stable-employment percentage? A property-management company in the area should have these aggregated.
- How much new for-sale + rental construction is in the pipeline within 1–3 miles? Heavy new supply typically softens prices + rents 12–24 months out; constrained supply supports both.
Investment metrics
- 1% rule
- 0.66% ✗
- Cap rate
- 5.23%
- Cash-on-cash
- -3.79%
- DSCR
- 0.83
- GRM
- 12.7
CMA / ARV
No comps found within radius.
Projected returns pro-forma
10.0% appreciation · 3.0% rent growth · sell at horizon
- IRR
- 20.7%
- Equity multiple
- 2.67×
- Total profit
- $102,648
- Equity at exit
- $197,293
- IRR
- 18.8%
- Equity multiple
- 6.14×
- Total profit
- $315,214
- Equity at exit
- $425,469
Cash invested: $61,320 (down + closing). Projections, not guarantees.
Landlord ↔ Tenant lean methodology
- Overall (STATE)
- 85 Strongly Landlord-Friendly
- State North Carolina
- 85 Strongly Landlord-Friendly · R+3
- County
- — inherits STATE
- City
- — inherits STATE
ZIP-level market 27944
- Home prices YoY
- 9.5%
- Active inventory
- 339
- Price-to-rent
- 12.7×
Monthly cashflow live
- Estimated rent
- $1,436 medium interval (Pro) →
- Mortgage (P&I)
- −$1,148
- Tax from tax record
- −$86 /mo · $1,028/yr
- Insurance
- −$91
- Flood insurance flood zone
- −$66 /mo · $798/yr
- HOA
- −$3
- Vacancy / Maint / Mgmt
- −$302
- Net cashflow
- $-260
Break-even live
UW: 25.0% down · 7.5% · 30yr · 1.5% tax · 5.0% vac · 8.0% maint · 8.0% mgmt
Financing live
Cash to close
- Down payment
- $54,750
- Closing costs
- $6,570
- Reserves months
- —
- Total cash needed
- —
Loan-product check · same deal, 3 products live
Conventional
25% down · 7.5% · 30yr
- Down + closing
- —
- Monthly P&I
- —
- Monthly cashflow
- —
- DSCR
- —
- Eligible?
- —
Personal DTI + credit; lowest rate.
DSCR
20% down · 8.5% · 30yr
- Down + closing
- —
- Monthly P&I
- —
- Monthly cashflow
- —
- DSCR
- —
- Eligible?
- —
No personal income docs; deal must DSCR.
Hard money
10% down · 12.0% · 12mo
- Down + closing
- —
- Monthly P&I
- —
- Monthly cashflow
- —
- DSCR
- —
- Eligible?
- —
Short-term bridge; refi at stabilization.
HOA detail
- Monthly dues
- $3 · $36/yr
- Likely covers
- waterpool
Listing history 5 events
-
2026-06-19days on market $219,000 Active 6 DOM
-
2026-06-18days on market $219,000 Active 5 DOM
-
2026-06-17days on market $219,000 Active 4 DOM
-
2026-06-17remarks 699-char remark
-
2026-06-17$219,000 Active 3 DOM
ⓘ Source: listings_history table (triggers on properties + properties_extension) + one-shot
backfill from property_details.listing_events for pre-trigger history.
Tax reassessment forecast NC · Resets to sale price
- Current annual tax
- $1,028 · $86/mo
- Projected year-2 tax
- $1,796 · $150/mo
- Expected delta
- +$768/yr (+$64/mo · 74.7%)
ⓘ Screening estimate from a state-policy table — verify with the county assessor before closing.
Climate risk First Street
- Flood 8/10 Severe FEMA zone X (unshaded) · 97% chance over 30 yrs
- Wildfire 2/10 Low
- Heat 9/10 Extreme 7 d/yr ≥106°F today · 17 d/yr by 30 yrs out
- Wind 8/10 Severe 99% chance of damaging wind over 30 yrs
- Air quality 1/10 Low 0 unhealthy d/yr today · 0 by 30 yrs out
Nearby sold comps map
Loading sold comps map…
Walkable amenities ~0.75 mi
Loading nearby amenities…
Taxation est. · year 1
- Rental income
- $17,234
- − Mortgage interest
- −$12,267
- − Property taxes
- −$1,028
- − Insurance
- −$1,892
- − Repairs & maintenance
- −$1,379
- − Management
- −$1,379
- − HOA
- −$36
- − Depreciation
- −$6,371
- Taxable loss
- −$7,118
- Est. tax savings @ 24.0%
- +$1,708
- After-tax cash flow
- $-1,414/yr
For passive investors: Depreciation is non-cash, so a rental often shows a tax loss while cash-flowing — sheltering income. Rental losses are passive: they offset passive income freely, and up to $25,000/yr can offset ordinary (W-2) income if you actively participate and your MAGI is under $100k (phasing out to $0 by $150k); unused losses carry forward. On sale, claimed depreciation is recaptured at up to 25%, and gains may owe capital-gains tax (a 1031 exchange can defer both). Figures are a year-1 estimate at your 24.0% rate — not tax advice; consult a CPA.
Schools (NCES district)
- District
- Perquimans County Schools
- NCES district ID
- 3703600
- Math proficiency
- 44% ▲ 6.00%
- Reading proficiency
- 48% ▲ 7.00%
- Median HH income
- $42,593
- Composite
- 38.75/100
- National rank
- #4124
- State rank
- #83 of 178 in NC
Livability — Hertford
- Score
- 58/100
- State rank
- #570
- US rank
- #21148
Category grades
Schools grade is shown separately in the Schools card above.
Census & demographics
- Population (ZIP)
- 11,255
Population outlook (Perquimans County) Hauer SSP2
- Today (2025)
- 13,018 people
- By 2030
- 12,716 · -2.3%
- By 2040
- 11,895 · -8.6%
- By 2050
- 10,981 · -15.6%
- By 2075
- 8,931 · -31.4%
- By 2100
- 7,101 · -45.5%
Race, ethnicity, and origin ACS 2023
- Neighborhood character
- Predominantly White (71%)
- Race & ethnicity
- White 71% Black 20% Two or more races 5% Hispanic / Latino 3%
- Common ancestry
- Lithuanian 3% Serbian 2% Slovak 2%
- Foreign-born
- 3% · Canada, China, Dominican Republic
- Languages at home
- 96% English-only · Spanish 3%
Political lean MEDSL · Perquimans
- 2024 margin
- Solid R (+39.4) · D 29.7% · R 69.1% · Other 1.2%
- 2008→2024 swing
- -25.4pp toward R · 2008: -13.9pp · 2024: -39.4pp
- All cycles
- 2024: R+39.4 2020: R+32.2 2016: R+28.1 2012: R+16.1 2008: R+13.9
Not yet ingested
- Civics
- —
Market trends
- HPI YoY
- ▲ 22.77%
- Current HPI
- 261.91
- Rent YoY
- —
- Metro
- —
- State GDP YoY
- ▲ 3.28%
- F500 in state
- 26
Industry mix (Fortune 500 HQ in NC)
| Industry | F500 HQs | Revenue |
|---|---|---|
| Financial Services | 2 | $213B |
|
||
| Retail | 2 | $95B |
|
||
| Industrial Conglomerate | 1 | $38B |
|
||
| Metals / Steel | 1 | $35B |
|
||
| Utilities | 1 | $30B |
|
||
| Industrial Machinery | 1 | $19B |
|
||
Price history
+188.2% since first listed2 events — show timeline
- 2026-06-12 Listed $219,000 Hive MLS
- 2011-09-08 Sold (Public Records) $76,000 Public Records
Property tax history
+3.9%/yrLatest (2025): $1,028 · +1.5% YoY. Source: county tax records.
Cash-flow waterfall
monthlySold comps — $/sqft
last 12 mo · ≤1 miLoading sold comps…