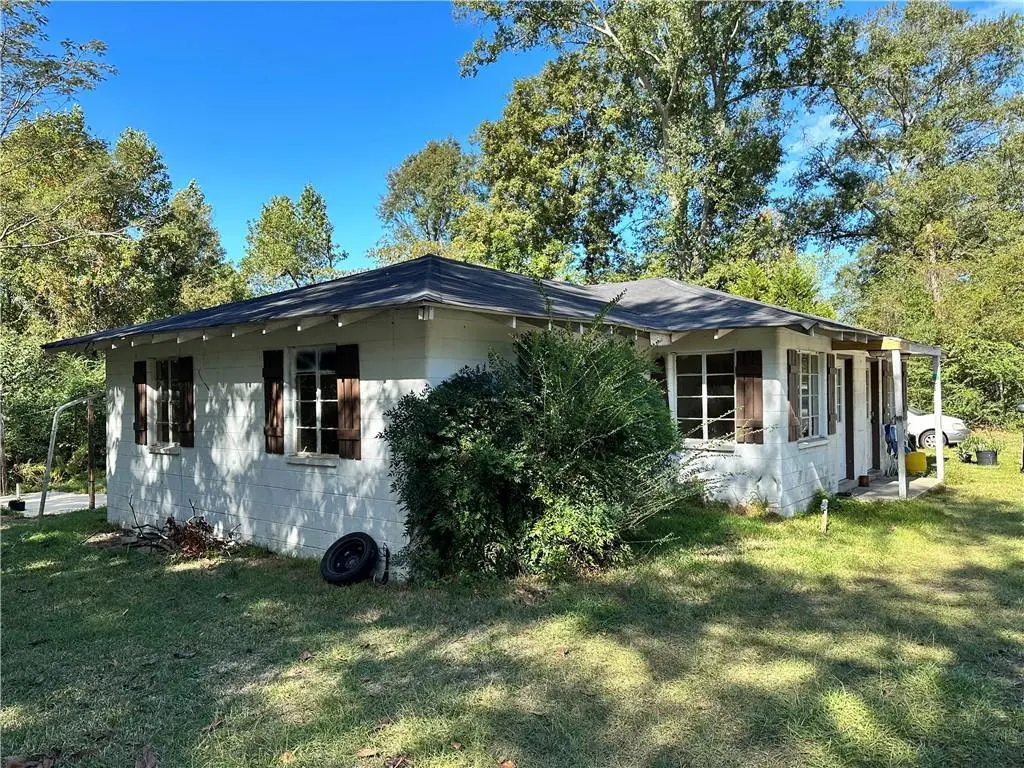
20115 3rd St N · Citronelle, AL
Flood risk 1/10 · Minimal
- FEMA flood zone
- X (unshaded)
- Chance of flooding over 30 yrs
- 0.0%
- Est. flood insurance / yr
- $507 – $1,088
Fire risk 5/10 · Moderate
- Est. fire insurance / yr
- $916 – $1,700
Heat risk 8/10 · Major
- Hot days now (above 108°F)
- 7 days/yr
- Hot days in 30 yrs
- 20 days/yr
Wind risk 9/10 · Severe
- Chance of severe wind over 30 yrs
- 99.0%
Air-quality risk 1/10 · Minimal
- Unhealthy air days now
- 0 days/yr
- Unhealthy air days in 30 yrs
- 0 days/yr
Risk factors via First Street. Map © Google.
Why this score? — see what drove the A- grade
The composite is a weighted blend of 9 inputs, each scored 0–100. Each bar is that input's sub-score; the figure is the points it added to the 100-point composite (weight × sub-score).
- Cash flow +30.0/30.0
- ARV discount +15.0/15.0
- DSCR +10.0/10.0
- Appreciation +10.0/10.0
- 1% rule +7.8/10.0
- Livability +3.1/5.0
- Rent growth +2.5/5.0
- Condition / age +2.5/5.0
- Schools +2.3/10.0
$125,000
🖨 Deal sheet (PDF) 📄 Offer letter ✓ Due diligence
Listing remarks MLS
INVESTOR SPECIAL (2 UNIT) DUPLEX 2 BD 1 BTH EACH.SITTING ON 3 ACRES WITH PLENTY OF ROOM TO BUILD MORE DUPLEXES IF DESIRED CURRENTLY ZONED RESIDENTIAL BUT COULD BE COMMERCIAL AS WELL. NORTH UNIT HAS BEEN RECENTLY RENOVATED WITH NEW VINYL FLOOR COVERINGS, KITCHEN CABINETS, TOILET, VANITY, INTERIOR DOORS, FRESH PAINT. CURRENTLY RENTAL INCOME IS APROX. $1400 MONTHLY COMBINED.
Key facts
- 2 unit duplex
- 3 acres
- Listed 163 days
Tags
Neighborhood map
What this means for you Summary
Snapshot
- This is a 4-bed/2.0-bath single-family listed at $125k.
Deal economics
- At list price, monthly cash flow is $513 ($6k/yr) — positive.
- The deal already cash-flows at list — no discount required.
- Meets the 1% rule at list price ($2k rent vs $125k).
- Recommended offer: $110k (12.0% below list) — sets the bar for market timing.
- Cap rate 11.2% vs local median 5.2% in Citronelle — top-decile yield for the area; either an underpriced asset or a hidden risk that comps aren't pricing in. Stress-test before assuming the spread holds.
Location & tenants
- Location reads 61/100 on livability (#254 in AL) — a middle-class / working-renter tenant base. Strengths: crime A+, cost of living A+, housing B+; Watch: employment C-, schools F, amenities F.
- Mobile County (urban): math 15% / reading 39% proficiency, ranked #81 of 129 in AL (top 63%) — low school quality limits family demand, transient renter base, plan for 1-2y turnover; 67% free/reduced lunch — lower-income household profile, screen leases tightly.
- Market conditions: 63 active listings in the ZIP; 1 comparable units currently listed for rent nearby; 1,678 units permitted in Mobile County in 2024 (264 in 5+ unit buildings).
Forward outlook
- In year one you build about $13k of equity ($864 loan paydown + $12k appreciation (10.0% local appreciation)).
- Mobile County population projected to shrink 8% by 2050 — rents likely to lag national; underwrite the cash flow, not the appreciation.
- At projected returns (10.0% appreciation + 3.0% rent growth), your $35k cash investment doubles in ~2 years — after that, you're playing with house money.
- By year 3, paydown + projected appreciation supports a ~$34k cash-out refi (75% LTV) — recoverable capital for the next deal without selling this one.
Negotiation context
- It's been on market 163 days — a 12% lower offer ($110k) is reasonable based on typical stale-listing flexibility.
Risks & watch-outs
- Climate carrying-cost: severe wind risk, 99% chance of damaging wind over 30y; moderate wildfire risk; extreme-heat days projected 7→20/yr by 2055 (HVAC capex compounding) — expect insurance premiums to compound above CPI over the hold.
Questions for the listing agent
- It's been on market 163 days. Have you received any prior offers? Is the seller open to a 12% concession, seller financing, or rate buy-down credit?
- Why hasn't it sold? Are there any deal-killer items the seller is aware of (foundation, flood, title, zoning, code violations)?
- Is there a deadline driving the sale (1031 exchange, divorce, estate, relocation)? That informs how much negotiation room exists.
- Schools are F-rated, which usually means shorter tenancies and higher turnover. Who's the typical renter profile here, and what's been the actual vacancy rate?
- What's the average days-on-market for RENTAL listings here right now (not sales)? A rising rental-DOM trend means longer vacancies and softer asking-rent achievability than the comps imply.
- What's the recent tenant-quality profile in this submarket — average credit score on applications, eviction rate, late-payment / NSF rate, and stable-employment percentage? A property-management company in the area should have these aggregated.
- How much new for-sale + rental construction is in the pipeline within 1–3 miles? Heavy new supply typically softens prices + rents 12–24 months out; constrained supply supports both.
Investment metrics
- 1% rule
- 1.28% ✓
- Cap rate
- 11.22%
- Cash-on-cash
- 17.58%
- DSCR
- 1.78
- GRM
- 6.5
CMA / ARV
- ARV (median comp)
- $156,508
- List price
- $125,000
- Delta
- -20.13%
- Verdict
- UNDERPRICED
- Comps
- 1 within 2.0 mi
Show comp detail 6 sales within ~0.75 mi
| Address | Dist | Beds/Ba | Sqft | Sold | Price | $/sf | Match |
|---|---|---|---|---|---|---|---|
| 19860 Indiana St | 0.41mi | 3/2.0 (-1) | 1,500 (-2%) | 5mo | $190,500 | $127 | 69 |
| 20080 3rd St N | 0.09mi | 3/2.0 (-1) | 1,731 (+13%) | 11mo | $230,000 | $133 | 60 |
| 8450 Craft Dr | 0.67mi | 3/2.0 (-1) | 1,512 (-1%) | 10mo | $235,000 | $155 | 53 |
| 19645 N 5th St | 0.74mi | 3/2.0 (-1) | 1,455 (-5%) | 8mo | $168,500 | $116 | 46 |
| 19855 Indiana St | 0.39mi | 3/2.0 (-1) | 1,691 (+10%) | 20mo | $225,000 | $133 | 42 |
| 8350 Grove Park | 0.68mi | 3/1.5 (-1) | 1,680 (+10%) | 9mo | $191,500 | $114 | 37 |
Match score weights: distance 35% · size 25% · config 20% · recency 20%. Top-matched comps best support the ARV.
Projected returns pro-forma
10.0% appreciation · 3.0% rent growth · sell at horizon
- IRR
- 37.3%
- Equity multiple
- 3.88×
- Total profit
- $100,694
- Equity at exit
- $112,610
- IRR
- 32.1%
- Equity multiple
- 8.74×
- Total profit
- $270,753
- Equity at exit
- $242,848
Cash invested: $35,000 (down + closing). Projections, not guarantees.
Landlord ↔ Tenant lean methodology
- Overall (STATE)
- 90 Strongly Landlord-Friendly
- State Alabama
- 90 Strongly Landlord-Friendly · R+15
- County
- — inherits STATE
- City
- — inherits STATE
ZIP-level market 36522
- Home prices YoY
- 11.8%
- Active inventory
- 63
- Price-to-rent
- 6.5×
Monthly cashflow live
- Estimated rent
- $1,600 medium interval (Pro) →
- Mortgage (P&I)
- −$656
- Tax from tax record
- −$44 /mo · $523/yr
- Insurance
- −$52
- HOA
- −$0
- Vacancy / Maint / Mgmt
- −$336
- Net cashflow
- $513
Break-even live
Sensitivity live
| Price | -10% $584 | -5% $548 | +0% $513 | +5% $477 | +10% $442 |
|---|---|---|---|---|---|
| Rent | -10% $386 | -5% $450 | +0% $513 | +5% $576 | +10% $639 |
| Rate | -1.0pp $576 | -0.5pp $545 | base $513 | +0.5pp $480 | +1.0pp $447 |
UW: 25.0% down · 7.5% · 30yr · 1.5% tax · 5.0% vac · 8.0% maint · 8.0% mgmt
Financing live
Cash to close
- Down payment
- $31,250
- Closing costs
- $3,750
- Reserves months
- —
- Total cash needed
- —
Loan-product check · same deal, 3 products live
Conventional
25% down · 7.5% · 30yr
- Down + closing
- —
- Monthly P&I
- —
- Monthly cashflow
- —
- DSCR
- —
- Eligible?
- —
Personal DTI + credit; lowest rate.
DSCR
20% down · 8.5% · 30yr
- Down + closing
- —
- Monthly P&I
- —
- Monthly cashflow
- —
- DSCR
- —
- Eligible?
- —
No personal income docs; deal must DSCR.
Hard money
10% down · 12.0% · 12mo
- Down + closing
- —
- Monthly P&I
- —
- Monthly cashflow
- —
- DSCR
- —
- Eligible?
- —
Short-term bridge; refi at stabilization.
Rent comps 1 comps
| Address | Beds | Baths | Sqft | Rent | $/sqft | DOM | Units | Dist |
|---|---|---|---|---|---|---|---|---|
| 8685 W Williams St Citronelle, AL | 3.0 | 2.0 | 1716 | $1,600 | $0.93 | 14d | 1 | 0.96mi |
Listing history 21 events
-
2026-06-18days on market $125,000 Active 163 DOM
-
2026-06-17days on market $125,000 Active 162 DOM
-
2026-06-16days on market $125,000 Active 161 DOM
-
2026-06-15days on market $125,000 Active 160 DOM
-
2026-06-14days on market $125,000 Active 158 DOM
-
2026-06-13days on market $125,000 Active 157 DOM
-
2026-06-10days on market $125,000 Active 155 DOM
-
2026-06-09days on market $125,000 Active 154 DOM
-
2026-06-08days on market $125,000 Active 153 DOM
-
2026-06-07days on market $125,000 Active 152 DOM
-
2026-06-05days on market $125,000 Active 149 DOM
-
2026-06-03days on market $125,000 Active 148 DOM
-
2026-06-02days on market $125,000 Active 147 DOM
-
2026-06-01days on market $125,000 Active 146 DOM
-
2026-05-31days on market $125,000 Active 145 DOM
-
2026-05-30days on market $125,000 Active 144 DOM
-
2026-03-17price $125,000 374-char remark
Show marketing remark (374 chars)
INVESTOR SPECIAL (2 UNIT) DUPLEX 2 BD 1 BTH EACH.SITTING ON 3 ACRES WITH PLENTY OF ROOM TO BUILD MORE DUPLEXES IF DESIRED CURRENTLY ZONED RESIDENTIAL BUT COULD BE COMMERCIAL AS WELL. NORTH UNIT HAS BEEN RECENTLY RENOVATED WITH NEW VINYL FLOOR COVERINGS, KITCHEN CABINETS, TOILET, VANITY, INTERIOR DOORS, FRESH PAINT. CURRENTLY RENTAL INCOME IS APROX. $1400 MONTHLY COMBINED.
-
2026-01-06$110,000 Active 374-char remark
Show marketing remark (374 chars)
INVESTOR SPECIAL (2 UNIT) DUPLEX 2 BD 1 BTH EACH.SITTING ON 3 ACRES WITH PLENTY OF ROOM TO BUILD MORE DUPLEXES IF DESIRED CURRENTLY ZONED RESIDENTIAL BUT COULD BE COMMERCIAL AS WELL. NORTH UNIT HAS BEEN RECENTLY RENOVATED WITH NEW VINYL FLOOR COVERINGS, KITCHEN CABINETS, TOILET, VANITY, INTERIOR DOORS, FRESH PAINT. CURRENTLY RENTAL INCOME IS APROX. $1400 MONTHLY COMBINED.
-
2025-09-02price $124,999
-
2025-05-20price $125,000
-
2025-02-03price $150,000
ⓘ Source: listings_history table (triggers on properties + properties_extension) + one-shot
backfill from property_details.listing_events for pre-trigger history.
Tax reassessment forecast AL · Resets to sale price
- Current annual tax
- $523 · $44/mo
- Projected year-2 tax
- $523 · $44/mo
- Expected delta
- $0/yr ($0/mo · 0.0%)
ⓘ Screening estimate from a state-policy table — verify with the county assessor before closing.
Climate risk First Street
- Flood 1/10 Low FEMA zone X (unshaded) · 0% chance over 30 yrs
- Wildfire 5/10 Major
- Heat 8/10 Severe 7 d/yr ≥108°F today · 20 d/yr by 30 yrs out
- Wind 9/10 Extreme 99% chance of damaging wind over 30 yrs
- Air quality 1/10 Low 0 unhealthy d/yr today · 0 by 30 yrs out
Nearby sold comps map
Loading sold comps map…
Walkable amenities ~0.75 mi
Loading nearby amenities…
Taxation est. · year 1
- Rental income
- $19,200
- − Mortgage interest
- −$7,002
- − Property taxes
- −$523
- − Insurance
- −$625
- − Repairs & maintenance
- −$1,536
- − Management
- −$1,536
- − Depreciation
- −$3,636
- Taxable income
- $4,341
- Est. tax owed @ 24.0%
- −$1,042
- After-tax cash flow
- $5,112/yr
For passive investors: Depreciation is non-cash, so a rental often shows a tax loss while cash-flowing — sheltering income. Rental losses are passive: they offset passive income freely, and up to $25,000/yr can offset ordinary (W-2) income if you actively participate and your MAGI is under $100k (phasing out to $0 by $150k); unused losses carry forward. On sale, claimed depreciation is recaptured at up to 25%, and gains may owe capital-gains tax (a 1031 exchange can defer both). Figures are a year-1 estimate at your 24.0% rate — not tax advice; consult a CPA.
Schools (NCES district)
- District
- Mobile County
- NCES district ID
- 0102370
- Math proficiency
- 15% ▼ -28.00%
- Reading proficiency
- 39% ▬ 0.00%
- Median HH income
- $42,455
- Composite
- 22.9/100
- National rank
- #8002
- State rank
- #81 of 129 in AL
Livability — Citronelle
- Score
- 61/100
- State rank
- #254
- US rank
- #17928
Category grades
Schools grade is shown separately in the Schools card above.
Census & demographics
- Census place
- Citronelle, AL
- City population
- 6,892
- Population (ZIP)
- 6,892
Population outlook (Mobile County) Hauer SSP2
- Today (2025)
- 415,303 people
- By 2030
- 411,755 · -0.9%
- By 2040
- 399,670 · -3.8%
- By 2050
- 382,616 · -7.9%
- By 2075
- 337,353 · -18.8%
- By 2100
- 283,391 · -31.8%
Race, ethnicity, and origin ACS 2023
- Neighborhood character
- Predominantly White (69%)
- Race & ethnicity
- White 69% Black 18% Two or more races 7%
- Common ancestry
- Slovak 3% Lithuanian 3% Italian 2%
- Foreign-born
- 1%
- Languages at home
- 98% English-only · Other Indo-European 1%
Political lean MEDSL · Mobile
- 2024 margin
- R (+16.4) · D 41.3% · R 57.7%
- 2008→2024 swing
- -7.7pp toward R · 2008: -8.7pp · 2024: -16.4pp
- All cycles
- 2024: R+16.4 2020: R+11.9 2016: R+13.9 2012: R+9.3 2008: R+8.7
Not yet ingested
- Civics
- —
Market trends
- HPI YoY
- ▲ 27.55%
- Current HPI
- 260.4914
- Rent YoY
- —
- Metro
- —
- State GDP YoY
- ▲ 2.94%
- F500 in state
- 4
Industry mix (Fortune 500 HQ in AL)
| Industry | F500 HQs | Revenue |
|---|---|---|
| Financial Services | 1 | $8B |
|
||
| Healthcare | 1 | $5B |
|
||
Price history
-16.7% since first listed5 events — show timeline
- 2026-03-17 Price Changed $125,000 GCMLS AL
- 2026-01-06 Listed $110,000 GCMLS AL
- 2025-09-02 Price Changed $124,999 GCMLS AL
- 2025-05-20 Price Changed $125,000 GCMLS AL
- 2025-02-03 Price Changed $150,000 GCMLS AL
Property tax history
+0.3%/yrLatest (2025): $523 · +4.6% YoY. Source: county tax records.
Cash-flow waterfall
monthlySold comps — $/sqft
last 12 mo · ≤1 miLoading sold comps…