 🌊 Lakefront
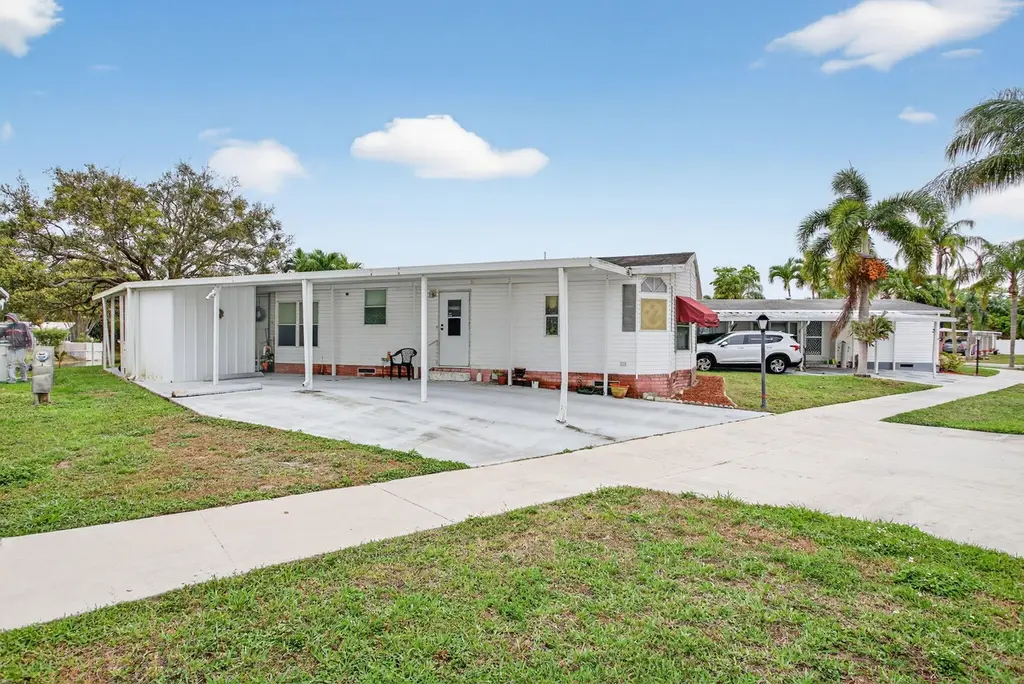
6482 NW 37th Ave · Coconut Creek, FL
Flood risk 1/10 · Minimal
- FEMA flood zone
- X (unshaded)
- Chance of flooding over 30 yrs
- 0.0%
- Est. flood insurance / yr
- $507 – $1,088
Fire risk 1/10 · Minimal
- Est. fire insurance / yr
- $947 – $1,759
Heat risk 9/10 · Severe
- Hot days now (above 107°F)
- 7 days/yr
- Hot days in 30 yrs
- 25 days/yr
Wind risk 10/10 · Severe
- Chance of severe wind over 30 yrs
- 99.0%
Air-quality risk 3/10 · Minor
- Unhealthy air days now
- 2 days/yr
- Unhealthy air days in 30 yrs
- 3 days/yr
Risk factors via First Street. Map © Google.
Why this score? — see what drove the B- grade
The composite is a weighted blend of 9 inputs, each scored 0–100. Each bar is that input's sub-score; the figure is the points it added to the 100-point composite (weight × sub-score).
- Cash flow +26.7/30.0
- DSCR +9.2/10.0
- 1% rule +7.8/10.0
- ARV discount +7.5/15.0
- Appreciation +4.6/10.0
- Livability +4.2/5.0
- Schools +4.1/10.0
- Rent growth +2.9/5.0
- Condition / age +2.5/5.0
$260,000
🖨 Deal sheet 📄 Offer letter ✓ Due diligence
Listing remarks
You own the land! 3/2 Manufactured home located in Tallowwood Isles one of the best and cleanest 55+ mobile / manufactured home communities in South Florida! This large home (1,614 sqft) sits on a small lake with water views. The home was built in 1992 and is clean and in good shape. Tallanwood Isles is centrally located and just a short drive to the famous Deerfield Beach as well as Boca Raton with easy access to the Sawgrass, Turnpike and I-95. This home features a split bedroom plan and has a large kitchen and dining area. Driveway holds four cars two under the carport and the home also has a carport storage area. Large screened patio over looks the lake and is prefect for entertaining
Key facts
- Water views
- Dining area
- Large kitchen
Tags
Property features AI
Finance
- Financial info: Pets allowed (cats and dogs permitted)
- HOA & community: Association with monthly fee; Monthly association fee includes grounds maintenance, common areas, recreation facility, and pool service; Community pool; Senior community
Exterior
- Parking: Attached carport; Covered parking; Driveway; One covered/carport space plus two open spaces (4 total parking spaces)
- Security: Smoke detectors
- Utilities: Public water; Public sewer; Electricity available; Cable available; Phone available
- Home design: Manufactured home (double wide); Single-story; First floor entry; Faces west; Resale condition
- Construction: Frame construction; Composition / shingle roof; Built as a double wide
- Exterior features: Screened porch; Porch; Outbuilding / shed / storage; Lake access
Interior
- Kitchen: Dishwasher; Electric range; Gas range; Microwave; Refrigerator; Disposal; Trash compactor; Owned water purifier; Owned water softener; Electric water heater
- Bedrooms: Three bedrooms on the main level
- Flooring: Carpet; Tile
- Bathrooms: Two full bathrooms on the main level
- Heating & cooling: Central heating; Central air conditioning; Ceiling fans
- Interior features: Built-in features; Vaulted ceilings; Split bedroom layout
- Laundry & utility: Laundry room on the main level (inside)
Neighborhood map
What this means for you Summary
Snapshot
- This is a 3-bed/2.0-bath manufactured listed at $260k.
Deal economics
- At list price, monthly cash flow is $704 ($8k/yr) — positive.
- The deal already cash-flows at list — no discount required.
- Meets the 1% rule at list price ($3k rent vs $260k).
- Recommended offer: $244k (6.0% below list) — sets the bar for market timing.
- Cap rate 9.5% vs local median 3.7% in Coconut Creek — top-decile yield for the area; either an underpriced asset or a hidden risk that comps aren't pricing in. Stress-test before assuming the spread holds.
Location & tenants
- Location reads 85/100 on livability (#30 in FL, #617 nationally) — a professional / high-income tenant draw. Strengths: commute A+, housing A+, health & safety A+; Watch: amenities F.
- Broward (suburban): math 42% / reading 53% proficiency, ranked #46 of 73 in FL (top 63%) — families likely to look elsewhere, expect single-tenant / working-renter base with shorter leases.
- Market conditions: Rents rising (+1.6%/yr); 150 active listings in the ZIP; 40 comparable units currently listed for rent nearby; rentals at typical pace (median 17d on market — plan ~3-4 weeks tenant-placement turnaround); solid renter incomes; 2,111 units permitted in Broward County in 2024 (1,265 in 5+ unit buildings).
- This rent runs 41% of the median local income ($97k/yr) — at the standard rent-burdened threshold; future hikes will face affordability resistance.
Forward outlook
- Local home prices are declining (-0.8%/yr); year-one equity from $2k of loan paydown is wiped out by about $2k of value loss. Plan a longer hold.
- Broward County population projected at +34% by 2050 — long-run rental-demand tailwind backs the buy-and-hold thesis.
- At projected returns (-0.8% appreciation + 1.6% rent growth), your $73k cash investment doubles in ~8 years — after that, you're playing with house money.
Negotiation context
- It's been on market 90 days — a 6% lower offer ($244k) is reasonable based on typical stale-listing flexibility.
Risks & watch-outs
- Climate carrying-cost: severe wind risk, 99% chance of damaging wind over 30y; extreme-heat days projected 7→25/yr by 2055 (HVAC capex compounding) — expect insurance premiums to compound above CPI over the hold.
Questions for the listing agent
- It's been on market 90 days. Have you received any prior offers? Is the seller open to a 6% concession, seller financing, or rate buy-down credit?
- What does the HOA fee cover, when was the last increase, and are there any pending special assessments or reserve-fund shortfalls?
- Why hasn't it sold? Are there any deal-killer items the seller is aware of (foundation, flood, title, zoning, code violations)?
- Is there a deadline driving the sale (1031 exchange, divorce, estate, relocation)? That informs how much negotiation room exists.
- Schools are B-rated — typically a magnet for longer-tenancy family renters. What's the average tenant stay here, and is there a school-zone premium baked into asking?
- This sits on a lake — are riparian / water-frontage rights deeded with the parcel? Any dock permits, shoreline easements, or HOA water-use restrictions?
- What's the documented flood / surge / shoreline-erosion history here (FEMA AND non-FEMA — e.g., storm surge, creek backup, septic-field saturation)?
- Any water-quality or seasonal algae-bloom issues that affect tenant satisfaction or short-term-rental demand?
- What's the average days-on-market for RENTAL listings here right now (not sales)? A rising rental-DOM trend means longer vacancies and softer asking-rent achievability than the comps imply.
- What's the recent tenant-quality profile in this submarket — average credit score on applications, eviction rate, late-payment / NSF rate, and stable-employment percentage? A property-management company in the area should have these aggregated.
- How much new for-sale + rental construction is in the pipeline within 1–3 miles? Heavy new supply typically softens prices + rents 12–24 months out; constrained supply supports both.
Investment metrics
- 1% rule
- 1.28% ✓
- Cap rate
- 9.54%
- Cash-on-cash
- 11.60%
- DSCR
- 1.52
- GRM
- 6.5
CMA / ARV
No comps found within radius.
Projected returns pro-forma
-0.77% appreciation · 1.64% rent growth · sell at horizon
- IRR
- 7.2%
- Equity multiple
- 1.32×
- Total profit
- $23,589
- Equity at exit
- $65,629
- IRR
- 12.1%
- Equity multiple
- 2.17×
- Total profit
- $84,866
- Equity at exit
- $71,390
Cash invested: $72,800 (down + closing). Projections, not guarantees.
Landlord ↔ Tenant lean methodology
- Overall (STATE)
- 87 Strongly Landlord-Friendly
- State Florida
- 87 Strongly Landlord-Friendly · R+3
- County
- — inherits STATE
- City
- — inherits STATE
ZIP-level market 33073
- Home prices YoY
- -0.2%
- Rents YoY
- 1.6%
- Active inventory
- 150
- Price-to-rent
- 6.5×
Monthly cashflow live
- Estimated rent
- $3,319 high interval (Pro) →
- Mortgage (P&I)
- −$1,363
- Tax from tax record
- −$261 /mo · $3,134/yr
- Insurance
- −$108
- HOA
- −$185
- Vacancy / Maint / Mgmt
- −$697
- Net cashflow
- $704
Break-even live
UW: 25.0% down · 7.5% · 30yr · 1.5% tax · 5.0% vac · 8.0% maint · 8.0% mgmt
Financing live
Cash to close
- Down payment
- $65,000
- Closing costs
- $7,800
- Reserves months
- —
- Total cash needed
- —
Loan-product check · same deal, 3 products live
Conventional
25% down · 7.5% · 30yr
- Down + closing
- —
- Monthly P&I
- —
- Monthly cashflow
- —
- DSCR
- —
- Eligible?
- —
Personal DTI + credit; lowest rate.
DSCR
20% down · 8.5% · 30yr
- Down + closing
- —
- Monthly P&I
- —
- Monthly cashflow
- —
- DSCR
- —
- Eligible?
- —
No personal income docs; deal must DSCR.
Hard money
10% down · 12.0% · 12mo
- Down + closing
- —
- Monthly P&I
- —
- Monthly cashflow
- —
- DSCR
- —
- Eligible?
- —
Short-term bridge; refi at stabilization.
Rent comps 40 comps
| Address | Beds | Baths | Sqft | Rent | $/sqft | DOM | Units | Dist |
|---|---|---|---|---|---|---|---|---|
| 6343 NW 36th Ave Coconut Creek, FL | 3.0 | 2.5 | 2151 | $4,000 | $1.86 | 24d | 1 | 0.20mi |
| 6352 NW 36th Ave Coconut Creek, FL | 3.0 | 2.0 | 1392 | $3,500 | $2.51 | 24d | 1 | 0.22mi |
| 6642 NW 42nd Ave Coconut Creek, FL | 4.0 | 2.0 | 1925 | $3,595 | $1.87 | 22d | 1 | 0.27mi |
| 3600 W Hillsboro Blvd Coconut Creek, FL | 1.0–3.0 | 1.0–2.0 | 1128 | $2,917 | $2.59 | 1d | 13 | 0.48mi |
| 6956 Julia Gardens Dr Coconut Creek, FL | 3.0 | 2.5 | 1888 | $3,500 | $1.85 | 24d | 1 | 0.48mi |
| 3621 W Hillsboro Blvd Coconut Creek, FL | 1.0–2.0 | 1.0–2.5 | 961 | $2,516 | $2.62 | 2d | 8 | 0.58mi |
| 11 NW 45th Ave Deerfield Beach, FL | 1.0–3.0 | 1.0–2.5 | 1097 | $3,295 | $3.00 | 1d | 17 | 0.72mi |
| 1245 SW 46th Way Deerfield Beach, FL | 3.0 | 2.0 | 1558 | $3,600 | $2.31 | 24d | 1 | 0.77mi |
| 4453 SW 11th Pl Deerfield Beach, FL | 3.0 | 2.5 | 1386 | $3,150 | $2.27 | 22d | 1 | 0.78mi |
| 4359 SW 10th Pl Deerfield Beach, FL | 2.0 | 2.0 | 1070 | $2,399 | $2.24 | 3d | 1 | 0.79mi |
| 4359 SW 10th Pl Deerfield Beach, FL | 2.0 | 2.0 | 1070 | $2,409 | $2.25 | 8d | 1 | 0.79mi |
| 5514 NW 41st Ter Coconut Creek, FL | 3.0 | 2.0 | 1378 | $3,900 | $2.83 | 20d | 1 | 0.85mi |
| 1275 SW 48th Ter Unit 1275 Deerfield Beach, FL | 2.0 | 2.0 | 1264 | $2,600 | $2.06 | 13d | 1 | 0.85mi |
| 1186 SW 44th Ave Deerfield Beach, FL | 3.0 | 2.0 | 1337 | $2,875 | $2.15 | 11d | 1 | 0.86mi |
| 243 NW 45th Ave #243 Deerfield Beach, FL | 2.0 | 2.5 | 1748 | $2,600 | $1.49 | 8d | 1 | 0.86mi |
| 1310 SW 48th Ter Unit 1310 Deerfield Beach, FL | 3.0 | 2.0 | 1495 | $3,900 | $2.61 | 24d | 1 | 0.87mi |
| 5460 NW 38th Ter Coconut Creek, FL | 3.0 | 2.0 | 1667 | $4,100 | $2.46 | 24d | 1 | 0.90mi |
| 4907 Pelican Mnr Coconut Creek, FL | 3.0 | 2.5 | 1816 | $4,000 | $2.20 | 24d | 1 | 0.97mi |
| 4907 Pelican Mnr Coconut Creek, FL | 3.0 | 2.5 | 1816 | $4,000 | $2.20 | 4d | 1 | 0.97mi |
| 6132 Grand Cypress Cir E Coconut Creek, FL | 3.0 | 2.5 | 1935 | $3,300 | $1.71 | 24d | 1 | 0.99mi |
| 5952 NW 47th Ter Unit 5952 Coconut Creek, FL | 3.0 | 2.5 | 1573 | $3,150 | $2.00 | 24d | 1 | 1.01mi |
| 1455 SW 48th Ter Unit 1455 Deerfield Beach, FL | 3.0 | 2.5 | 1386 | $2,790 | $2.01 | 21d | 1 | 1.02mi |
| 1092 SW 42nd Ave Deerfield Beach, FL | 3.0 | 2.0 | 1526 | $3,295 | $2.16 | 24d | 1 | 1.02mi |
| 4755 Cypress St Unit 4755 Coconut Creek, FL | 3.0 | 2.5 | 1935 | $3,375 | $1.74 | 14d | 1 | 1.05mi |
| 3657 Asperwood Cir Coconut Creek, FL | 3.0 | 2.5 | 1616 | $3,650 | $2.26 | 2d | 1 | 1.06mi |
| 3657 Asperwood Cir Coconut Creek, FL | 3.0 | 2.5 | 1616 | $3,650 | $2.26 | 14d | 1 | 1.06mi |
| 3657 Asperwood Cir #3657 Coconut Creek, FL | 3.0 | 2.5 | 1616 | $3,800 | $2.35 | 24d | 1 | 1.06mi |
| 3657 Asperwood Cir #3657 Coconut Creek, FL | 3.0 | 2.5 | 1616 | $3,650 | $2.26 | 3d | 1 | 1.06mi |
| 1488 SW 47th Ave Deerfield Beach, FL | 3.0 | 2.5 | 1502 | $3,000 | $2.00 | 5d | 1 | 1.07mi |
| 1488 SW 47th Ave Deerfield Beach, FL | 3.0 | 2.5 | 1502 | $3,000 | $2.00 | 11d | 1 | 1.07mi |
| 4400 NW 6th St Deerfield Beach, FL | 1.0–2.0 | 1.0–2.0 | 875 | $2,367 | $2.71 | 2d | 9 | 1.08mi |
| 65 Centennial Ct Deerfield Beach, FL | 3.0 | 2.0 | 1466 | $3,000 | $2.05 | 5d | 1 | 1.10mi |
| 5400 Lyons Rd Coconut Creek, FL | 1.0–3.0 | 1.0–2.0 | 1072 | $3,011 | $2.81 | 2d | 47 | 1.10mi |
| 4752 NW 59th Mnr Coconut Creek, FL | 3.0 | 2.5 | 1573 | $3,000 | $1.91 | 24d | 1 | 1.11mi |
| 6077 Grand Cypress Cir W Coconut Creek, FL | 3.0 | 2.5 | 1935 | $3,300 | $1.71 | 2d | 1 | 1.12mi |
| 11 Capitol Ct Unit 11 Deerfield Beach, FL | 3.0 | 2.0 | 1375 | $3,400 | $2.47 | 24d | 1 | 1.13mi |
| 206 Congressional Way #206 Deerfield Beach, FL | 2.0 | 2.0 | 1150 | $2,600 | $2.26 | 24d | 1 | 1.15mi |
| 4814 NW 58th Mnr Coconut Creek, FL | 2.0 | 2.5 | 1407 | $2,600 | $1.85 | 17d | 1 | 1.15mi |
| 4814 NW 58th Mnr Coconut Creek, FL | 2.0 | 2.5 | 1407 | $2,500 | $1.78 | 5d | 1 | 1.15mi |
| 5142 NW 43rd Ave Coconut Creek, FL | 4.0 | 2.0 | 1903 | $4,250 | $2.23 | 18d | 1 | 1.16mi |
HOA detail
- Monthly dues
- $185 · $2,220/yr
- Likely covers
- water
Listing history 21 events
-
2026-06-18days on market $260,000 Active 90 DOM
-
2026-06-17days on market $260,000 Active 89 DOM
-
2026-06-16days on market $260,000 Active 88 DOM
-
2026-06-15days on market $260,000 Active 87 DOM
-
2026-06-13days on market $260,000 Active 85 DOM
-
2026-06-09days on market $260,000 Active 81 DOM
-
2026-06-08days on market $260,000 Active 80 DOM
-
2026-06-07days on market $260,000 Active 79 DOM
-
2026-06-04days on market $260,000 Active 76 DOM
-
2026-06-03days on market $260,000 Active 75 DOM
-
2026-06-02days on market $260,000 Active 74 DOM
-
2026-06-01days on market $260,000 Active 73 DOM
-
2026-05-31days on market $260,000 Active 72 DOM
-
2026-05-09price $260,000
-
2026-04-22price $270,000
-
2026-04-10price $285,000
-
2026-04-01price $294,900
-
2026-03-18$299,900 Active
-
2024-05-02soldstatus $230,000
-
2007-07-03soldstatus $140,000
-
1992-05-11soldstatus $91,900
ⓘ Source: listings_history table (triggers on properties + properties_extension) + one-shot
backfill from property_details.listing_events for pre-trigger history.
Tax reassessment forecast FL · Resets to sale price
- Current annual tax
- $3,134 · $261/mo
- Projected year-2 tax
- $3,134 · $261/mo
- Expected delta
- $0/yr ($0/mo · 0.0%)
ⓘ Screening estimate from a state-policy table — verify with the county assessor before closing.
Climate risk First Street
- Flood 1/10 Low FEMA zone X (unshaded) · 0% chance over 30 yrs
- Wildfire 1/10 Low
- Heat 9/10 Extreme 7 d/yr ≥107°F today · 25 d/yr by 30 yrs out
- Wind 10/10 Extreme 99% chance of damaging wind over 30 yrs
- Air quality 3/10 Moderate 2 unhealthy d/yr today · 3 by 30 yrs out
Nearby sold comps map
Loading sold comps map…
Walkable amenities ~0.75 mi
Loading nearby amenities…
Taxation est. · year 1
- Rental income
- $39,824
- − Mortgage interest
- −$14,564
- − Property taxes
- −$3,134
- − Insurance
- −$1,300
- − Repairs & maintenance
- −$3,186
- − Management
- −$3,186
- − HOA
- −$2,220
- − Depreciation
- −$7,564
- Taxable income
- $4,671
- Est. tax owed @ 24.0%
- −$1,121
- After-tax cash flow
- $7,325/yr
For passive investors: Depreciation is non-cash, so a rental often shows a tax loss while cash-flowing — sheltering income. Rental losses are passive: they offset passive income freely, and up to $25,000/yr can offset ordinary (W-2) income if you actively participate and your MAGI is under $100k (phasing out to $0 by $150k); unused losses carry forward. On sale, claimed depreciation is recaptured at up to 25%, and gains may owe capital-gains tax (a 1031 exchange can defer both). Figures are a year-1 estimate at your 24.0% rate — not tax advice; consult a CPA.
Schools (NCES district)
- District
- Broward
- NCES district ID
- 1200180
- Math proficiency
- 42% ▼ -18.00%
- Reading proficiency
- 53% ▼ -5.00%
- Median HH income
- $52,139
- Composite
- 40.88/100
- National rank
- #3621
- State rank
- #46 of 73 in FL
Livability — Coconut Creek
- Score
- 85/100
- State rank
- #30
- US rank
- #617
Category grades
Schools grade is shown separately in the Schools card above.
Census & demographics
- Census place
- Coconut Creek, FL
- County
- Broward County · 1,963,430 people
- City population
- 50,557
- Metro
- Miami-Fort Lauderdale-Pompano Beach, FL
- Population (ZIP)
- 33,838
- Household income
- $97,412
- Rent vs Own
- Severe rent burden
- 1109.0
Population outlook (Broward County) Hauer SSP2
- Today (2025)
- 2,207,033 people
- By 2030
- 2,360,704 · +7.0%
- By 2040
- 2,661,208 · +20.6%
- By 2050
- 2,946,698 · +33.5%
- By 2075
- 3,602,273 · +63.2%
- By 2100
- 3,970,984 · +79.9%
Race, ethnicity, and origin ACS 2023
- Neighborhood character
- Highly diverse neighborhood (Simpson 0.70)
- Race & ethnicity
- White 43% Hispanic / Latino 28% Two or more races 18% Black 17% Asian 3%
- Hispanic origin (detail)
- Mexican 2% Puerto Rican 4% Cuban 4% Dominican 2%
- Common ancestry
- Estonian 6% Hispanic 3% Romanian 2%
- Foreign-born
- 35% · Canada, Jamaica, China
- Languages at home
- 58% English-only · Spanish 23% Other Indo-European 11% French/Haitian/Cajun 4%
Political lean MEDSL · Broward
- 2024 margin
- D (+17.0) · D 58.0% · R 41.0%
- 2008→2024 swing
- -17.8pp toward R · 2008: 34.7pp · 2024: 17.0pp
- All cycles
- 2024: D+17.0 2020: D+29.8 2016: D+35.0 2012: D+34.9 2008: D+34.7
Not yet ingested
- Civics
- —
Market trends
- HPI YoY
- ▼ -0.77%
- Current HPI
- 337.0725
- Rent YoY
- ▲ 1.64%
- Metro
- Miami-Fort Lauderdale-Pompano Beach, FL
- State GDP YoY
- ▲ 3.28%
- F500 in state
- 36
Industry mix (Fortune 500 HQ in FL)
| Industry | F500 HQs | Revenue |
|---|---|---|
| Industrial Technology | 2 | $29B |
|
||
| Insurance | 2 | $17B |
|
||
| Retail | 1 | $60B |
|
||
| Technology Distribution | 1 | $58B |
|
||
| Homebuilding | 1 | $35B |
|
||
| Technology Manufacturing | 1 | $35B |
|
||
Price history
+182.9% since first listed8 events — show timeline
- 2026-05-09 Price Changed $260,000 Beaches MLS
- 2026-04-22 Price Changed $270,000 Beaches MLS
- 2026-04-10 Price Changed $285,000 Beaches MLS
- 2026-04-01 Price Changed $294,900 Beaches MLS
- 2026-03-18 Listed $299,900 Beaches MLS
- 2024-05-02 Sold (Public Records) $230,000 Public Records
- 2007-07-03 Sold (Public Records) $140,000 Public Records
- 1992-05-11 Sold (Public Records) $91,900 Public Records
Property tax history
+3.0%/yrLatest (2025): $3,134 · -16.5% YoY. Source: county tax records.
Cash-flow waterfall
monthlySold comps — $/sqft
last 12 mo · ≤1 miLoading sold comps…