 Duplex
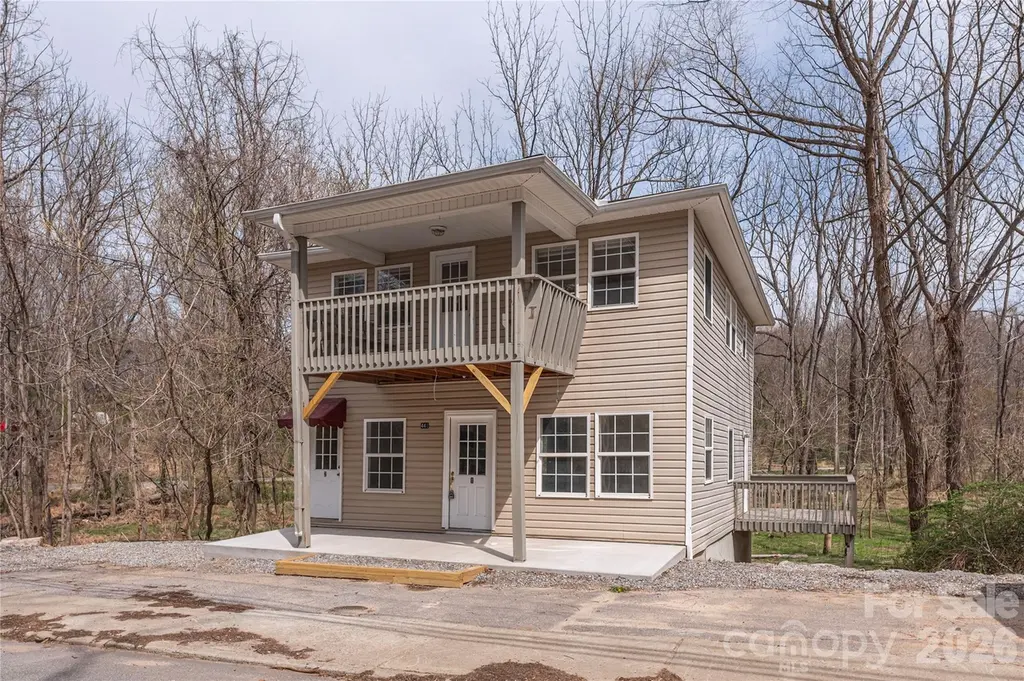
448 Sand Hill Rd · Asheville, NC
Flood risk 10/10 · Severe
- FEMA flood zone
- —
- Chance of flooding over 30 yrs
- 0.99%
- Est. flood insurance / yr
- —
Fire risk 2/10 · Minimal
- Est. fire insurance / yr
- $906 – $1,684
Heat risk 4/10 · Minor
- Hot days now (above 98°F)
- 7 days/yr
- Hot days in 30 yrs
- 20 days/yr
Wind risk 2/10 · Minimal
- Chance of severe wind over 30 yrs
- —
Air-quality risk 3/10 · Minor
- Unhealthy air days now
- 2 days/yr
- Unhealthy air days in 30 yrs
- 2 days/yr
Risk factors via First Street. Map © Google.
Why this score? — see what drove the B- grade
The composite is a weighted blend of 9 inputs, each scored 0–100. Each bar is that input's sub-score; the figure is the points it added to the 100-point composite (weight × sub-score).
- Cash flow +29.3/30.0
- DSCR +10.0/10.0
- ARV discount +7.5/15.0
- 1% rule +7.2/10.0
- Schools +4.0/10.0
- Livability +3.6/5.0
- Rent growth +3.0/5.0
- Condition / age +2.5/5.0
- Appreciation +0.0/10.0
$350,000
🖨 Deal sheet 📄 Offer letter ✓ Due diligence
Multi-family units
County records classify this as Multi-Family (2-4 Unit). Listing-text estimate: 2 units. confirmed
Listing remarks
Don’t miss this rare opportunity to own a duplex in the heart of highly desirable West Asheville! This property features two separate units, each offering 2 bedrooms and 1 full bath—perfect for investors, or multi-generational living. Both units are currently vacant, making it easy to set your own rents or move in right away. Each unit offers a functional layout with comfortable living spaces and plenty of natural light. Step outside and enjoy direct access to the Hominy Creek Greenway, ideal for walking, biking, and enjoying the outdoors right from your backyard. The location puts you just minutes from West Asheville’s vibrant shops, restaurants, and entertainment, while
Key facts
- Two separate units
- Duplex
- 6,969 sq ft lot
Tags
Property features AI
Finance
- Other: Zoning: RM6; Roads are publicly maintained; road surfaces include gravel and paved
- Financial info: Property is residential income (duplex) with 2 total units; Owner pays: none; Tenant pays: none
- HOA & community: No HOA; Community features: sidewalks, street lights, walking trails; Pets allowed
Exterior
- Parking: Two open parking spaces
- Utilities: City / public water; Public sewer; Electricity connected
- Home design: Duplex (residential income property); Site-built construction
- Construction: Vinyl exterior; Composition roof; Basement foundation
- Exterior features: Private, level lot with wooded and sloped areas; Flood plain / bottom land; Adjoins Hominy Creek Greenway
Interior
- Kitchen: Dishwasher; Electric range / oven; Microwave; Refrigerator
- Bedrooms: 4 bedrooms total (configured as two 2-bedroom units)
- Flooring: Carpet; Tile; Vinyl
- Bathrooms: 2 full bathrooms
- Heating & cooling: Heat pump (heating and cooling)
- Interior features: Open floor plan; Basement with exterior entry, dirt floor, unfinished
- Laundry & utility: Washer and dryer in unit; Electric water heater
Neighborhood map
What this means for you Summary
Snapshot
- This is a 2 × 2-bed/1.0-bath units multifamily listed at $350k.
Deal economics
- At list price, monthly cash flow is $1k ($15k/yr) — positive. Per door: $617/mo.
- The deal already cash-flows at list — no discount required.
- Meets the 1% rule at list price ($4k rent vs $350k).
- Recommended offer: $329k (6.0% below list) — sets the bar for market timing.
- Cap rate 10.5% vs local median 2.4% in Asheville — top-decile yield for the area; either an underpriced asset or a hidden risk that comps aren't pricing in. Stress-test before assuming the spread holds.
Location & tenants
- Location reads 72/100 on livability (#96 in NC) — a middle-class / working-renter tenant base. Strengths: commute A+, health & safety A+, housing A-; Watch: crime F.
- Asheville City Schools (urban): math 39% / reading 55% proficiency, ranked #80 of 178 in NC (top 45%) — families likely to look elsewhere, expect single-tenant / working-renter base with shorter leases.
- Zoned schools: Asheville High (math 52% / reading 65%, grade C, #235 of 535 statewide, top 45%, 1,166 students, 33% FRL).
- Market conditions: Rents rising (+2.1%/yr); 334 active listings in the ZIP; 11 comparable units currently listed for rent nearby; rentals at typical pace (median 23d on market — plan ~3-4 weeks tenant-placement turnaround); 3,305 units permitted in Buncombe County in 2024 (1,855 in 5+ unit buildings).
- At $4,283/mo this rent would consume 81% of the median local household income ($63k/yr) (locally 1783% of renters already pay >50% of income on rent) — very limited rent-growth headroom before tenants either downsize or default.
Forward outlook
- Local home prices are declining (-3.0%/yr); year-one equity from $2k of loan paydown is wiped out by about $10k of value loss. Plan a longer hold.
- Buncombe County population projected at +24% by 2050 — long-run rental-demand tailwind backs the buy-and-hold thesis.
- At projected returns (-3.0% appreciation + 2.1% rent growth), your $98k cash investment doubles in ~9 years — after that, you're playing with house money.
Negotiation context
- It's been on market 87 days — a 6% lower offer ($329k) is reasonable based on typical stale-listing flexibility.
- Current owner paid $22k; list at $350k implies a 1491% gain — meaningful room to come down on a strong offer.
Risks & watch-outs
- Watch-outs: built in 1931 — expect roof / HVAC / electrical / plumbing capex.
- Climate carrying-cost: severe flood risk — expect insurance premiums to compound above CPI over the hold.
Questions for the listing agent
- It's been on market 87 days. Have you received any prior offers? Is the seller open to a 6% concession, seller financing, or rate buy-down credit?
- Can we see the unit-by-unit rent roll, current vacancy, and any below-market leases? What's the average tenancy length?
- What capital expenditures (roof, boiler, parking lot, exteriors) have been made in the last 5 years, and what's planned in the next 2?
- Built in 1931 — when were the roof, HVAC, electrical panel, plumbing, and water heater last replaced?
- Why hasn't it sold? Are there any deal-killer items the seller is aware of (foundation, flood, title, zoning, code violations)?
- Is there a deadline driving the sale (1031 exchange, divorce, estate, relocation)? That informs how much negotiation room exists.
- Schools are B-rated — typically a magnet for longer-tenancy family renters. What's the average tenant stay here, and is there a school-zone premium baked into asking?
- Crime grade is F in this area — have there been break-ins, vandalism, or insurance claims at this property in the last 3 years? What carrier currently insures it and at what premium?
- What's the average days-on-market for RENTAL listings here right now (not sales)? A rising rental-DOM trend means longer vacancies and softer asking-rent achievability than the comps imply.
- What's the recent tenant-quality profile in this submarket — average credit score on applications, eviction rate, late-payment / NSF rate, and stable-employment percentage? A property-management company in the area should have these aggregated.
- How much new apartment / multifamily construction is in the pipeline within 1–3 miles? Heavy new supply (>2% of stock underway) typically softens rents 12–24 months out; light construction supports rent growth.
Investment metrics
- 1% rule
- 1.22% ✓
- Cap rate
- 10.52%
- Cash-on-cash
- 15.10%
- DSCR
- 1.67
- GRM
- 6.8
CMA / ARV
No comps found within radius.
Projected returns pro-forma
-3.0% appreciation · 2.06% rent growth · sell at horizon
- IRR
- 4.7%
- Equity multiple
- 1.18×
- Total profit
- $17,736
- Equity at exit
- $52,186
- IRR
- 13.3%
- Equity multiple
- 2.02×
- Total profit
- $100,041
- Equity at exit
- $30,262
Cash invested: $98,000 (down + closing). Projections, not guarantees.
Landlord ↔ Tenant lean methodology
- Overall (STATE)
- 85 Strongly Landlord-Friendly
- State North Carolina
- 85 Strongly Landlord-Friendly · R+3
- County
- — inherits STATE
- City
- — inherits STATE
ZIP-level market 28806
- Rents YoY
- 2.1%
- Active inventory
- 334
- Price-to-rent
- 13.6×
Monthly cashflow live
- Estimated rent
- $4,283 high interval (Pro) →
- Mortgage (P&I)
- −$1,835
- Tax from tax record
- −$169 /mo · $2,025/yr
- Insurance
- −$146
- HOA
- −$0
- Vacancy / Maint / Mgmt
- −$899
- Net cashflow
- $1,234
Break-even live
2-unit breakdown (identical units grouped — click to expand)
| Units | Beds | Baths | Est. rent |
|---|---|---|---|
| 2× units | 2 | 1 | $4,282 |
| #1 | 2 | 1 | $2,141 |
| #2 | 2 | 1 | $2,141 |
| Total (2 units) | $4,283 | ||
UW: 25.0% down · 7.5% · 30yr · 1.5% tax · 5.0% vac · 8.0% maint · 8.0% mgmt
Financing live
Cash to close
- Down payment
- $87,500
- Closing costs
- $10,500
- Reserves months
- —
- Total cash needed
- —
Loan-product check · same deal, 3 products live
Conventional
25% down · 7.5% · 30yr
- Down + closing
- —
- Monthly P&I
- —
- Monthly cashflow
- —
- DSCR
- —
- Eligible?
- —
Personal DTI + credit; lowest rate.
DSCR
20% down · 8.5% · 30yr
- Down + closing
- —
- Monthly P&I
- —
- Monthly cashflow
- —
- DSCR
- —
- Eligible?
- —
No personal income docs; deal must DSCR.
Hard money
10% down · 12.0% · 12mo
- Down + closing
- —
- Monthly P&I
- —
- Monthly cashflow
- —
- DSCR
- —
- Eligible?
- —
Short-term bridge; refi at stabilization.
Rent comps 11 comps
| Address | Beds | Baths | Sqft | Rent | $/sqft | DOM | Units | Dist |
|---|---|---|---|---|---|---|---|---|
| 113 Hominy Ridge Ct Asheville, NC | 3.0 | 1.0–2.0 | 945 | $2,309 | $2.44 | 13d | 68 | 0.32mi |
| 110 Bear Creek Ln Asheville, NC | 1.0–3.0 | 1.0–2.0 | 910 | $1,824 | $2.00 | 13d | 23 | 0.43mi |
| 11 Shadowlawn Dr Asheville, NC | 3.0 | 2.0 | 1410 | $2,250 | $1.60 | 43d | 1 | 0.98mi |
| 17 Bolton St Asheville, NC | 3.0 | 2.5 | 1592 | $1,795 | $1.13 | 13d | 1 | 1.01mi |
| 11 Bolton St Asheville, NC | 3.0 | 2.5 | 1629 | $1,895 | $1.16 | 43d | 1 | 1.02mi |
| 5 Bolton St Asheville, NC | 3.0 | 2.5 | 1629 | $1,845 | $1.13 | 21d | 1 | 1.03mi |
| 96 Louisiana Ave Asheville, NC | 3.0 | 2.0 | 1602 | $2,595 | $1.62 | 23d | 1 | 1.25mi |
| 16 Evergreen Ave Unit B Asheville, NC | 3.0 | 2.0 | 1200 | $1,865 | $1.55 | 43d | 1 | 1.30mi |
| 16 Evergreen Ave Unit A Asheville, NC | 3.0 | 2.0 | 1200 | $1,795 | $1.50 | 23d | 1 | 1.30mi |
| 82 Hanover St Asheville, NC | 4.0 | 2.0 | 1404 | $2,200 | $1.57 | 13d | 1 | 1.39mi |
| 5 Mayday St Asheville, NC | 3.0 | 3.0 | 1528 | $2,999 | $1.96 | 43d | 1 | 1.43mi |
Listing history 17 events
-
2026-06-18days on market $350,000 Active 87 DOM
-
2026-06-17days on market $350,000 Active 86 DOM
-
2026-06-16days on market $350,000 Active 85 DOM
-
2026-06-15days on market $350,000 Active 84 DOM
-
2026-06-14days on market $350,000 Active 82 DOM
-
2026-06-10days on market $350,000 Active 79 DOM
-
2026-06-09days on market $350,000 Active 78 DOM
-
2026-06-08days on market $350,000 Active 77 DOM
-
2026-06-07pricedays on market $350,000 Active 76 DOM
-
2026-06-05days on market $425,000 Active 73 DOM
-
2026-06-03days on market $425,000 Active 72 DOM
-
2026-06-02days on market $425,000 Active 71 DOM
-
2026-06-01days on market $425,000 Active 70 DOM
-
2026-05-31days on market $425,000 Active 69 DOM
-
2026-05-30days on market $425,000 Active 68 DOM
-
2026-03-23$425,000 Active
-
1988-12-21soldstatus $22,000
ⓘ Source: listings_history table (triggers on properties + properties_extension) + one-shot
backfill from property_details.listing_events for pre-trigger history.
Tax reassessment forecast NC · Resets to sale price
- Current annual tax
- $2,025 · $169/mo
- Projected year-2 tax
- $2,870 · $239/mo
- Expected delta
- +$845/yr (+$70/mo · 41.7%)
ⓘ Screening estimate from a state-policy table — verify with the county assessor before closing.
Climate risk First Street
- Flood 10/10 Extreme 99% chance over 30 yrs
- Wildfire 2/10 Low
- Heat 4/10 Moderate 7 d/yr ≥98°F today · 20 d/yr by 30 yrs out
- Wind 2/10 Low
- Air quality 3/10 Moderate 2 unhealthy d/yr today · 2 by 30 yrs out
Nearby sold comps map
Loading sold comps map…
Walkable amenities ~0.75 mi
Loading nearby amenities…
Taxation est. · year 1
- Rental income
- $51,396
- − Mortgage interest
- −$19,605
- − Property taxes
- −$2,025
- − Insurance
- −$1,750
- − Repairs & maintenance
- −$4,112
- − Management
- −$4,112
- − Depreciation
- −$10,182
- Taxable income
- $9,610
- Est. tax owed @ 24.0%
- −$2,306
- After-tax cash flow
- $12,496/yr
For passive investors: Depreciation is non-cash, so a rental often shows a tax loss while cash-flowing — sheltering income. Rental losses are passive: they offset passive income freely, and up to $25,000/yr can offset ordinary (W-2) income if you actively participate and your MAGI is under $100k (phasing out to $0 by $150k); unused losses carry forward. On sale, claimed depreciation is recaptured at up to 25%, and gains may owe capital-gains tax (a 1031 exchange can defer both). Figures are a year-1 estimate at your 24.0% rate — not tax advice; consult a CPA.
Schools (NCES district)
- District
- Asheville City Schools
- NCES district ID
- 3700270
- Math proficiency
- 39% ▼ -7.00%
- Reading proficiency
- 55% ▼ -4.00%
- Median HH income
- $42,367
- Composite
- 39.51/100
- National rank
- #3948
- State rank
- #80 of 178 in NC
Livability — Asheville
- Score
- 72/100
- State rank
- #96
- US rank
- #6307
Category grades
Schools grade is shown separately in the Schools card above.
Census & demographics
- Census place
- Asheville, NC
- County
- Buncombe County · 241,085 people
- City population
- 137,611
- Metro
- Asheville, NC
- Population (ZIP)
- 43,433
- Household income
- $63,273
- Rent vs Own
- Severe rent burden
- 1783.0
Population outlook (Buncombe County) Hauer SSP2
- Today (2025)
- 286,475 people
- By 2030
- 302,237 · +5.5%
- By 2040
- 330,687 · +15.4%
- By 2050
- 356,370 · +24.4%
- By 2075
- 409,383 · +42.9%
- By 2100
- 437,270 · +52.6%
Race, ethnicity, and origin ACS 2023
- Neighborhood character
- Predominantly White (77%)
- Race & ethnicity
- White 77% Hispanic / Latino 11% Two or more races 9% Black 6% Asian 2%
- Hispanic origin (detail)
- Mexican 6%
- Common ancestry
- Serbian 3% Slovak 3% Italian 3%
- Foreign-born
- 10% · Canada, China
- Languages at home
- 86% English-only · Spanish 9% Russian/Polish/Slavic 3% Other Indo-European 2%
Political lean MEDSL · Buncombe
- 2024 margin
- Strong D (+24.8) · D 61.7% · R 36.9% · Other 1.4%
- 2008→2024 swing
- +10.9pp toward D · 2008: 13.9pp · 2024: 24.8pp
- All cycles
- 2024: D+24.8 2020: D+21.1 2016: D+14.6 2012: D+12.4 2008: D+13.9
Not yet ingested
- Civics
- —
Market trends
- HPI YoY
- ▼ -271.16%
- Current HPI
- 350.3071
- Rent YoY
- ▲ 2.06%
- Metro
- Asheville, NC
- State GDP YoY
- ▲ 3.28%
- F500 in state
- 26
Industry mix (Fortune 500 HQ in NC)
| Industry | F500 HQs | Revenue |
|---|---|---|
| Financial Services | 2 | $213B |
|
||
| Retail | 2 | $95B |
|
||
| Industrial Conglomerate | 1 | $38B |
|
||
| Metals / Steel | 1 | $35B |
|
||
| Utilities | 1 | $30B |
|
||
| Industrial Machinery | 1 | $19B |
|
||
Price history
+1831.8% since first listed2 events — show timeline
- 2026-03-23 Listed $425,000 CANOPYMLS as Distributed by MLS Grid
- 1988-12-21 Sold (Public Records) $22,000 Public Records
Property tax history
+1.1%/yrLatest (2025): $2,025 · -23.6% YoY. Source: county tax records.
Cash-flow waterfall
monthlySold comps — $/sqft
last 12 mo · ≤1 miLoading sold comps…