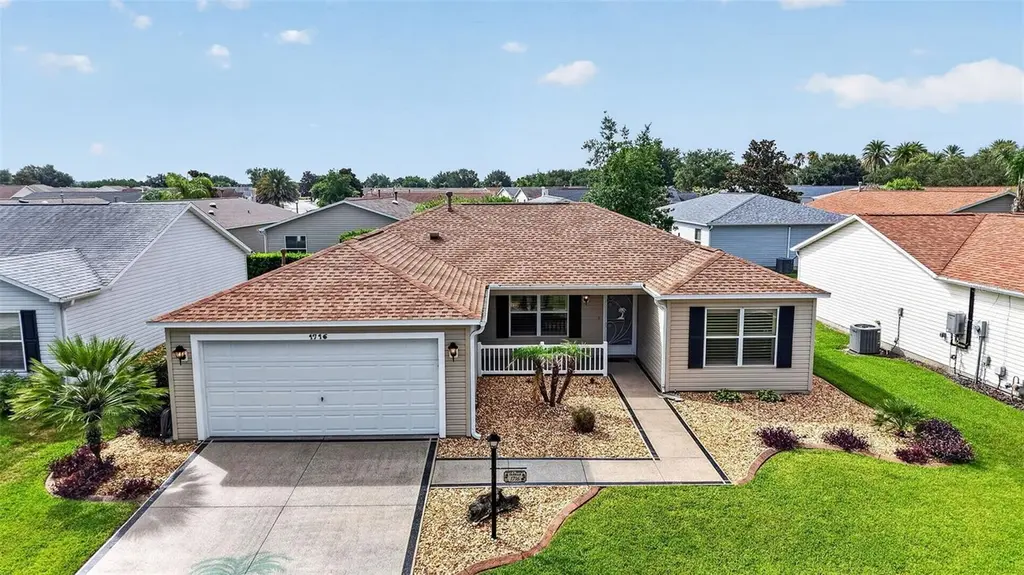
1716 Lakewood Dr · The Villages, FL
Flood risk 1/10 · Minimal
- FEMA flood zone
- X (unshaded)
- Chance of flooding over 30 yrs
- 0.0%
- Est. flood insurance / yr
- $507 – $1,088
Fire risk 4/10 · Minor
- Est. fire insurance / yr
- $947 – $1,759
Heat risk 9/10 · Severe
- Hot days now (above 108°F)
- 7 days/yr
- Hot days in 30 yrs
- 22 days/yr
Wind risk 9/10 · Severe
- Chance of severe wind over 30 yrs
- 99.0%
Air-quality risk 3/10 · Minor
- Unhealthy air days now
- 2 days/yr
- Unhealthy air days in 30 yrs
- 3 days/yr
Risk factors via First Street. Map © Google.
Why this score? — see what drove the D+ grade
The composite is a weighted blend of 9 inputs, each scored 0–100. Each bar is that input's sub-score; the figure is the points it added to the 100-point composite (weight × sub-score).
- Cash flow +12.2/30.0
- ARV discount +11.3/15.0
- Schools +5.2/10.0
- DSCR +3.6/10.0
- Rent growth +3.5/5.0
- Livability +3.5/5.0
- 1% rule +3.3/10.0
- Condition / age +2.5/5.0
- Appreciation +0.0/10.0
$334,900
🖨 Deal sheet (PDF) 📄 Offer letter ✓ Due diligence
Listing remarks
LOCATION LOCATION! Located off Bailey Trail, this beautiful Amarillo model offers a great combination of updates and value with the BOND PAID! Prime location between 466 and 466A near Lake Sumter Landing! VILLAGE OF SUNSET POINTE! NO CARPET! This popular split floorplan could be your Florida retreat. You will notice the beautiful curb appeal and inviting front porch. As you enter the home the vaulted ceilings opens up the space! The living room, dining room, and kitchen combo allows for great entertaining of family and friends. PLANTATION SHUTTERS throughout the house. The kitchen has stainless steel appliances and beautiful backsplash. The guest wing is tucked behind a
Key facts
- 5,551 sq ft lot
- 2 garage spots
- Built 2005
Property features AI
Finance
- Other: Pets allowed: cats and dogs; Unfurnished; Directions available
- Financial info: Lease restrictions apply
- HOA & community: Monthly association fees apply (approx. $204); Annual association fees (approx. $2,448); CDD present
Exterior
- Parking: Attached garage with 2 spaces
- Utilities: Public water; Public sewer; Electricity connected; Natural gas available; Cable connected; BB/HS internet available; Phone available; Underground utilities; Water connected; Sewer connected
- Home design: Single family residence; One story; Faces north; Residential zoning; Located in a senior community; Homestead exempt
- Construction: Vinyl siding construction; Shingle roof; Built on slab foundation; Built area ~2063 square feet (public records)
- Exterior features: Lighting; Irrigation equipment; Vinyl siding; Shingle roof; Paved road access
Interior
- Kitchen: Microwave; Range; Refrigerator; Ice maker
- Bedrooms: 3 bedrooms
- Flooring: Tile; Slab foundation
- Bathrooms: 2 full bathrooms
- Heating & cooling: Central heating; Central air
- Interior features: Ceiling fans; High ceilings; Split bedroom floorplan; Thermostat; Vaulted ceilings; Window treatments
- Laundry & utility: Washer; Dryer; Laundry closet; Tankless water heater
Neighborhood map
What this means for you Summary
Snapshot
- This is a 3-bed/2.0-bath single-family listed at $335k.
Deal economics
- At list price, monthly cash flow is $-70 ($-840/yr) — negative.
- To cash-flow at today's rent, offer at most $323k (3.7% below list).
- To meet the 1% rule (rent ≥ 1% of price), the offer needs to be $277k (17.2% below list).
- Recommended offer: $277k (17.2% below list) — sets the bar for 1% rule.
- Cap rate 6.0% vs local median 5.0% in The Villages — meaningfully above typical; check what's discounted (condition, days-on-market, listing class) to confirm the premium yield is real.
Location & tenants
- Location reads 70/100 on livability (#431 in FL) — a middle-class / working-renter tenant base. Strengths: crime A+, housing A, employment B+; Watch: amenities F, commute F, health & safety F.
- Sumter (rural): math 61% / reading 61% proficiency, ranked #11 of 73 in FL (top 15%) — acceptable for families but not a draw, mixed tenant base, ~2y average lease.
- Zoned schools: Wildwood Elementary School (math 49% / reading 52%, grade D+, #1,055 of 2,144 statewide, top 50%, 940 students, 76% FRL); South Sumter Middle School (math 55% / reading 54%, grade B-, #183 of 571 statewide, top 34%, 897 students, 61% FRL) — zoned schools average 68% FRL vs 51% district-wide (18 pts higher); higher-poverty schools than district average — tighter screening recommended.
- Market conditions: Rents rising (+3.9%/yr); 551 active listings in the ZIP; 10 comparable units currently listed for rent nearby; rentals at typical pace (median 23d on market — plan ~3-4 weeks tenant-placement turnaround); 3,961 units permitted in Sumter County in 2024 (248 in 5+ unit buildings).
- This rent runs 45% of the median local income ($74k/yr) — at the standard rent-burdened threshold; future hikes will face affordability resistance.
Forward outlook
- Local home prices are declining (-3.0%/yr); year-one equity from $2k of loan paydown is wiped out by about $10k of value loss. Plan a longer hold.
- Sumter County population projected at +45% by 2050 — long-run rental-demand tailwind backs the buy-and-hold thesis.
Negotiation context
- Only 8 days on market — expect competitive offers; lowballing is unlikely to land.
Risks & watch-outs
- Climate carrying-cost: severe wind risk, 99% chance of damaging wind over 30y; extreme-heat days projected 7→22/yr by 2055 (HVAC capex compounding) — expect insurance premiums to compound above CPI over the hold.
Questions for the listing agent
- What do current leases actually rent for vs. the listed asking? Can we see a recent rent roll and the last 12 months of T-12 income?
- What does the HOA fee cover, when was the last increase, and are there any pending special assessments or reserve-fund shortfalls?
- Is there a deadline driving the sale (1031 exchange, divorce, estate, relocation)? That informs how much negotiation room exists.
- Schools are A-rated — typically a magnet for longer-tenancy family renters. What's the average tenant stay here, and is there a school-zone premium baked into asking?
- The area grade is low — what's the realistic commute time and amenity access for the typical tenant pool here? Any planned neighborhood developments (good or bad) we should know about?
- What's the average days-on-market for RENTAL listings here right now (not sales)? A rising rental-DOM trend means longer vacancies and softer asking-rent achievability than the comps imply.
- What's the recent tenant-quality profile in this submarket — average credit score on applications, eviction rate, late-payment / NSF rate, and stable-employment percentage? A property-management company in the area should have these aggregated.
- How much new for-sale + rental construction is in the pipeline within 1–3 miles? Heavy new supply typically softens prices + rents 12–24 months out; constrained supply supports both.
Investment metrics
- 1% rule
- 0.83% ✗
- Cap rate
- 6.04%
- Cash-on-cash
- -0.90%
- DSCR
- 0.96
- GRM
- 10.1
CMA / ARV
- ARV (on-the-fly)
- $366,096
- Comps found
- 12
Show comp detail 12 sales within ~0.75 mi
| Address | Dist | Beds/Ba | Sqft | Sold | Price | $/sf | Match |
|---|---|---|---|---|---|---|---|
| 1739 Lakewood Dr | 0.05mi | 3/2.0 | 1,496 (+8%) | 10mo | $570,000 | $381 | 77 |
| 1890 Sagamore St | 0.42mi | 3/2.0 | 1,398 (+0%) | 10mo | $389,500 | $279 | 72 |
| 1565 Lakewood Dr | 0.22mi | 3/2.0 | 1,240 (-11%) | 1mo | $342,500 | $276 | 70 |
| 1852 Williamsburg Ave | 0.51mi | 3/2.0 | 1,500 (+8%) | 3mo | $390,000 | $260 | 61 |
| 1499 Egret Ct | 0.50mi | 3/2.0 | 1,510 (+8%) | 4mo | $392,000 | $260 | 60 |
| 1874 Kyrle Ter | 0.48mi | 3/2.0 | 1,488 (+7%) | 8mo | $340,000 | $228 | 59 |
| 1667 Abernethy Pl | 0.63mi | 3/2.0 | 1,496 (+8%) | 1mo | $365,000 | $244 | 58 |
| 1837 Hagood Loop | 0.42mi | 3/2.0 | 1,535 (+10%) | 9mo | $390,000 | $254 | 56 |
| 1514 Vandam St | 0.37mi | 3/2.0 | 1,571 (+13%) | 10mo | $310,000 | $197 | 53 |
| 1639 Edisto Ln | 0.40mi | 2/2.0 (-1) | 1,196 (-14%) | 1mo | $314,000 | $263 | 52 |
| 1550 Lime Grove Ln | 0.59mi | 2/2.0 (-1) | 1,200 (-14%) | 1mo | $340,000 | $283 | 44 |
| 1513 Alexandria Pl | 0.58mi | 2/2.0 (-1) | 1,210 (-13%) | 8mo | $338,000 | $279 | 39 |
Match score weights: distance 35% · size 25% · config 20% · recency 20%. Top-matched comps best support the ARV.
Projected returns pro-forma
-3.0% appreciation · 3.92% rent growth · sell at horizon
- IRR
- -16.8%
- Equity multiple
- 0.40×
- Total profit
- $-56,130
- Equity at exit
- $49,935
- IRR
- -7.1%
- Equity multiple
- 0.53×
- Total profit
- $-43,758
- Equity at exit
- $28,956
Cash invested: $93,772 (down + closing). Projections, not guarantees.
Landlord ↔ Tenant lean methodology
- Overall (STATE)
- 87 Strongly Landlord-Friendly
- State Florida
- 87 Strongly Landlord-Friendly · R+3
- County
- — inherits STATE
- City
- — inherits STATE
ZIP-level market 32162
- Home prices YoY
- -6.9%
- Rents YoY
- 3.9%
- Active inventory
- 551
- Price-to-rent
- 10.1×
Monthly cashflow live
- Estimated rent
- $2,772 high interval (Pro) →
- Mortgage (P&I)
- −$1,756
- Tax from tax record
- −$160 /mo · $1,924/yr
- Insurance
- −$140
- HOA
- −$204
- Vacancy / Maint / Mgmt
- −$582
- Net cashflow
- $-70
Break-even live
Sensitivity live
| Price | -10% $120 | -5% $25 | +0% $-70 | +5% $-165 | +10% $-260 |
|---|---|---|---|---|---|
| Rent | -10% $-289 | -5% $-180 | +0% $-70 | +5% $39 | +10% $149 |
| Rate | -1.0pp $99 | -0.5pp $15 | base $-70 | +0.5pp $-157 | +1.0pp $-245 |
UW: 25.0% down · 7.5% · 30yr · 1.5% tax · 5.0% vac · 8.0% maint · 8.0% mgmt
Financing live
Cash to close
- Down payment
- $83,725
- Closing costs
- $10,047
- Reserves months
- —
- Total cash needed
- —
Loan-product check · same deal, 3 products live
Conventional
25% down · 7.5% · 30yr
- Down + closing
- —
- Monthly P&I
- —
- Monthly cashflow
- —
- DSCR
- —
- Eligible?
- —
Personal DTI + credit; lowest rate.
DSCR
20% down · 8.5% · 30yr
- Down + closing
- —
- Monthly P&I
- —
- Monthly cashflow
- —
- DSCR
- —
- Eligible?
- —
No personal income docs; deal must DSCR.
Hard money
10% down · 12.0% · 12mo
- Down + closing
- —
- Monthly P&I
- —
- Monthly cashflow
- —
- DSCR
- —
- Eligible?
- —
Short-term bridge; refi at stabilization.
Rent comps 10 comps
| Address | Beds | Baths | Sqft | Rent | $/sqft | DOM | Units | Dist |
|---|---|---|---|---|---|---|---|---|
| 1623 Abernethy Pl The Villages, FL | 3.0 | 2.0 | 1565 | $4,800 | $3.07 | 23d | 1 | 0.66mi |
| 2014 Johnson Ct The Villages, FL | 2.0 | 2.0 | 1156 | $2,000 | $1.73 | 23d | 1 | 1.07mi |
| 1607 Allendale Pl The Villages, FL | 2.0 | 2.0 | 1156 | $2,800 | $2.42 | 23d | 1 | 1.17mi |
| 1009 Ridgeville Rd The Villages, FL | 2.0 | 2.0 | 1188 | $2,475 | $2.08 | 23d | 1 | 1.21mi |
| 2372 Travis Pl The Villages, FL | 2.0 | 2.0 | 1188 | $2,000 | $1.68 | 23d | 1 | 1.38mi |
| 2383 Camden Ter The Villages, FL | 2.0 | 2.0 | 1182 | $2,500 | $2.12 | 23d | 1 | 1.42mi |
| 2368 McClellanville Ter The Villages, FL | 2.0 | 2.0 | 1142 | $4,800 | $4.20 | 23d | 1 | 1.45mi |
| 5336 Edgewater Way Unit 5336 Oxford, FL | 3.0 | 2.0 | 1291 | $2,000 | $1.55 | 23d | 1 | 1.47mi |
| 2272 Vassar Ln The Villages, FL | 3.0 | 2.0 | 1416 | $2,500 | $1.77 | 23d | 1 | 1.48mi |
| 2340 Pickens Pl The Villages, FL | 2.0 | 2.0 | 1156 | $1,900 | $1.64 | 23d | 1 | 1.48mi |
HOA detail
- Monthly dues
- $204 · $2,448/yr
Listing history 8 events
-
2026-06-22days on market $334,900 Active 8 DOM
-
2026-06-19days on market $334,900 Active 6 DOM
-
2026-06-18days on market $334,900 Active 5 DOM
-
2026-06-17days on market $334,900 Active 4 DOM
-
2026-06-16days on market $334,900 Active 3 DOM
-
2026-06-15days on market $334,900 Active 2 DOM
-
2026-06-14remarks 679-char remark
-
2026-06-14$334,900 Active 1 DOM
ⓘ Source: listings_history table (triggers on properties + properties_extension) + one-shot
backfill from property_details.listing_events for pre-trigger history.
Tax reassessment forecast FL · Resets to sale price
- Current annual tax
- $1,924 · $160/mo
- Projected year-2 tax
- $2,780 · $232/mo
- Expected delta
- +$856/yr (+$71/mo · 44.5%)
ⓘ Screening estimate from a state-policy table — verify with the county assessor before closing.
Climate risk First Street
- Flood 1/10 Low FEMA zone X (unshaded) · 0% chance over 30 yrs
- Wildfire 4/10 Moderate
- Heat 9/10 Extreme 7 d/yr ≥108°F today · 22 d/yr by 30 yrs out
- Wind 9/10 Extreme 99% chance of damaging wind over 30 yrs
- Air quality 3/10 Moderate 2 unhealthy d/yr today · 3 by 30 yrs out
Nearby sold comps map
Loading sold comps map…
Walkable amenities ~0.75 mi
Loading nearby amenities…
Taxation est. · year 1
- Rental income
- $33,267
- − Mortgage interest
- −$18,760
- − Property taxes
- −$1,924
- − Insurance
- −$1,674
- − Repairs & maintenance
- −$2,661
- − Management
- −$2,661
- − HOA
- −$2,448
- − Depreciation
- −$9,743
- Taxable loss
- −$6,604
- Est. tax savings @ 24.0%
- +$1,585
- After-tax cash flow
- $745/yr
For passive investors: Depreciation is non-cash, so a rental often shows a tax loss while cash-flowing — sheltering income. Rental losses are passive: they offset passive income freely, and up to $25,000/yr can offset ordinary (W-2) income if you actively participate and your MAGI is under $100k (phasing out to $0 by $150k); unused losses carry forward. On sale, claimed depreciation is recaptured at up to 25%, and gains may owe capital-gains tax (a 1031 exchange can defer both). Figures are a year-1 estimate at your 24.0% rate — not tax advice; consult a CPA.
Schools (NCES district)
- District
- Sumter
- NCES district ID
- 1201800
- Math proficiency
- 61% ▼ -4.00%
- Reading proficiency
- 61% ▼ -2.00%
- Median HH income
- $48,240
- Composite
- 51.74/100
- National rank
- #1682
- State rank
- #11 of 73 in FL
Livability — The Villages
- Score
- 70/100
- State rank
- #431
- US rank
- #7363
Category grades
Schools grade is shown separately in the Schools card above.
Census & demographics
- Census place
- The Villages, FL
- County
- Sumter County · 110,591 people
- City population
- 83,973
- Metro
- The Villages, FL
- Population (ZIP)
- 55,424
- Household income
- $74,119
- Rent vs Own
- Severe rent burden
- 987.0
Population outlook (Sumter County) Hauer SSP2
- Today (2025)
- 161,172 people
- By 2030
- 180,083 · +11.7%
- By 2040
- 209,892 · +30.2%
- By 2050
- 234,186 · +45.3%
- By 2075
- 284,602 · +76.6%
- By 2100
- 317,039 · +96.7%
Race, ethnicity, and origin ACS 2023
- Neighborhood character
- Predominantly White (95%)
- Race & ethnicity
- White 95% Two or more races 2% Hispanic / Latino 2% Asian 1% Black 1%
- Common ancestry
- Romanian 7% Slovak 4% Lithuanian 4%
- Foreign-born
- 5% · Canada
- Languages at home
- 96% English-only · Spanish 1% Tagalog/Filipino 1%
Political lean MEDSL · Sumter
- 2024 margin
- Solid R (+37.6) · D 30.9% · R 68.6%
- 2008→2024 swing
- -10.6pp toward R · 2008: -27.0pp · 2024: -37.6pp
- All cycles
- 2024: R+37.6 2020: R+36.1 2016: R+39.2 2012: R+34.9 2008: R+27.0
Not yet ingested
- Civics
- —
Market trends
- HPI YoY
- ▼ -16.16%
- Current HPI
- 218.1956
- Rent YoY
- ▲ 3.92%
- Metro
- The Villages, FL
- State GDP YoY
- ▲ 3.28%
- F500 in state
- 36
Industry mix (Fortune 500 HQ in FL)
| Industry | F500 HQs | Revenue |
|---|---|---|
| Industrial Technology | 2 | $29B |
|
||
| Insurance | 2 | $17B |
|
||
| Retail | 1 | $60B |
|
||
| Technology Distribution | 1 | $58B |
|
||
| Homebuilding | 1 | $35B |
|
||
| Technology Manufacturing | 1 | $35B |
|
||
Price history
1 event — show timeline
- 2026-06-13 Listed $334,900 Stellar MLS as Distributed by MLS Grid
Property tax history
+0.8%/yrLatest (2025): $1,924 · +1.2% YoY. Source: county tax records.
Cash-flow waterfall
monthlySold comps — $/sqft
last 12 mo · ≤1 miLoading sold comps…