3500 35th Ave #53 · Evans, CO
Flood risk 1/10 · Minimal
- FEMA flood zone
- X (unshaded)
- Chance of flooding over 30 yrs
- 0.0%
- Est. flood insurance / yr
- $507 – $1,088
Fire risk 4/10 · Minor
- Est. fire insurance / yr
- $939 – $1,743
Heat risk 3/10 · Minor
- Hot days now (above 95°F)
- 7 days/yr
- Hot days in 30 yrs
- 17 days/yr
Wind risk 2/10 · Minimal
- Chance of severe wind over 30 yrs
- —
Air-quality risk 4/10 · Minor
- Unhealthy air days now
- 5 days/yr
- Unhealthy air days in 30 yrs
- 5 days/yr
Risk factors via First Street. Map © Google.
Why this score? — see what drove the B grade
The composite is a weighted blend of 9 inputs, each scored 0–100. Each bar is that input's sub-score; the figure is the points it added to the 100-point composite (weight × sub-score).
- Cash flow +30.0/30.0
- ARV discount +13.3/15.0
- 1% rule +10.0/10.0
- DSCR +10.0/10.0
- Livability +3.5/5.0
- Condition / age +2.5/5.0
- Schools +2.0/10.0
- Rent growth +1.9/5.0
- Appreciation +0.0/10.0
$77,000
🖨 Deal sheet 📄 Offer letter ✓ Due diligence
Listing remarks
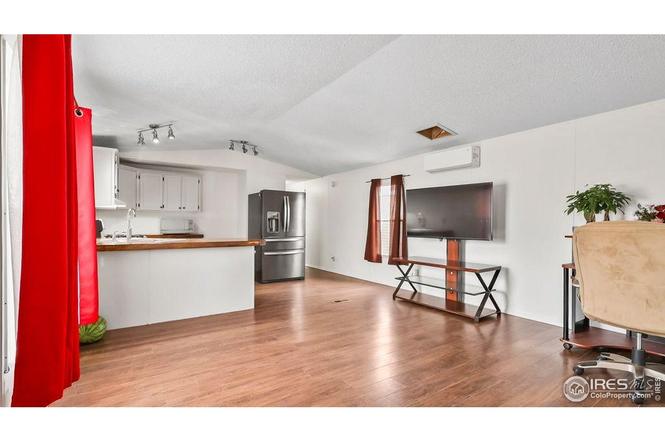
Seller is offering $1K in concessions to assist the buyer with closing costs or as they see fit! This well-maintained mobile home in Greeley offers more space than you'd expect! The bedrooms a notably large, providing plenty of room for comfort and flexibility. The primary suite includes a private ensuite bath adding extra privacy and convenience. Recent updates include fresh interior paint, giving the home a clean and modern feel. Enjoy the welcoming layout, all conveniently located near shopping and with quick access to Hwy 34. A great opportunity for affordable, spacious living--SELLER IS MOTIVATED!
Key facts
- Recent updates
- Welcoming layout
- Private ensuite bath
Tags
Property features AI
Finance
- Other: Located in a manufactured-home park
Exterior
- Parking: No garage; No designated parking features
- Utilities: City water (meter installed); No water rights; Public sewer; Natural gas available; Electricity available
- Home design: Manufactured in park (mobile home)
- Construction: Metal siding; Metal roof; Built by Champion
- Exterior features: Deck; Corner lot
Interior
- Kitchen: Gas range; Microwave
- Bedrooms: 3 bedrooms
- Bathrooms: 2 full bathrooms
- Interior features: Gas range; Microwave; Forced air heat; Wall/window cooling unit(s)
Neighborhood map
What this means for you Summary
Snapshot
- This is a 3-bed/2.0-bath manufactured listed at $77k.
Deal economics
- At list price, monthly cash flow is $989 ($12k/yr) — positive.
- The deal already cash-flows at list — no discount required.
- Meets the 1% rule at list price ($2k rent vs $77k).
- Recommended offer: $68k (12.0% below list) — sets the bar for market timing.
- Cap rate 21.7% vs local median 3.8% in Evans — top-decile yield for the area; either an underpriced asset or a hidden risk that comps aren't pricing in. Stress-test before assuming the spread holds.
Location & tenants
- Location reads 69/100 on livability (#104 in CO) — a middle-class / working-renter tenant base. Strengths: commute A+, housing A+; Watch: crime C-, schools F, amenities F.
- Greeleyschool District No. 6 In The County Of Weld And Sta (urban): math 15% / reading 31% proficiency, ranked #71 of 86 in CO (top 83%) — low school quality limits family demand, transient renter base, plan for 1-2y turnover.
- Market conditions: Rents soft (-2.3%/yr); 414 active listings in the ZIP; 22 comparable units currently listed for rent nearby; rentals leasing fast (median 14d on market — plan ~1-2 weeks tenant-placement turnaround); solid renter incomes; 3,170 units permitted in Weld County in 2024 (278 in 5+ unit buildings).
Forward outlook
- Local home prices are declining (-3.0%/yr); year-one equity from $532 of loan paydown is wiped out by about $2k of value loss. Plan a longer hold.
- Weld County population projected at +46% by 2050 — long-run rental-demand tailwind backs the buy-and-hold thesis.
- At projected returns (-3.0% appreciation + 0.0% rent growth), your $22k cash investment doubles in ~3 years — after that, you're playing with house money.
Negotiation context
- It's been on market 202 days — a 12% lower offer ($68k) is reasonable based on typical stale-listing flexibility.
- Current owner paid $15k; list at $77k implies a 413% gain — meaningful room to come down on a strong offer.
Questions for the listing agent
- It's been on market 202 days. Have you received any prior offers? Is the seller open to a 12% concession, seller financing, or rate buy-down credit?
- Why hasn't it sold? Are there any deal-killer items the seller is aware of (foundation, flood, title, zoning, code violations)?
- Is there a deadline driving the sale (1031 exchange, divorce, estate, relocation)? That informs how much negotiation room exists.
- Schools are F-rated, which usually means shorter tenancies and higher turnover. Who's the typical renter profile here, and what's been the actual vacancy rate?
- What's the average days-on-market for RENTAL listings here right now (not sales)? A rising rental-DOM trend means longer vacancies and softer asking-rent achievability than the comps imply.
- What's the recent tenant-quality profile in this submarket — average credit score on applications, eviction rate, late-payment / NSF rate, and stable-employment percentage? A property-management company in the area should have these aggregated.
- How much new for-sale + rental construction is in the pipeline within 1–3 miles? Heavy new supply typically softens prices + rents 12–24 months out; constrained supply supports both.
Investment metrics
- 1% rule
- 2.38% ✓
- Cap rate
- 21.70%
- Cash-on-cash
- 55.04%
- DSCR
- 3.45
- GRM
- 3.5
CMA / ARV
- ARV (on-the-fly)
- $88,480
- Comps found
- 6
Show comp detail 6 sales within ~0.75 mi
| Address | Dist | Beds/Ba | Sqft | Sold | Price | $/sf | Match |
|---|---|---|---|---|---|---|---|
| 3500 35th Ave #193 | 0.10mi | 3/2.0 | 1,064 (-5%) | 13mo | $69,500 | $65 | 76 |
| 3500 35th Ave #184 | 0.13mi | 3/2.0 | 1,216 (+9%) | 23mo | $79,900 | $66 | 60 |
| 4210 Cedar Ln #185 | 0.75mi | 3/2.0 | 1,216 (+9%) | 4mo | $99,500 | $82 | 47 |
| 3366 Bluegrass Cir | 0.59mi | 3/2.0 | 1,232 (+10%) | 15mo | $119,000 | $97 | 43 |
| 3013 Foxtail Ln #445 | 0.73mi | 3/2.0 | 1,216 (+9%) | 19mo | $96,000 | $79 | 36 |
| 3013 Foxtail Ln | 0.73mi | 3/2.0 | 1,216 (+9%) | 19mo | $96,000 | $79 | 36 |
Match score weights: distance 35% · size 25% · config 20% · recency 20%. Top-matched comps best support the ARV.
Projected returns pro-forma
-3.0% appreciation · 0.0% rent growth · sell at horizon
- IRR
- 50.0%
- Equity multiple
- 3.09×
- Total profit
- $45,116
- Equity at exit
- $11,481
- IRR
- 54.3%
- Equity multiple
- 5.62×
- Total profit
- $99,555
- Equity at exit
- $6,658
Cash invested: $21,560 (down + closing). Projections, not guarantees.
Landlord ↔ Tenant lean methodology
- Overall (STATE)
- 38 Tenant-Leaning
- State Colorado
- 38 Tenant-Leaning · D+4
- County
- — inherits STATE
- City
- — inherits STATE
ZIP-level market 80634
- Rents YoY
- -2.3%
- Active inventory
- 414
- Price-to-rent
- 3.5×
Monthly cashflow live
- Estimated rent
- $1,833 high interval (Pro) →
- Mortgage (P&I)
- −$404
- Tax from tax record
- −$24 /mo · $282/yr
- Insurance
- −$32
- HOA
- −$0
- Vacancy / Maint / Mgmt
- −$385
- Net cashflow
- $989
Break-even live
UW: 25.0% down · 7.5% · 30yr · 1.5% tax · 5.0% vac · 8.0% maint · 8.0% mgmt
Financing live
Cash to close
- Down payment
- $19,250
- Closing costs
- $2,310
- Reserves months
- —
- Total cash needed
- —
Loan-product check · same deal, 3 products live
Conventional
25% down · 7.5% · 30yr
- Down + closing
- —
- Monthly P&I
- —
- Monthly cashflow
- —
- DSCR
- —
- Eligible?
- —
Personal DTI + credit; lowest rate.
DSCR
20% down · 8.5% · 30yr
- Down + closing
- —
- Monthly P&I
- —
- Monthly cashflow
- —
- DSCR
- —
- Eligible?
- —
No personal income docs; deal must DSCR.
Hard money
10% down · 12.0% · 12mo
- Down + closing
- —
- Monthly P&I
- —
- Monthly cashflow
- —
- DSCR
- —
- Eligible?
- —
Short-term bridge; refi at stabilization.
Rent comps 22 comps
| Address | Beds | Baths | Sqft | Rent | $/sqft | DOM | Units | Dist |
|---|---|---|---|---|---|---|---|---|
| 2846 Arbor Dr #2898 Evans, CO | 2.0 | 1.5–2.0 | 1327 | $1,738 | $1.31 | 13d | 3 | 0.37mi |
| 3301 Abbey Rd Evans, CO | 1.0–3.0 | 1.0–2.0 | 913 | $2,112 | $2.31 | 13d | 10 | 0.47mi |
| 3770 Ponderosa Ct #1 Evans, CO | 2.0 | 2.0 | 1047 | $1,650 | $1.58 | 23d | 1 | 0.53mi |
| 2506 32nd St Evans, CO | 2.0–3.0 | 2.0 | 1155 | $2,025 | $1.75 | 23d | 1 | 0.55mi |
| 2507 W 27th St Apt C Greeley, CO | 2.0 | 1.5 | 1064 | $1,225 | $1.15 | 23d | 1 | 1.02mi |
| 2162 30th St Greeley, CO | 1.0–3.0 | 1.0–1.5 | 688 | $1,399 | $2.03 | 13d | 16 | 1.04mi |
| 3800 Centerplace Dr Greeley, CO | 1.0–3.0 | 1.0–2.0 | 973 | $2,356 | $2.42 | 13d | 18 | 1.10mi |
| 3775 W 25th St Greeley, CO | 1.0–2.0 | 1.0–2.0 | 855 | $1,570 | $1.84 | 13d | 4 | 1.24mi |
| 1751 Rowan Ln Evans, CO | 2.0 | 1.5 | 841 | $1,750 | $2.08 | 13d | 1 | 1.27mi |
| 4620 Tuscany St Evans, CO | 1.0–3.0 | 1.0–2.0 | 1016 | $2,350 | $2.31 | 23d | 1 | 1.30mi |
| 3770 W 24th St Greeley, CO | 2.0 | 1.0–2.0 | 936 | $1,434 | $1.53 | 23d | 6 | 1.31mi |
| 2310 W 25th Street Rd Greeley, CO | 3.0 | 1.0 | 1000 | $1,700 | $1.70 | 13d | 1 | 1.31mi |
| 1725 Rowan Ln Evans, CO | 3.0 | 1.5 | 1190 | $2,099 | $1.76 | 13d | 1 | 1.32mi |
| 1750 Greeley Mall Greeley, CO | 1.0–2.0 | 1.0–2.0 | 805 | $1,573 | $1.95 | 13d | 4 | 1.34mi |
| 2405 38th Ave Greeley, CO | 2.0 | 1.0–2.0 | 884 | $1,945 | $2.20 | 13d | 19 | 1.36mi |
| 1722 30th St Greeley, CO | 1.0–2.0 | 1.0 | 709 | $1,355 | $1.91 | 1d | 13 | 1.37mi |
| 1905 28th St Greeley, CO | 2.0 | 1.5 | 900 | $1,330 | $1.48 | 13d | 2 | 1.38mi |
| 2551 W 24th St Greeley, CO | 2.0–3.0 | 1.0–2.0 | 1160 | $1,700 | $1.47 | 23d | 1 | 1.41mi |
| 2420 W Reservoir Rd Greeley, CO | 3.0 | 1.0–2.0 | 878 | $2,256 | $2.57 | 13d | 20 | 1.45mi |
| 1713 28th St Greeley, CO | 2.0 | 1.0 | 800 | $1,295 | $1.62 | 13d | 1 | 1.46mi |
| 4750 29th St Greeley, CO | 1.0–3.0 | 1.0–2.0 | 1007 | $2,130 | $2.11 | 13d | 20 | 1.47mi |
| 2820 17th Ave #201 Greeley, CO | 3.0 | 2.0 | 1118 | $1,750 | $1.57 | 23d | 1 | 1.48mi |
Listing history 18 events
-
2026-06-18days on market $77,000 Active 202 DOM
-
2026-06-17days on market $77,000 Active 201 DOM
-
2026-06-16days on market $77,000 Active 200 DOM
-
2026-06-15days on market $77,000 Active 199 DOM
-
2026-06-14days on market $77,000 Active 197 DOM
-
2026-06-10days on market $77,000 Active 194 DOM
-
2026-06-09days on market $77,000 Active 193 DOM
-
2026-06-08days on market $77,000 Active 192 DOM
-
2026-06-07days on market $77,000 Active 191 DOM
-
2026-06-03days on market $77,000 Active 187 DOM
-
2026-06-02days on market $77,000 Active 186 DOM
-
2026-06-01days on market $77,000 Active 185 DOM
-
2026-05-31days on market $77,000 Active 184 DOM
-
2026-05-30days on market $77,000 Active 183 DOM
-
2026-02-28price $77,000
-
2025-11-28$80,000 Active
-
2011-09-21soldstatus $15,000
-
2008-10-07soldstatus $19,500
ⓘ Source: listings_history table (triggers on properties + properties_extension) + one-shot
backfill from property_details.listing_events for pre-trigger history.
Tax reassessment forecast CO · Resets to sale price
- Current annual tax
- $282 · $24/mo
- Projected year-2 tax
- $424 · $35/mo
- Expected delta
- +$141/yr (+$12/mo · 50.2%)
ⓘ Screening estimate from a state-policy table — verify with the county assessor before closing.
Climate risk First Street
- Flood 1/10 Low FEMA zone X (unshaded) · 0% chance over 30 yrs
- Wildfire 4/10 Moderate
- Heat 3/10 Moderate 7 d/yr ≥95°F today · 17 d/yr by 30 yrs out
- Wind 2/10 Low
- Air quality 4/10 Moderate 5 unhealthy d/yr today · 5 by 30 yrs out
Nearby sold comps map
Loading sold comps map…
Walkable amenities ~0.75 mi
Loading nearby amenities…
Taxation est. · year 1
- Rental income
- $21,999
- − Mortgage interest
- −$4,313
- − Property taxes
- −$282
- − Insurance
- −$385
- − Repairs & maintenance
- −$1,760
- − Management
- −$1,760
- − Depreciation
- −$2,240
- Taxable income
- $11,259
- Est. tax owed @ 24.0%
- −$2,702
- After-tax cash flow
- $9,165/yr
For passive investors: Depreciation is non-cash, so a rental often shows a tax loss while cash-flowing — sheltering income. Rental losses are passive: they offset passive income freely, and up to $25,000/yr can offset ordinary (W-2) income if you actively participate and your MAGI is under $100k (phasing out to $0 by $150k); unused losses carry forward. On sale, claimed depreciation is recaptured at up to 25%, and gains may owe capital-gains tax (a 1031 exchange can defer both). Figures are a year-1 estimate at your 24.0% rate — not tax advice; consult a CPA.
Schools (NCES district)
- District
- Greeleyschool District No. 6 In The County Of Weld And Sta
- NCES district ID
- 0804410
- Math proficiency
- 15% ▼ -7.00%
- Reading proficiency
- 31% ▼ -4.00%
- Median HH income
- $46,417
- Composite
- 19.99/100
- National rank
- #8667
- State rank
- #71 of 86 in CO
Livability — Evans
- Score
- 69/100
- State rank
- #104
- US rank
- #9005
Category grades
Schools grade is shown separately in the Schools card above.
Census & demographics
- County
- Weld County · 332,652 people
- City population
- 20,798
- Metro
- Greeley, CO
- Population (ZIP)
- 65,622
- Household income
- $82,742
- Rent vs Own
- Severe rent burden
- 2101.0
Population outlook (Weld County) Hauer SSP2
- Today (2025)
- 351,957 people
- By 2030
- 385,304 · +9.5%
- By 2040
- 451,818 · +28.4%
- By 2050
- 514,478 · +46.2%
- By 2075
- 648,733 · +84.3%
- By 2100
- 720,400 · +104.7%
Race, ethnicity, and origin ACS 2023
- Neighborhood character
- Majority White (64%)
- Race & ethnicity
- White 64% Hispanic / Latino 30% Two or more races 13% Asian 1% Black 1% Native American 1%
- Hispanic origin (detail)
- Mexican 25% Puerto Rican 1%
- Common ancestry
- Italian 2% Slovak 2% Lithuanian 2%
- Foreign-born
- 7% · Canada
- Languages at home
- 83% English-only · Spanish 14% German/W. Germanic 1%
Political lean MEDSL · Weld
- 2024 margin
- Strong R (+21.0) · D 38.2% · R 59.2% · Other 2.6%
- 2008→2024 swing
- -12.2pp toward R · 2008: -8.7pp · 2024: -21.0pp
- All cycles
- 2024: R+21.0 2020: R+18.0 2016: R+22.4 2012: R+13.2 2008: R+8.7
Not yet ingested
- Civics
- —
Market trends
- HPI YoY
- ▼ -358.79%
- Current HPI
- 254.9376
- Rent YoY
- ▼ -2.34%
- Metro
- Greeley, CO
- State GDP YoY
- ▲ 1.95%
- F500 in state
- 14
Industry mix (Fortune 500 HQ in CO)
| Industry | F500 HQs | Revenue |
|---|---|---|
| Technology Distribution | 1 | $31B |
|
||
| Food / Agriculture | 1 | $18B |
|
||
| Packaging | 1 | $14B |
|
||
| Healthcare | 1 | $13B |
|
||
| Energy | 1 | $10B |
|
||
| Technology | 1 | $4B |
|
||
Price history
+294.9% since first listed4 events — show timeline
- 2026-02-28 Price Changed $77,000 IRES
- 2025-11-28 Listed $80,000 IRES
- 2011-09-21 Sold (Public Records) $15,000 Public Records
- 2008-10-07 Sold (Public Records) $19,500 Public Records
Property tax history
+8.9%/yrLatest (2025): $282 · +237.3% YoY. Source: county tax records.
Cash-flow waterfall
monthlySold comps — $/sqft
last 12 mo · ≤1 miLoading sold comps…