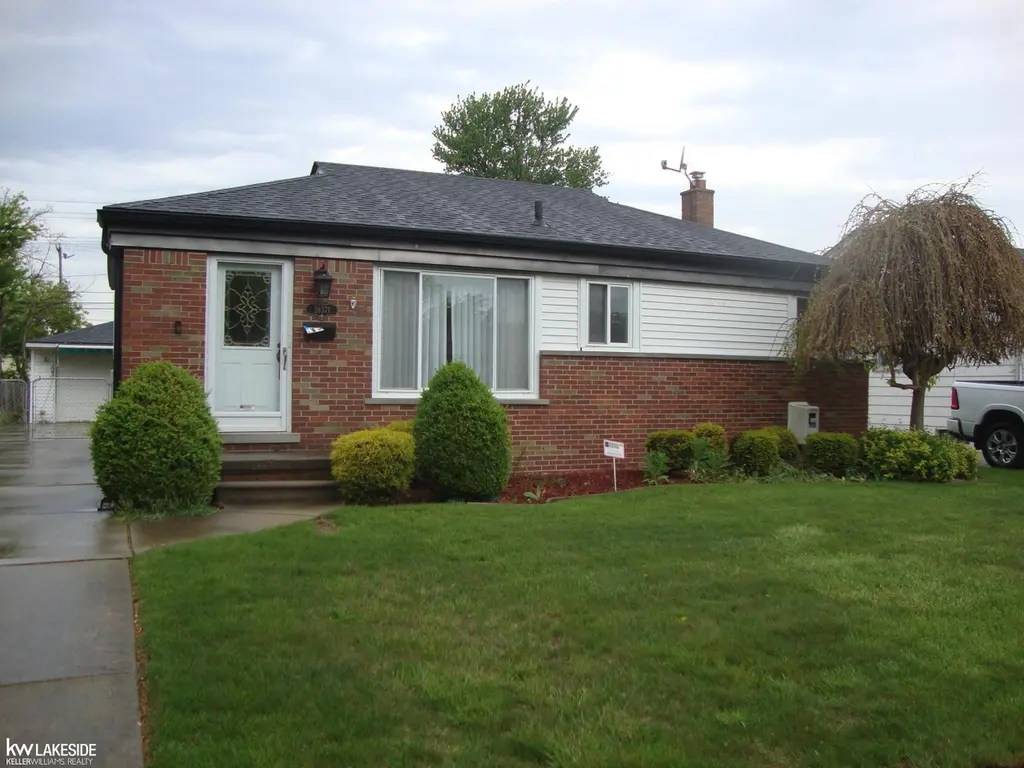
26371 Bryan St · Roseville, MI
Flood risk 1/10 · Minimal
- FEMA flood zone
- X (unshaded)
- Chance of flooding over 30 yrs
- 0.0%
- Est. flood insurance / yr
- $473 – $860
Fire risk 1/10 · Minimal
- Est. fire insurance / yr
- $784 – $1,456
Heat risk 3/10 · Minor
- Hot days now (above 96°F)
- 7 days/yr
- Hot days in 30 yrs
- 15 days/yr
Wind risk 1/10 · Minimal
- Chance of severe wind over 30 yrs
- —
Air-quality risk 3/10 · Minor
- Unhealthy air days now
- 3 days/yr
- Unhealthy air days in 30 yrs
- 4 days/yr
Risk factors via First Street. Map © Google.
Why this score? — see what drove the F grade
The composite is a weighted blend of 9 inputs, each scored 0–100. Each bar is that input's sub-score; the figure is the points it added to the 100-point composite (weight × sub-score).
- Cash flow +13.7/30.0
- DSCR +4.1/10.0
- Livability +3.6/5.0
- 1% rule +3.4/10.0
- Rent growth +2.6/5.0
- Condition / age +2.5/5.0
- Schools +1.5/10.0
- ARV discount +0.0/15.0
- Appreciation +0.0/10.0
$185,000
🖨 Deal sheet 📄 Offer letter ✓ Due diligence
Listing remarks MLS
Welcome home to this charming and well-maintained property located in a quiet neighborhood close to shopping, schools, and everyday conveniences. This spacious home features 3 bedrooms, 2 full bathrooms, a finished basement, and a 2-car detached garage offering plenty of storage and parking space. The kitchen is equipped with newer stainless steel appliances, adding a modern touch and making meal prep a breeze. Enjoy peace of mind with a new hot water heater, and furnace and a fully fenced yard—perfect for pets, kids, or outdoor gatherings. With comfortable living spaces, and a convenient location, this home is move-in ready and waiting for its next owners
Key facts
- New furnace
- New hot water heater
- Finished basement
Tags
Property features AI
Finance
- HOA & community: Homeowners association present
Exterior
- Parking: Detached 2-car garage
- Utilities: Public water; Public sewer
- Home design: Single-family residence; One level
- Construction: Aluminum siding and brick exterior; Finished concrete basement
- Exterior features: Patio; Fenced yard; Paved public road access; Lot roughly 50 x 125 (0.14 acres)
Interior
- Kitchen: Dishwasher; Microwave; Oven; Range; Refrigerator; Gas water heater
- Bathrooms: 2 full bathrooms
- Heating & cooling: Central air; Ceiling fan(s); Forced air heating; Natural gas heating
- Interior features: Eat-in kitchen; Window treatments
Neighborhood map
What this means for you Summary
Snapshot
- This is a 3-bed/2.0-bath single-family listed at $185k.
Deal economics
- At list price, monthly cash flow is $13 ($156/yr) — positive.
- The deal already cash-flows at list — no discount required.
- To meet the 1% rule (rent ≥ 1% of price), the offer needs to be $156k (15.5% below list).
- Recommended offer: $156k (15.5% below list) — sets the bar for 1% rule.
Location & tenants
- Location reads 72/100 on livability (#258 in MI) — a middle-class / working-renter tenant base. Strengths: commute A+, cost of living A+, housing A+; Watch: health & safety D+, employment D, schools F.
- Roseville Community Schools (suburban): math 11% / reading 24% proficiency, ranked #483 of 540 in MI (top 89%) — low school quality limits family demand, transient renter base, plan for 1-2y turnover; 60% free/reduced lunch — lower-income household profile, screen leases tightly.
- Market conditions: Rents flat; 265 active listings in the ZIP; 24 comparable units currently listed for rent nearby; rentals at typical pace (median 22d on market — plan ~3-4 weeks tenant-placement turnaround); 1,321 units permitted in Macomb County in 2024 (86 in 5+ unit buildings).
- This rent runs 30% of the median local income ($62k/yr) — at the standard rent-burdened threshold; future hikes will face affordability resistance.
Forward outlook
- Local home prices are declining (-3.0%/yr); year-one equity from $1k of loan paydown is wiped out by about $6k of value loss. Plan a longer hold.
- Macomb County population projected at +9% by 2050 — modest demand growth; plan on rents tracking national, not racing it.
Negotiation context
- Only 2 days on market — expect competitive offers; lowballing is unlikely to land.
- 2 sale attempts with the ask held roughly flat each time — persistent listings suggest the price (not the market) is what's stuck; bring a comps-based counter.
Risks & watch-outs
- Watch-outs: built in 1954 — expect roof / HVAC / electrical / plumbing capex.
Questions for the listing agent
- Built in 1954 — when were the roof, HVAC, electrical panel, plumbing, and water heater last replaced?
- Is there a deadline driving the sale (1031 exchange, divorce, estate, relocation)? That informs how much negotiation room exists.
- Schools are F-rated, which usually means shorter tenancies and higher turnover. Who's the typical renter profile here, and what's been the actual vacancy rate?
- Crime grade is F in this area — have there been break-ins, vandalism, or insurance claims at this property in the last 3 years? What carrier currently insures it and at what premium?
- The area grade is low — what's the realistic commute time and amenity access for the typical tenant pool here? Any planned neighborhood developments (good or bad) we should know about?
- What's the average days-on-market for RENTAL listings here right now (not sales)? A rising rental-DOM trend means longer vacancies and softer asking-rent achievability than the comps imply.
- What's the recent tenant-quality profile in this submarket — average credit score on applications, eviction rate, late-payment / NSF rate, and stable-employment percentage? A property-management company in the area should have these aggregated.
- How much new for-sale + rental construction is in the pipeline within 1–3 miles? Heavy new supply typically softens prices + rents 12–24 months out; constrained supply supports both.
Investment metrics
- 1% rule
- 0.84% ✗
- Cap rate
- 6.38%
- Cash-on-cash
- 0.30%
- DSCR
- 1.01
- GRM
- 9.9
CMA / ARV
- ARV (on-the-fly)
- $132,912
- Comps found
- 12
Show comp detail 12 sales within ~0.75 mi
| Address | Dist | Beds/Ba | Sqft | Sold | Price | $/sf | Match |
|---|---|---|---|---|---|---|---|
| 15010 Petrie St | 0.05mi | 3/1.0 | 936 (0%) | 3mo | $180,000 | $192 | 91 |
| 26501 Clancy St | 0.25mi | 3/1.0 | 924 (-1%) | 4mo | $154,900 | $168 | 79 |
| 26710 Lehner St | 0.30mi | 3/1.0 | 924 (-1%) | 3mo | $180,000 | $195 | 77 |
| 26153 Nagel St | 0.36mi | 3/1.0 | 924 (-1%) | 2mo | $101,000 | $109 | 76 |
| 26621 Kathy St | 0.45mi | 3/1.0 | 924 (-1%) | 0mo | $155,900 | $169 | 73 |
| 26234 Woodmont St | 0.50mi | 3/1.0 | 960 (+3%) | 1mo | $124,000 | $129 | 67 |
| 27241 Woodmont St | 0.66mi | 3/1.0 | 924 (-1%) | 1mo | $122,000 | $132 | 62 |
| 27281 Gloede Dr | 0.57mi | 2/1.0 (-1) | 918 (-2%) | 2mo | $119,900 | $131 | 59 |
| 27320 Grandmont St | 0.75mi | 3/1.0 | 924 (-1%) | 2mo | $160,000 | $173 | 58 |
| 27321 Grandmont St | 0.73mi | 3/1.0 | 924 (-1%) | 3mo | $107,500 | $116 | 57 |
| 25118 Rosenbusch Blvd | 0.65mi | 2/1.0 (-1) | 950 (+2%) | 4mo | $135,000 | $142 | 55 |
| 25287 Leach St | 0.47mi | 2/1.0 (-1) | 1,072 (+14%) | 0mo | $108,500 | $101 | 44 |
Match score weights: distance 35% · size 25% · config 20% · recency 20%. Top-matched comps best support the ARV.
Projected returns pro-forma
-3.0% appreciation · 0.39% rent growth · sell at horizon
- IRR
- -18.7%
- Equity multiple
- 0.36×
- Total profit
- $-33,161
- Equity at exit
- $27,584
- IRR
- -17.1%
- Equity multiple
- 0.16×
- Total profit
- $-43,433
- Equity at exit
- $15,995
Cash invested: $51,800 (down + closing). Projections, not guarantees.
Landlord ↔ Tenant lean methodology
- Overall (STATE)
- 62 Landlord-Friendly
- State Michigan
- 62 Landlord-Friendly · EVEN
- County
- — inherits STATE
- City
- — inherits STATE
ZIP-level market 48066
- Rents YoY
- 0.4%
- Active inventory
- 265
- Price-to-rent
- 9.9×
Monthly cashflow live
- Estimated rent
- $1,563 high interval (Pro) →
- Mortgage (P&I)
- −$970
- Tax from tax record
- −$175 /mo · $2,094/yr
- Insurance
- −$77
- HOA
- −$0
- Vacancy / Maint / Mgmt
- −$328
- Net cashflow
- $13
Break-even live
UW: 25.0% down · 7.5% · 30yr · 1.5% tax · 5.0% vac · 8.0% maint · 8.0% mgmt
Financing live
Cash to close
- Down payment
- $46,250
- Closing costs
- $5,550
- Reserves months
- —
- Total cash needed
- —
Loan-product check · same deal, 3 products live
Conventional
25% down · 7.5% · 30yr
- Down + closing
- —
- Monthly P&I
- —
- Monthly cashflow
- —
- DSCR
- —
- Eligible?
- —
Personal DTI + credit; lowest rate.
DSCR
20% down · 8.5% · 30yr
- Down + closing
- —
- Monthly P&I
- —
- Monthly cashflow
- —
- DSCR
- —
- Eligible?
- —
No personal income docs; deal must DSCR.
Hard money
10% down · 12.0% · 12mo
- Down + closing
- —
- Monthly P&I
- —
- Monthly cashflow
- —
- DSCR
- —
- Eligible?
- —
Short-term bridge; refi at stabilization.
Rent comps 24 comps
| Address | Beds | Baths | Sqft | Rent | $/sqft | DOM | Units | Dist |
|---|---|---|---|---|---|---|---|---|
| 26160 Regency Club Dr Warren, MI | 1.0–3.0 | 1.0–2.0 | 1011 | $1,998 | $1.98 | 1d | 15 | 0.15mi |
| 26711 Lehner St Roseville, MI | 3.0 | 1.0 | 960 | $1,575 | $1.64 | 24d | 1 | 0.28mi |
| 26153 Nagel St Roseville, MI | 3.0 | 1.0 | 924 | $1,500 | $1.62 | 14d | 1 | 0.38mi |
| 25672 Lira Ln Warren, MI | 2.0 | 1.0 | 831 | $1,250 | $1.50 | 17d | 1 | 0.43mi |
| 26536 Kathy St Roseville, MI | 3.0 | 1.0 | 1000 | $1,499 | $1.50 | 24d | 1 | 0.47mi |
| 26511 Grandmont St Roseville, MI | 3.0 | 1.0 | 960 | $1,495 | $1.56 | 4d | 1 | 0.55mi |
| 25202 Firwood Ave Warren, MI | 3.0 | 1.0 | 1100 | $1,350 | $1.23 | 24d | 1 | 0.60mi |
| 27241 Woodmont St Roseville, MI | 3.0 | 1.0 | 924 | $1,550 | $1.68 | 1d | 1 | 0.66mi |
| 25107 Rosenbusch Blvd Warren, MI | 3.0 | 1.0 | 903 | $1,523 | $1.69 | 14d | 1 | 0.70mi |
| 25184 Wiseman St Roseville, MI | 3.0 | 1.0 | 895 | $1,750 | $1.96 | 21d | 1 | 0.71mi |
| 25184 Wiseman St Roseville, MI | 3.0 | 1.0 | 1000 | $1,750 | $1.75 | 3d | 1 | 0.71mi |
| 13741 McKinley Ave Unit 1032320P Warren, MI | 2.0 | 1.0 | 839 | $5,023 | $5.99 | 1d | 1 | 0.92mi |
| 16840 E Eleven Mile Rd Roseville, MI | 2.0 | 1.0 | 900 | $1,300 | $1.44 | 21d | 3 | 1.06mi |
| 16840 E Eleven Mile Rd Roseville, MI | 2.0 | 1.0 | 900 | $1,300 | $1.44 | 24d | 3 | 1.06mi |
| 16840 E Eleven Mile Rd Unit 104 Roseville, MI | 2.0 | 1.0 | 900 | $1,200 | $1.33 | 43d | 1 | 1.06mi |
| 16840 E 11 Mile Rd Unit 109 Roseville, MI | 2.0 | 1.0 | 900 | $1,400 | $1.56 | 43d | 1 | 1.06mi |
| 16840 E Eleven Mile Rd Unit 103 Roseville, MI | 2.0 | 1.0 | 900 | $1,250 | $1.39 | 43d | 1 | 1.06mi |
| 16944 E 11 Mile Rd Unit C2 Roseville, MI | 2.0 | 1.0 | 900 | $1,295 | $1.44 | 24d | 1 | 1.13mi |
| 13006 E 11 Mile Rd Unit 6 Warren, MI | 2.0 | 1.0 | 850 | $1,075 | $1.26 | 14d | 1 | 1.32mi |
| 13006 E 11 Mile Rd Unit 6 Warren, MI | 2.0 | 1.0 | 850 | $1,050 | $1.24 | 43d | 1 | 1.32mi |
| 17639 Oakdale St Roseville, MI | 2.0 | 1.0 | 812 | $1,200 | $1.48 | 44d | 1 | 1.47mi |
| 17392 Tennyson St Roseville, MI | 3.0 | 1.0 | 900 | $1,649 | $1.83 | 2d | 1 | 1.48mi |
| 26221 Pinehurst St Roseville, MI | 2.0 | 1.0 | 1000 | $1,200 | $1.20 | 1d | 1 | 1.48mi |
| 26251 Pinehurst St Unit 251d Roseville, MI | 2.0 | 1.0 | 1000 | $1,200 | $1.20 | 43d | 1 | 1.49mi |
Listing history 3 events
-
2026-06-01status $185,000 Pending 2 DOM
-
2026-05-31remarks 699-char remark
-
2026-05-31days on market $185,000 Active 2 DOM
ⓘ Source: listings_history table (triggers on properties + properties_extension) + one-shot
backfill from property_details.listing_events for pre-trigger history.
Tax reassessment forecast MI · Partial reset (capped growth)
- Current annual tax
- $2,094 · $175/mo
- Projected year-2 tax
- $2,472 · $206/mo
- Expected delta
- +$377/yr (+$31/mo · 18.0%)
ⓘ Screening estimate from a state-policy table — verify with the county assessor before closing.
Climate risk First Street
- Flood 1/10 Low FEMA zone X (unshaded) · 0% chance over 30 yrs
- Wildfire 1/10 Low
- Heat 3/10 Moderate 7 d/yr ≥96°F today · 15 d/yr by 30 yrs out
- Wind 1/10 Low
- Air quality 3/10 Moderate 3 unhealthy d/yr today · 4 by 30 yrs out
Nearby sold comps map
Loading sold comps map…
Walkable amenities ~0.75 mi
Loading nearby amenities…
Taxation est. · year 1
- Rental income
- $18,756
- − Mortgage interest
- −$10,363
- − Property taxes
- −$2,094
- − Insurance
- −$925
- − Repairs & maintenance
- −$1,500
- − Management
- −$1,500
- − Depreciation
- −$5,382
- Taxable loss
- −$3,009
- Est. tax savings @ 24.0%
- +$722
- After-tax cash flow
- $878/yr
For passive investors: Depreciation is non-cash, so a rental often shows a tax loss while cash-flowing — sheltering income. Rental losses are passive: they offset passive income freely, and up to $25,000/yr can offset ordinary (W-2) income if you actively participate and your MAGI is under $100k (phasing out to $0 by $150k); unused losses carry forward. On sale, claimed depreciation is recaptured at up to 25%, and gains may owe capital-gains tax (a 1031 exchange can defer both). Figures are a year-1 estimate at your 24.0% rate — not tax advice; consult a CPA.
Schools (NCES district)
- District
- Roseville Community Schools
- NCES district ID
- 2630210
- Math proficiency
- 11% ▼ -8.00%
- Reading proficiency
- 24% ▼ -7.00%
- Median HH income
- $41,590
- Composite
- 14.98/100
- National rank
- #9363
- State rank
- #483 of 540 in MI
Livability — Roseville
- Score
- 72/100
- State rank
- #258
- US rank
- #6400
Category grades
Schools grade is shown separately in the Schools card above.
Census & demographics
- Census place
- Roseville, MI
- County
- Macomb County · 638,552 people
- City population
- 47,123
- Metro
- Detroit-Warren-Dearborn, MI
- Population (ZIP)
- 47,123
- Household income
- $62,182
- Rent vs Own
- Severe rent burden
- 1712.0
Population outlook (Macomb County) Hauer SSP2
- Today (2025)
- 925,296 people
- By 2030
- 948,226 · +2.5%
- By 2040
- 983,961 · +6.3%
- By 2050
- 1,010,200 · +9.2%
- By 2075
- 1,076,222 · +16.3%
- By 2100
- 1,077,065 · +16.4%
Race, ethnicity, and origin ACS 2023
- Neighborhood character
- Predominantly White (65%)
- Race & ethnicity
- White 65% Black 23% Two or more races 7% Hispanic / Latino 4% Asian 2%
- Common ancestry
- Romanian 12% Lithuanian 4% Slovak 2%
- Foreign-born
- 5% · Canada
- Languages at home
- 93% English-only · Spanish 2% Russian/Polish/Slavic 1% Other Indo-European 1%
Political lean MEDSL · Macomb
- 2024 margin
- R (+13.7) · D 42.2% · R 55.9% · Other 1.9%
- 2008→2024 swing
- -22.3pp toward R · 2008: 8.6pp · 2024: -13.7pp
- All cycles
- 2024: R+13.7 2020: R+8.1 2016: R+11.6 2012: D+4.0 2008: D+8.6
Not yet ingested
- Civics
- —
Market trends
- HPI YoY
- ▼ -232.95%
- Current HPI
- 217.4171
- Rent YoY
- ▲ 0.39%
- Metro
- Detroit-Warren-Dearborn, MI
- State GDP YoY
- ▲ 1.37%
- F500 in state
- 28
Industry mix (Fortune 500 HQ in MI)
| Industry | F500 HQs | Revenue |
|---|---|---|
| Automotive Parts | 3 | $48B |
|
||
| Automotive | 2 | $372B |
|
||
| Chemicals | 1 | $45B |
|
||
| Automotive Retail | 1 | $29B |
|
||
| Healthcare / Medical Devices | 1 | $23B |
|
||
| Automotive Technology | 1 | $20B |
|
||
Price history
+0.0% since first listed2 events — show timeline
- 2026-05-29 Listed $185,000 REALCOMP
- 2026-05-29 Listed $185,000 MiRealSource-MiMLS
Property tax history
+4.5%/yrLatest (2025): $2,094 · +4.3% YoY. Source: county tax records.
Cash-flow waterfall
monthlySold comps — $/sqft
last 12 mo · ≤1 miLoading sold comps…