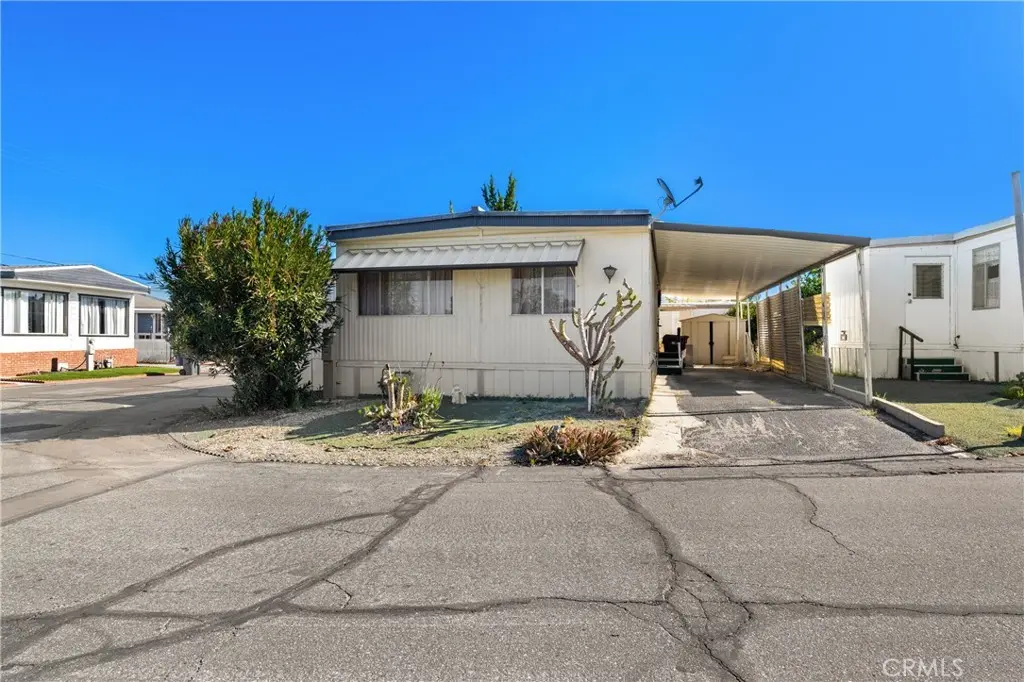
42751 E Florida Ave #146 · Valle Vista, CA
Flood risk 1/10 · Minimal
- FEMA flood zone
- X (unshaded)
- Chance of flooding over 30 yrs
- 0.0%
- Est. flood insurance / yr
- $507 – $1,088
Fire risk 8/10 · Major
- Est. fire insurance / yr
- $659 – $1,223
Heat risk 7/10 · Major
- Hot days now (above 103°F)
- 5 days/yr
- Hot days in 30 yrs
- 15 days/yr
Wind risk 1/10 · Minimal
- Chance of severe wind over 30 yrs
- —
Air-quality risk 6/10 · Moderate
- Unhealthy air days now
- 10 days/yr
- Unhealthy air days in 30 yrs
- 12 days/yr
Risk factors via First Street. Map © Google.
Why this score? — see what drove the D grade
The composite is a weighted blend of 9 inputs, each scored 0–100. Each bar is that input's sub-score; the figure is the points it added to the 100-point composite (weight × sub-score).
- Cash flow +15.0/30.0
- ARV discount +7.5/15.0
- 1% rule +5.0/10.0
- DSCR +5.0/10.0
- Rent growth +3.7/5.0
- Livability +2.9/5.0
- Schools +2.5/10.0
- Condition / age +2.5/5.0
- Appreciation +0.0/10.0
$29,900
🖨 Deal sheet 📄 Offer letter ✓ Due diligence
Listing remarks MLS
Affordable living with this 2 bedroom 2 bath in Arroyo Fairways 55yr+ senior mobile home park featuring on-site golf course, pool, spa, clubhouse and loads of other amenities. Living room/dining combo with built-in china hutch and ceiling fan. Step-saver kitchen with gas oven and cook top. Primary bedroom has walk-in closet, built-in vanity and en-suite bathroom. Inside laundry. Enclosed front porch. Security screen doors. Carport. Shed. Easy care yard. Major fixer-upper opportunity. In need of significant renovations. Owner will carry financing.
Key facts
- Clubhouse
- Ceiling fan
- Spa
Tags
Neighborhood map
What this means for you Summary
Snapshot
- This is a 2-bed/2.0-bath manufactured listed at $30k.
Deal economics
- At list price, monthly cash flow is $1k ($14k/yr) — positive.
- The deal already cash-flows at list — no discount required.
- Meets the 1% rule at list price ($2k rent vs $30k).
- Recommended offer: $26k (12.0% below list) — sets the bar for market timing.
- Cap rate 54.3% vs local median 4.3% in Valle Vista — top-decile yield for the area; either an underpriced asset or a hidden risk that comps aren't pricing in. Stress-test before assuming the spread holds.
Location & tenants
- Location reads 57/100 on livability (#739 in CA) — a working-class tenant base; expect higher turnover. Strengths: housing A+; Watch: employment D+, schools F, crime F.
- Hemet Unified (suburban): math 19% / reading 41% proficiency, ranked #360 of 517 in CA (top 70%) — families likely to look elsewhere, expect single-tenant / working-renter base with shorter leases; 66% free/reduced lunch — lower-income household profile, screen leases tightly.
- Market conditions: Rents rising fast (+4.9%/yr); 323 active listings in the ZIP; 21 comparable units currently listed for rent nearby; rentals at typical pace (median 24d on market — plan ~3-4 weeks tenant-placement turnaround); 9,195 units permitted in Riverside County in 2024 (1,512 in 5+ unit buildings).
Forward outlook
- Local home prices are declining (-3.0%/yr); year-one equity from $207 of loan paydown is wiped out by about $897 of value loss. Plan a longer hold.
- Riverside County population projected at +22% by 2050 — long-run rental-demand tailwind backs the buy-and-hold thesis.
- At projected returns (-3.0% appreciation + 4.9% rent growth), your $8k cash investment doubles in ~1 year — after that, you're playing with house money.
Negotiation context
- It's been on market 138 days — a 12% lower offer ($26k) is reasonable based on typical stale-listing flexibility.
- 5 sale attempts since 16y ago; this cycle's ask has dropped $10k (25%) from the opening price — seller is motivated, your offer sets the floor, not the list.
- Current owner paid $11k; list at $30k implies a 172% gain — meaningful room to come down on a strong offer.
Risks & watch-outs
- Climate carrying-cost: severe wildfire risk; extreme-heat days projected 5→15/yr by 2055 (HVAC capex compounding) — expect insurance premiums to compound above CPI over the hold.
Questions for the listing agent
- It's been on market 138 days. Have you received any prior offers? Is the seller open to a 12% concession, seller financing, or rate buy-down credit?
- Built in 1969 — when were the roof, HVAC, electrical panel, plumbing, and water heater last replaced?
- Why hasn't it sold? Are there any deal-killer items the seller is aware of (foundation, flood, title, zoning, code violations)?
- Is there a deadline driving the sale (1031 exchange, divorce, estate, relocation)? That informs how much negotiation room exists.
- Schools are F-rated, which usually means shorter tenancies and higher turnover. Who's the typical renter profile here, and what's been the actual vacancy rate?
- Crime grade is F in this area — have there been break-ins, vandalism, or insurance claims at this property in the last 3 years? What carrier currently insures it and at what premium?
- The area grade is low — what's the realistic commute time and amenity access for the typical tenant pool here? Any planned neighborhood developments (good or bad) we should know about?
- What's the average days-on-market for RENTAL listings here right now (not sales)? A rising rental-DOM trend means longer vacancies and softer asking-rent achievability than the comps imply.
- What's the recent tenant-quality profile in this submarket — average credit score on applications, eviction rate, late-payment / NSF rate, and stable-employment percentage? A property-management company in the area should have these aggregated.
- How much new for-sale + rental construction is in the pipeline within 1–3 miles? Heavy new supply typically softens prices + rents 12–24 months out; constrained supply supports both.
Investment metrics
- 1% rule
- 5.94% ✓
- Cap rate
- 54.31%
- Cash-on-cash
- 171.48%
- DSCR
- 8.63
- GRM
- 1.4
CMA / ARV
- ARV (median comp)
- $65,505
- List price
- $29,900
- Delta
- -54.35%
- Verdict
- UNDERPRICED
- Comps
- 20 within 1.0 mi
Show comp detail 6 sales within ~0.75 mi
| Address | Dist | Beds/Ba | Sqft | Sold | Price | $/sf | Match |
|---|---|---|---|---|---|---|---|
| 42751 E Florida Ave #41 | 0.00mi | 2/2.0 | 1,040 (-4%) | 8mo | $41,600 | $40 | 87 |
| 42751 E Florida Ave #76 | 0.00mi | 2/2.0 | 1,152 (+7%) | 12mo | $75,000 | $65 | 79 |
| 42751 Florida #126 | 0.16mi | 2/2.0 | 1,210 (+12%) | 1mo | $64,000 | $53 | 72 |
| 42751 E Florida Ave #98 | 0.24mi | 2/2.0 | 1,152 (+7%) | 13mo | $72,000 | $63 | 67 |
| 42751 E Florida Ave #112 | 0.00mi | 2/1.5 | 960 (-11%) | 17mo | $85,900 | $89 | 66 |
| 42751 E Florida Ave #59 | 0.24mi | 2/2.5 | 1,200 (+11%) | 9mo | $33,000 | $28 | 61 |
Match score weights: distance 35% · size 25% · config 20% · recency 20%. Top-matched comps best support the ARV.
Projected returns pro-forma
-3.0% appreciation · 4.9% rent growth · sell at horizon
- IRR
- —
- Equity multiple
- 9.94×
- Total profit
- $74,837
- Equity at exit
- $4,458
- IRR
- —
- Equity multiple
- 22.28×
- Total profit
- $178,147
- Equity at exit
- $2,585
Cash invested: $8,372 (down + closing). Projections, not guarantees.
Landlord ↔ Tenant lean methodology
- Overall (STATE)
- 18 Strongly Tenant-Friendly
- State California
- 18 Strongly Tenant-Friendly · D+13
- County
- — inherits STATE
- City
- — inherits STATE
ZIP-level market 92544
- Rents YoY
- 4.9%
- Active inventory
- 323
- Price-to-rent
- 1.4×
Monthly cashflow live
- Estimated rent
- $1,776 high interval (Pro) →
- Mortgage (P&I)
- −$157
- Tax est. 1.5%
- −$37 /mo · $448/yr
- Insurance
- −$12
- HOA
- −$0
- Vacancy / Maint / Mgmt
- −$373
- Net cashflow
- $1,196
Break-even live
UW: 25.0% down · 7.5% · 30yr · 1.5% tax · 5.0% vac · 8.0% maint · 8.0% mgmt
Financing live
Cash to close
- Down payment
- $7,475
- Closing costs
- $897
- Reserves months
- —
- Total cash needed
- —
Loan-product check · same deal, 3 products live
Conventional
25% down · 7.5% · 30yr
- Down + closing
- —
- Monthly P&I
- —
- Monthly cashflow
- —
- DSCR
- —
- Eligible?
- —
Personal DTI + credit; lowest rate.
DSCR
20% down · 8.5% · 30yr
- Down + closing
- —
- Monthly P&I
- —
- Monthly cashflow
- —
- DSCR
- —
- Eligible?
- —
No personal income docs; deal must DSCR.
Hard money
10% down · 12.0% · 12mo
- Down + closing
- —
- Monthly P&I
- —
- Monthly cashflow
- —
- DSCR
- —
- Eligible?
- —
Short-term bridge; refi at stabilization.
Rent comps 21 comps
| Address | Beds | Baths | Sqft | Rent | $/sqft | DOM | Units | Dist |
|---|---|---|---|---|---|---|---|---|
| 43170 Wall St Hemet, CA | 2.0 | 2.0 | 1140 | $1,895 | $1.66 | 2d | 1 | 0.45mi |
| 25564 Sharp Dr Unit F Hemet, CA | 1.0 | 1.0 | 832 | $1,475 | $1.77 | 43d | 1 | 0.49mi |
| 26123 Anawood Pl Hemet, CA | 2.0 | 1.0 | 991 | $1,680 | $1.70 | 43d | 1 | 0.61mi |
| 43601 E Florida Ave #98 Hemet, CA | 2.0 | 2.0 | 840 | $1,400 | $1.67 | 24d | 1 | 0.67mi |
| 43601 E Florida Ave Hemet, CA | 2.0 | 2.0 | 960 | $1,550 | $1.61 | 43d | 1 | 0.67mi |
| 43601 E Florida Ave Unit 43 Hemet, CA | 2.0 | 2.0 | 960 | $1,500 | $1.56 | 43d | 1 | 0.67mi |
| 43601 E Florida Ave Unit 43 Hemet, CA | 2.0 | 2.0 | 960 | $1,450 | $1.51 | 23d | 1 | 0.67mi |
| 43601 E Florida Ave #98 Hemet, CA | 2.0 | 2.0 | 800 | $1,400 | $1.75 | 43d | 1 | 0.67mi |
| 26097 Doverwood Pl Hemet, CA | 2.0 | 1.0 | 1019 | $1,849 | $1.81 | 43d | 1 | 0.69mi |
| 26111 Doverwood Pl Hemet, CA | 2.0 | 1.0 | 1252 | $1,849 | $1.48 | 11d | 1 | 0.69mi |
| 43601 California 74 Unit 17 Hemet, CA | 2.0 | 2.0 | 840 | $1,400 | $1.67 | 23d | 1 | 0.71mi |
| 43611 Florida Ave Unit 10 Hemet, CA | 2.0 | 2.0 | 850 | $1,550 | $1.82 | 43d | 1 | 0.72mi |
| 43435 Nola St Hemet, CA | 3.0 | 2.0 | 1500 | $1,950 | $1.30 | 24d | 1 | 0.86mi |
| 41900 Acacia Ave Hemet, CA | 2.0 | 1.0 | 850 | $1,800 | $2.12 | 43d | 1 | 0.90mi |
| 43816 C St Hemet, CA | 2.0 | 2.0 | 1040 | $2,250 | $2.16 | 24d | 1 | 1.00mi |
| 41818 Acacia East Ave Hemet, CA | 2.0 | 1.0 | 1000 | $1,850 | $1.85 | 14d | 1 | 1.03mi |
| 41611 Marine Dr Hemet, CA | 2.0 | 1.0 | 1050 | $1,700 | $1.62 | 12d | 1 | 1.21mi |
| 41541 Marine Dr Hemet, CA | 2.0 | 1.0 | 1000 | $1,700 | $1.70 | 12d | 1 | 1.27mi |
| 44085 Palm Ave Hemet, CA | 2.0 | 2.0 | 800 | $1,850 | $2.31 | 3d | 1 | 1.28mi |
| 41517 Marine Dr Hemet, CA | 2.0 | 2.0 | 1196 | $1,850 | $1.55 | 24d | 1 | 1.30mi |
| 44099 D St Hemet, CA | 3.0 | 2.0 | 1040 | $2,195 | $2.11 | 17d | 1 | 1.31mi |
Listing history 29 events
-
2026-06-18days on market $29,900 Active 138 DOM
-
2026-06-17days on market $29,900 Active 137 DOM
-
2026-06-16days on market $29,900 Active 136 DOM
-
2026-06-15days on market $29,900 Active 135 DOM
-
2026-06-13days on market $29,900 Active 133 DOM
-
2026-06-09days on market $29,900 Active 129 DOM
-
2026-06-08days on market $29,900 Active 128 DOM
-
2026-06-07days on market $29,900 Active 127 DOM
-
2026-06-04days on market $29,900 Active 124 DOM
-
2026-06-03days on market $29,900 Active 123 DOM
-
2026-06-02days on market $29,900 Active 122 DOM
-
2026-06-01days on market $29,900 Active 121 DOM
-
2026-05-31days on market $29,900 Active 120 DOM
-
2026-04-14price $29,900 552-char remark
Show marketing remark (552 chars)
Affordable living with this 2 bedroom 2 bath in Arroyo Fairways 55yr+ senior mobile home park featuring on-site golf course, pool, spa, clubhouse and loads of other amenities. Living room/dining combo with built-in china hutch and ceiling fan. Step-saver kitchen with gas oven and cook top. Primary bedroom has walk-in closet, built-in vanity and en-suite bathroom. Inside laundry. Enclosed front porch. Security screen doors. Carport. Shed. Easy care yard. Major fixer-upper opportunity. In need of significant renovations. Owner will carry financing.
-
2026-03-18price $34,900 552-char remark
Show marketing remark (552 chars)
Affordable living with this 2 bedroom 2 bath in Arroyo Fairways 55yr+ senior mobile home park featuring on-site golf course, pool, spa, clubhouse and loads of other amenities. Living room/dining combo with built-in china hutch and ceiling fan. Step-saver kitchen with gas oven and cook top. Primary bedroom has walk-in closet, built-in vanity and en-suite bathroom. Inside laundry. Enclosed front porch. Security screen doors. Carport. Shed. Easy care yard. Major fixer-upper opportunity. In need of significant renovations. Owner will carry financing.
-
2026-01-31$39,900 Active 552-char remark
Show marketing remark (552 chars)
Affordable living with this 2 bedroom 2 bath in Arroyo Fairways 55yr+ senior mobile home park featuring on-site golf course, pool, spa, clubhouse and loads of other amenities. Living room/dining combo with built-in china hutch and ceiling fan. Step-saver kitchen with gas oven and cook top. Primary bedroom has walk-in closet, built-in vanity and en-suite bathroom. Inside laundry. Enclosed front porch. Security screen doors. Carport. Shed. Easy care yard. Major fixer-upper opportunity. In need of significant renovations. Owner will carry financing.
-
2026-01-14historical
-
2025-11-17$44,900 Active
-
2012-08-24soldstatus $11,000 Closed
-
2012-08-03status Pending
-
2012-04-26price $14,900
-
2012-01-31$20,900 Active
-
2011-01-20historical
-
2011-01-07price $5,500
-
2010-12-24status Active
-
2010-12-14status Pending
-
2010-11-16price $6,900
-
2010-09-24price $10,900
-
2010-08-21$12,000 Active
ⓘ Source: listings_history table (triggers on properties + properties_extension) + one-shot
backfill from property_details.listing_events for pre-trigger history.
Climate risk First Street
- Flood 1/10 Low FEMA zone X (unshaded) · 0% chance over 30 yrs
- Wildfire 8/10 Severe
- Heat 7/10 Severe 5 d/yr ≥103°F today · 15 d/yr by 30 yrs out
- Wind 1/10 Low
- Air quality 6/10 Major 10 unhealthy d/yr today · 12 by 30 yrs out
Nearby sold comps map
Loading sold comps map…
Walkable amenities ~0.75 mi
Loading nearby amenities…
Taxation est. · year 1
- Rental income
- $21,311
- − Mortgage interest
- −$1,675
- − Property taxes
- −$448
- − Insurance
- −$150
- − Repairs & maintenance
- −$1,705
- − Management
- −$1,705
- − Depreciation
- −$870
- Taxable income
- $14,759
- Est. tax owed @ 24.0%
- −$3,542
- After-tax cash flow
- $10,814/yr
For passive investors: Depreciation is non-cash, so a rental often shows a tax loss while cash-flowing — sheltering income. Rental losses are passive: they offset passive income freely, and up to $25,000/yr can offset ordinary (W-2) income if you actively participate and your MAGI is under $100k (phasing out to $0 by $150k); unused losses carry forward. On sale, claimed depreciation is recaptured at up to 25%, and gains may owe capital-gains tax (a 1031 exchange can defer both). Figures are a year-1 estimate at your 24.0% rate — not tax advice; consult a CPA.
Schools (NCES district)
- District
- Hemet Unified
- NCES district ID
- 0616920
- Math proficiency
- 19% ▼ -3.00%
- Reading proficiency
- 41% ▲ 4.00%
- Median HH income
- $39,962
- Composite
- 25.16/100
- National rank
- #7517
- State rank
- #360 of 517 in CA
Livability — Valle Vista
- Score
- 57/100
- State rank
- #739
- US rank
- #21678
Category grades
Schools grade is shown separately in the Schools card above.
Census & demographics
- Census place
- Valle Vista, CA
- County
- Riverside County · 2,287,001 people
- Metro
- Riverside-San Bernardino-Ontario, CA
- Population (ZIP)
- 51,751
- Household income
- $73,596
- Rent vs Own
- Severe rent burden
- 1518.0
Population outlook (Riverside County) Hauer SSP2
- Today (2025)
- 2,664,475 people
- By 2030
- 2,802,692 · +5.2%
- By 2040
- 3,050,904 · +14.5%
- By 2050
- 3,256,783 · +22.2%
- By 2075
- 3,655,058 · +37.2%
- By 2100
- 3,766,594 · +41.4%
Race, ethnicity, and origin ACS 2023
- Neighborhood character
- Diverse neighborhood (Simpson 0.59)
- Race & ethnicity
- Hispanic / Latino 49% White 40% Two or more races 18% Black 5% Asian 3% Native American 2%
- Hispanic origin (detail)
- Mexican 43% Puerto Rican 1%
- Common ancestry
- Slovak 2% Italian 2% Portuguese 2%
- Foreign-born
- 15% · Canada, China
- Languages at home
- 70% English-only · Spanish 27% Other Asian/Pacific 1% Other Indo-European 1%
Political lean MEDSL · Riverside
- 2024 margin
- Toss-up / Even · D 48.0% · R 49.3% · Other 2.6%
- 2008→2024 swing
- -3.6pp toward R · 2008: 2.3pp · 2024: -1.3pp
- All cycles
- 2024: R+1.3 2020: D+8.0 2016: D+4.3 2012: R+0.4 2008: D+2.3
Not yet ingested
- Civics
- —
Market trends
- HPI YoY
- ▼ -219.06%
- Current HPI
- 391.972
- Rent YoY
- ▲ 4.90%
- Metro
- Riverside-San Bernardino-Ontario, CA
- State GDP YoY
- ▲ 3.21%
- F500 in state
- 116
Industry mix (Fortune 500 HQ in CA)
| Industry | F500 HQs | Revenue |
|---|---|---|
| Technology | 27 | $1,492B |
|
||
| Financial Services | 3 | $174B |
|
||
| Retail | 3 | $44B |
|
||
| Insurance | 3 | $26B |
|
||
| Media / Entertainment | 2 | $115B |
|
||
| Pharmaceuticals / Biotech | 2 | $62B |
|
||
Price history
+149.2% since first listed16 events — show timeline
- 2026-04-14 Price Changed $29,900 CRMLS
- 2026-03-18 Price Changed $34,900 CRMLS
- 2026-01-31 Listed $39,900 CRMLS
- 2026-01-14 Listing Removed — CRMLS
- 2025-11-17 Listed $44,900 CRMLS
- 2012-08-24 Sold (MLS) $11,000 CRMLS
- 2012-08-03 Pending — CRMLS
- 2012-04-26 Price Changed $14,900 CRMLS
- 2012-01-31 Listed $20,900 CRMLS
- 2011-01-20 Listing Removed — CRMLS
- 2011-01-07 Price Changed $5,500 CRMLS
- 2010-12-24 Relisted — CRMLS
- 2010-12-14 Pending — CRMLS
- 2010-11-16 Price Changed $6,900 CRMLS
- 2010-09-24 Price Changed $10,900 CRMLS
- 2010-08-21 Listed $12,000 CRMLS
Cash-flow waterfall
monthlySold comps — $/sqft
last 12 mo · ≤1 miLoading sold comps…