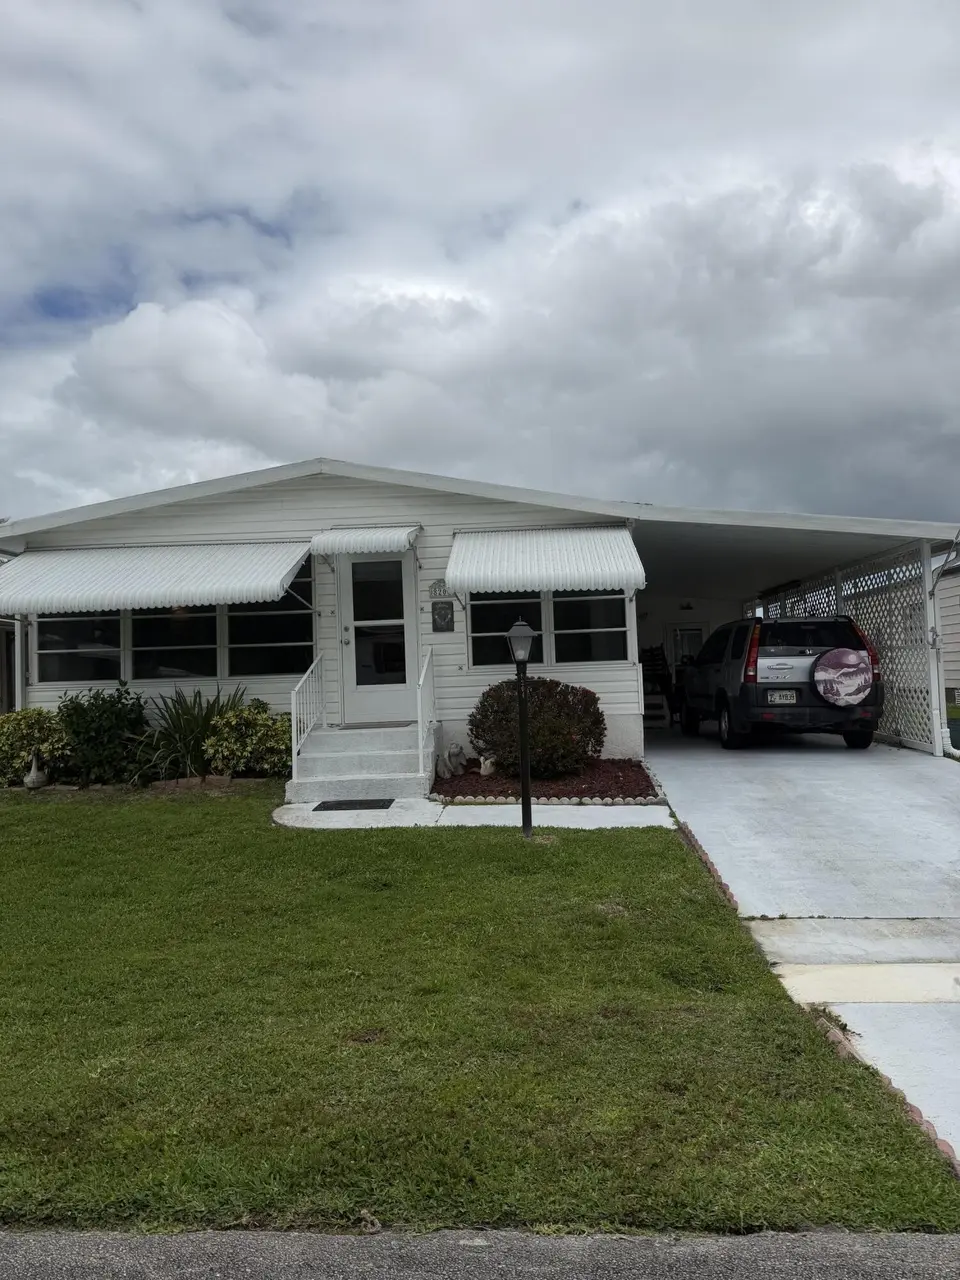
8204 W Bitterbush Ln · Port St. Lucie, FL
Flood risk 1/10 · Minimal
- FEMA flood zone
- X (unshaded)
- Chance of flooding over 30 yrs
- 0.0%
- Est. flood insurance / yr
- $507 – $1,088
Fire risk 3/10 · Minor
- Est. fire insurance / yr
- $947 – $1,759
Heat risk 10/10 · Severe
- Hot days now (above 106°F)
- 7 days/yr
- Hot days in 30 yrs
- 25 days/yr
Wind risk 10/10 · Severe
- Chance of severe wind over 30 yrs
- 99.0%
Air-quality risk 2/10 · Minimal
- Unhealthy air days now
- 1 days/yr
- Unhealthy air days in 30 yrs
- 1 days/yr
Risk factors via First Street. Map © Google.
Why this score? — see what drove the D grade
The composite is a weighted blend of 9 inputs, each scored 0–100. Each bar is that input's sub-score; the figure is the points it added to the 100-point composite (weight × sub-score).
- Cash flow +19.0/30.0
- 1% rule +7.2/10.0
- DSCR +6.0/10.0
- Schools +3.7/10.0
- Rent growth +3.0/5.0
- Livability +2.5/5.0
- Condition / age +2.5/5.0
- ARV discount +0.0/15.0
- Appreciation +0.0/10.0
$155,900
🖨 Deal sheet 📄 Offer letter ✓ Due diligence
Listing remarks
LAND OWNED! Spectacular turn key home in desirable Savanna Club awaits you! 2 Bedroom 2 Bath home offers generous storage, a huge golf cart shed, and large welcoming carport area for relaxing and entertaining. Light, bright, and cheery this home offers ample sunlight and an open floor plan that is perfect for family gatherings. A large lanai has full windows with new shades for privacy and sun protection, small A/C unit on lanai. Washer Dryer is included along with new kitchen appliances. Home has sprinkler system. new floors and 3/4" subflooring, recent vapor Barrier inspection, and updated bathrooms that are guest worthy. A jewel of a home in quiet setting minutes from shopping and 3
Key facts
- New floors
- Large lanai
- Large carport area
Tags
Property features AI
Finance
- Other: Located in a senior community; Pets allowed with restrictions and limits
- Financial info: Not a land lease property
- HOA & community: Has association with monthly fee (includes cable TV, internet, common areas, recreation facilities); Association amenities include pool, heated pool, spa/hot tub, clubhouse, fitness center, tennis courts, pickleball, shuffleboard, basketball court, bocce ball, billiard/game rooms, cafe/restaurant, library, community room, kitchen facilities, internet included
Exterior
- Parking: 2 total parking spaces; Attached carport (1 covered space); Driveway and open parking
- Utilities: Public water; Private sewer; Three-phase electric; Cable connected; Phone available; Water connected
- Home design: Manufactured home; One story; Resale condition; Faces west
- Construction: Modular construction; Shingle/composition roof; Built as a manufactured home
- Exterior features: Interior lot; Not waterfront; Composition/shingle roof
Interior
- Kitchen: Dishwasher; Electric range; Microwave; Refrigerator; Electric water heater
- Bedrooms: 2 bedrooms on the main level
- Flooring: Ceramic tile; Laminate; Vinyl
- Bathrooms: 2 full bathrooms on the main level
- Heating & cooling: Central electric heating; Central electric cooling; Ceiling fans
- Interior features: Built-in features; Stacked bedroom layout
- Laundry & utility: Laundry located outside
Neighborhood map
What this means for you Summary
Snapshot
- This is a 2-bed/2.0-bath manufactured listed at $156k.
Deal economics
- At list price, monthly cash flow is $163 ($2k/yr) — positive.
- The deal already cash-flows at list — no discount required.
- Meets the 1% rule at list price ($2k rent vs $156k).
- Recommended offer: $151k (3.0% below list) — sets the bar for market timing.
- Cap rate 7.5% vs local median 3.9% in Port St. Lucie — top-decile yield for the area; either an underpriced asset or a hidden risk that comps aren't pricing in. Stress-test before assuming the spread holds.
Location & tenants
- Location reads: area grade D — affects rentability + tenant quality, not the cash-flow math above.
- St. Lucie (urban): math 40% / reading 48% proficiency, ranked #51 of 73 in FL (top 70%) — families likely to look elsewhere, expect single-tenant / working-renter base with shorter leases.
- Market conditions: Rents rising (+1.9%/yr); 639 active listings in the ZIP; 20 comparable units currently listed for rent nearby; rentals leasing fast (median 14d on market — plan ~1-2 weeks tenant-placement turnaround); 4,868 units permitted in St. Lucie County in 2024 (268 in 5+ unit buildings).
- This rent runs 37% of the median local income ($62k/yr) — at the standard rent-burdened threshold; future hikes will face affordability resistance.
Forward outlook
- Local home prices are declining (-3.0%/yr); year-one equity from $1k of loan paydown is wiped out by about $5k of value loss. Plan a longer hold.
- St. Lucie County population projected at +20% by 2050 — long-run rental-demand tailwind backs the buy-and-hold thesis.
Negotiation context
- It's been on market 33 days — a 3% lower offer ($151k) is reasonable based on typical stale-listing flexibility.
- 7 sale attempts since 18y ago with the ask held roughly flat each time — persistent listings suggest the price (not the market) is what's stuck; bring a comps-based counter.
- Current owner paid $112k; 39% above their basis — modest negotiation headroom, anchor on the comps not their cost.
Risks & watch-outs
- Climate carrying-cost: severe wind risk, 99% chance of damaging wind over 30y; extreme-heat days projected 7→25/yr by 2055 (HVAC capex compounding) — expect insurance premiums to compound above CPI over the hold.
Questions for the listing agent
- It's been on market 33 days. Have you received any prior offers? Is the seller open to a 3% concession, seller financing, or rate buy-down credit?
- What does the HOA fee cover, when was the last increase, and are there any pending special assessments or reserve-fund shortfalls?
- Is there a deadline driving the sale (1031 exchange, divorce, estate, relocation)? That informs how much negotiation room exists.
- The area grade is low — what's the realistic commute time and amenity access for the typical tenant pool here? Any planned neighborhood developments (good or bad) we should know about?
- What's the average days-on-market for RENTAL listings here right now (not sales)? A rising rental-DOM trend means longer vacancies and softer asking-rent achievability than the comps imply.
- What's the recent tenant-quality profile in this submarket — average credit score on applications, eviction rate, late-payment / NSF rate, and stable-employment percentage? A property-management company in the area should have these aggregated.
- How much new for-sale + rental construction is in the pipeline within 1–3 miles? Heavy new supply typically softens prices + rents 12–24 months out; constrained supply supports both.
Investment metrics
- 1% rule
- 1.22% ✓
- Cap rate
- 7.55%
- Cash-on-cash
- 4.47%
- DSCR
- 1.20
- GRM
- 6.8
CMA / ARV
- ARV (on-the-fly)
- $124,488
- Comps found
- 8
Show comp detail 8 sales within ~0.75 mi
| Address | Dist | Beds/Ba | Sqft | Sold | Price | $/sf | Match |
|---|---|---|---|---|---|---|---|
| 2975 Fiddlewood Cir | 0.29mi | 2/2.0 | 936 (0%) | 5mo | $207,500 | $222 | 82 |
| 4 Angelita | 0.38mi | 2/2.0 | 950 (+2%) | 15mo | $38,000 | $40 | 68 |
| 3 W Caribbean | 0.48mi | 2/2.0 | 950 (+2%) | 21mo | $15,000 | $16 | 57 |
| 2999 Saltbush Ct | 0.38mi | 2/2.0 | 1,040 (+11%) | 8mo | $176,000 | $169 | 57 |
| 8506 Redbay Ct | 0.53mi | 2/2.0 | 1,036 (+11%) | 6mo | $193,000 | $186 | 52 |
| 66 Spanish Way | 0.64mi | 2/2.0 | 984 (+5%) | 14mo | $28,900 | $29 | 50 |
| 46 Spanish Way | 0.68mi | 2/2.0 | 984 (+5%) | 13mo | $15,000 | $15 | 49 |
| 8513 Redbay Ct | 0.50mi | 2/2.0 | 1,040 (+11%) | 21mo | $138,000 | $133 | 40 |
Match score weights: distance 35% · size 25% · config 20% · recency 20%. Top-matched comps best support the ARV.
Projected returns pro-forma
-3.0% appreciation · 1.92% rent growth · sell at horizon
- IRR
- -10.7%
- Equity multiple
- 0.62×
- Total profit
- $-16,755
- Equity at exit
- $23,245
- IRR
- -3.1%
- Equity multiple
- 0.80×
- Total profit
- $-8,690
- Equity at exit
- $13,479
Cash invested: $43,652 (down + closing). Projections, not guarantees.
Landlord ↔ Tenant lean methodology
- Overall (STATE)
- 87 Strongly Landlord-Friendly
- State Florida
- 87 Strongly Landlord-Friendly · R+3
- County
- — inherits STATE
- City
- — inherits STATE
ZIP-level market 34952
- Home prices YoY
- -29.6%
- Rents YoY
- 1.9%
- Active inventory
- 639
- Price-to-rent
- 6.8×
Monthly cashflow live
- Estimated rent
- $1,905 high interval (Pro) →
- Mortgage (P&I)
- −$818
- Tax from tax record
- −$122 /mo · $1,460/yr
- Insurance
- −$65
- HOA
- −$338
- Vacancy / Maint / Mgmt
- −$400
- Net cashflow
- $163
Break-even live
UW: 25.0% down · 7.5% · 30yr · 1.5% tax · 5.0% vac · 8.0% maint · 8.0% mgmt
Financing live
Cash to close
- Down payment
- $38,975
- Closing costs
- $4,677
- Reserves months
- —
- Total cash needed
- —
Loan-product check · same deal, 3 products live
Conventional
25% down · 7.5% · 30yr
- Down + closing
- —
- Monthly P&I
- —
- Monthly cashflow
- —
- DSCR
- —
- Eligible?
- —
Personal DTI + credit; lowest rate.
DSCR
20% down · 8.5% · 30yr
- Down + closing
- —
- Monthly P&I
- —
- Monthly cashflow
- —
- DSCR
- —
- Eligible?
- —
No personal income docs; deal must DSCR.
Hard money
10% down · 12.0% · 12mo
- Down + closing
- —
- Monthly P&I
- —
- Monthly cashflow
- —
- DSCR
- —
- Eligible?
- —
Short-term bridge; refi at stabilization.
Rent comps 20 comps
| Address | Beds | Baths | Sqft | Rent | $/sqft | DOM | Units | Dist |
|---|---|---|---|---|---|---|---|---|
| 1900 Bella Vista Way Port Saint Lucie, FL | 1.0–2.0 | 1.0–2.0 | 995 | $1,764 | $1.77 | 13d | 15 | 0.29mi |
| 1810 SE Pinewood Trl Port Saint Lucie, FL | 1.0–2.0 | 1.0–2.0 | 1013 | $2,055 | $2.03 | 13d | 7 | 0.68mi |
| 1811 SE Walton Lakes Dr Port Saint Lucie, FL | 2.0 | 1.0–2.0 | 1117 | $1,926 | $1.72 | 13d | 6 | 0.79mi |
| 3784 Sapodilla Ct Port Saint Lucie, FL | 2.0 | 2.0 | 1121 | $2,300 | $2.05 | 23d | 1 | 0.86mi |
| 1131 SE Parrish Ct Port Saint Lucie, FL | 2.0 | 1.0 | 902 | $2,000 | $2.22 | 23d | 1 | 1.03mi |
| 1455 SE Colchester Cir Port Saint Lucie, FL | 2.0 | 2.0 | 921 | $1,795 | $1.95 | 13d | 1 | 1.07mi |
| 1516 SE Royal Green Cir #202 Port St Lucie, FL | 3.0 | 2.0 | 921 | $2,100 | $2.28 | 23d | 1 | 1.21mi |
| 1503 SE Royal Green Cir Unit V104 Port St. Lucie, FL | 2.0 | 2.0 | 865 | $1,750 | $2.02 | 23d | 1 | 1.22mi |
| 1520 SE Royal Green Cir Unit K-203 Port St. Lucie, FL | 2.0 | 2.0 | 886 | $1,800 | $2.03 | 23d | 1 | 1.23mi |
| 1524 SE Royal Green Cir Unit Q102 Port St. Lucie, FL | 2.0 | 2.0 | 865 | $1,800 | $2.08 | 13d | 1 | 1.26mi |
| 1550 SE Royal Green Cir Port St. Lucie, FL | 2.0 | 2.0 | 782 | $1,850 | $2.37 | 13d | 1 | 1.27mi |
| 1565 SE Royal Green Cir #108 Port St Lucie, FL | 1.0 | 1.0 | 705 | $1,595 | $2.26 | 13d | 1 | 1.27mi |
| 1562 SE Royal Green Cir Unit T-204 Port St. Lucie, FL | 2.0 | 2.0 | 782 | $1,900 | $2.43 | 23d | 1 | 1.28mi |
| 1566 SE Royal Green Cir #203 Port St Lucie, FL | 2.0 | 2.0 | 782 | $2,000 | $2.56 | 13d | 1 | 1.34mi |
| 1537 SE Royal Green Cir Unit E204 Port St. Lucie, FL | 2.0 | 2.0 | 886 | $1,750 | $1.98 | 13d | 1 | 1.37mi |
| 1536 SE Royal Green Cir #101 Port St Lucie, FL | 2.0 | 2.0 | 782 | $1,750 | $2.24 | 23d | 1 | 1.41mi |
| 1550 SE Royal Green Cir Unit P-203 Port St. Lucie, FL | 2.0 | 2.0 | 782 | $1,750 | $2.24 | 23d | 1 | 1.43mi |
| 1500 SE Tiffany Club Pl Port Saint Lucie, FL | 1.0–3.0 | 1.0–2.0 | 895 | $1,922 | $2.15 | 13d | 7 | 1.43mi |
| 1548 SE Royal Green Cir Unit M-103 Port St. Lucie, FL | 2.0 | 2.0 | 886 | $1,800 | $2.03 | 23d | 1 | 1.45mi |
| 1548 SE Royal Green Cir #108 Port St Lucie, FL | 1.0 | 1.0 | 705 | $1,650 | $2.34 | 13d | 1 | 1.46mi |
HOA detail
- Monthly dues
- $338 · $4,056/yr
Listing history 24 events
-
2026-05-20status Pending
-
2026-05-08historical Active Under Contract
-
2026-04-18status Active
-
2026-04-18historical Active Under Contract
-
2026-04-17$155,900 Active
-
2026-04-10historical
-
2026-03-20price $157,000
-
2026-02-05price $169,900
-
2025-09-23$179,900 Active
-
2025-09-19historical
-
2025-03-18$220,000 Active
-
2021-02-12soldstatus $112,000 Closed
-
2021-02-12soldstatus $112,000
-
2021-02-02historical Contingent
-
2020-11-25$119,900 Active
-
2011-04-19soldstatus $69,000
-
2011-04-07soldstatus $69,000
-
2011-03-26historical
-
2010-10-28$69,000
-
2010-05-03soldstatus $56,000
-
2010-04-28soldstatus $56,000
-
2010-04-01historical
-
2008-06-01$69,000
-
1992-02-22soldstatus $52,000
ⓘ Source: listings_history table (triggers on properties + properties_extension) + one-shot
backfill from property_details.listing_events for pre-trigger history.
Tax reassessment forecast FL · Resets to sale price
- Current annual tax
- $1,460 · $122/mo
- Projected year-2 tax
- $1,460 · $122/mo
- Expected delta
- $0/yr ($0/mo · 0.0%)
ⓘ Screening estimate from a state-policy table — verify with the county assessor before closing.
Climate risk First Street
- Flood 1/10 Low FEMA zone X (unshaded) · 0% chance over 30 yrs
- Wildfire 3/10 Moderate
- Heat 10/10 Extreme 7 d/yr ≥106°F today · 25 d/yr by 30 yrs out
- Wind 10/10 Extreme 99% chance of damaging wind over 30 yrs
- Air quality 2/10 Low 1 unhealthy d/yr today · 1 by 30 yrs out
Nearby sold comps map
Loading sold comps map…
Walkable amenities ~0.75 mi
Loading nearby amenities…
Taxation est. · year 1
- Rental income
- $22,859
- − Mortgage interest
- −$8,733
- − Property taxes
- −$1,460
- − Insurance
- −$780
- − Repairs & maintenance
- −$1,829
- − Management
- −$1,829
- − HOA
- −$4,056
- − Depreciation
- −$4,535
- Taxable loss
- −$362
- Est. tax savings @ 24.0%
- +$87
- After-tax cash flow
- $2,040/yr
For passive investors: Depreciation is non-cash, so a rental often shows a tax loss while cash-flowing — sheltering income. Rental losses are passive: they offset passive income freely, and up to $25,000/yr can offset ordinary (W-2) income if you actively participate and your MAGI is under $100k (phasing out to $0 by $150k); unused losses carry forward. On sale, claimed depreciation is recaptured at up to 25%, and gains may owe capital-gains tax (a 1031 exchange can defer both). Figures are a year-1 estimate at your 24.0% rate — not tax advice; consult a CPA.
Schools (NCES district)
- District
- St. Lucie
- NCES district ID
- 1201770
- Math proficiency
- 40% ▼ -11.00%
- Reading proficiency
- 48% ▼ -4.00%
- Median HH income
- $44,737
- Composite
- 37.28/100
- National rank
- #4449
- State rank
- #51 of 73 in FL
Livability — Port St. Lucie
No livability data for this city. (Only ~50 U.S. cities are tracked.)
Census & demographics
- County
- Saint Lucie County · 337,150 people
- City population
- 221,051
- Metro
- Port St. Lucie, FL
- Population (ZIP)
- 42,655
- Household income
- $61,628
- Rent vs Own
- Severe rent burden
- 1759.0
Population outlook (St. Lucie County) Hauer SSP2
- Today (2025)
- 338,016 people
- By 2030
- 355,687 · +5.2%
- By 2040
- 385,521 · +14.1%
- By 2050
- 406,106 · +20.1%
- By 2075
- 441,054 · +30.5%
- By 2100
- 436,885 · +29.2%
Race, ethnicity, and origin ACS 2023
- Neighborhood character
- Diverse neighborhood (Simpson 0.57)
- Race & ethnicity
- White 62% Hispanic / Latino 19% Two or more races 14% Black 10% Asian 3%
- Hispanic origin (detail)
- Mexican 4% Puerto Rican 4% Cuban 2% Dominican 2%
- Common ancestry
- Romanian 3% Lithuanian 2% Hispanic 1%
- Foreign-born
- 18% · Canada, Jamaica, China
- Languages at home
- 76% English-only · Spanish 16% French/Haitian/Cajun 3% Tagalog/Filipino 2%
Political lean MEDSL · St. Lucie
- 2024 margin
- Lean R (+9.1) · D 45.1% · R 54.2%
- 2008→2024 swing
- -21.2pp toward R · 2008: 12.1pp · 2024: -9.1pp
- All cycles
- 2024: R+9.1 2020: R+1.6 2016: R+2.5 2012: D+7.9 2008: D+12.1
Not yet ingested
- Civics
- —
Market trends
- HPI YoY
- ▼ -155.80%
- Current HPI
- 371.0573
- Rent YoY
- ▲ 1.92%
- Metro
- Port St. Lucie, FL
- State GDP YoY
- ▲ 3.28%
- F500 in state
- 36
Industry mix (Fortune 500 HQ in FL)
| Industry | F500 HQs | Revenue |
|---|---|---|
| Industrial Technology | 2 | $29B |
|
||
| Insurance | 2 | $17B |
|
||
| Retail | 1 | $60B |
|
||
| Technology Distribution | 1 | $58B |
|
||
| Homebuilding | 1 | $35B |
|
||
| Technology Manufacturing | 1 | $35B |
|
||
Price history
+199.8% since first listed24 events — show timeline
- 2026-05-20 Pending — Beaches MLS
- 2026-05-08 Contingent — Beaches MLS
- 2026-04-18 Relisted — Beaches MLS
- 2026-04-18 Contingent — Beaches MLS
- 2026-04-17 Listed $155,900 Beaches MLS
- 2026-04-10 Listing Removed — Beaches MLS
- 2026-03-20 Price Changed $157,000 Beaches MLS
- 2026-02-05 Price Changed $169,900 Beaches MLS
- 2025-09-23 Listed $179,900 Beaches MLS
- 2025-09-19 Listing Removed — Beaches MLS
- 2025-03-18 Listed $220,000 Beaches MLS
- 2021-02-12 Sold (Public Records) $112,000 Public Records
- 2021-02-12 Sold (MLS) $112,000 Beaches MLS
- 2021-02-02 Contingent — Beaches MLS
- 2020-11-25 Listed $119,900 Beaches MLS
- 2011-04-19 Sold (Public Records) $69,000 Public Records
- 2011-04-07 Sold (MLS) $69,000 Beaches MLS
- 2011-03-26 Listing Removed — Beaches MLS
- 2010-10-28 Listed $69,000 Beaches MLS
- 2010-05-03 Sold (Public Records) $56,000 Public Records
- 2010-04-28 Sold (MLS) $56,000 Beaches MLS
- 2010-04-01 Listing Removed — Beaches MLS
- 2008-06-01 Listed $69,000 Beaches MLS
- 1992-02-22 Sold (Public Records) $52,000 Public Records
Property tax history
+24.0%/yrLatest (2025): $1,460 · +4.7% YoY. Source: county tax records.
Cash-flow waterfall
monthlySold comps — $/sqft
last 12 mo · ≤1 miLoading sold comps…