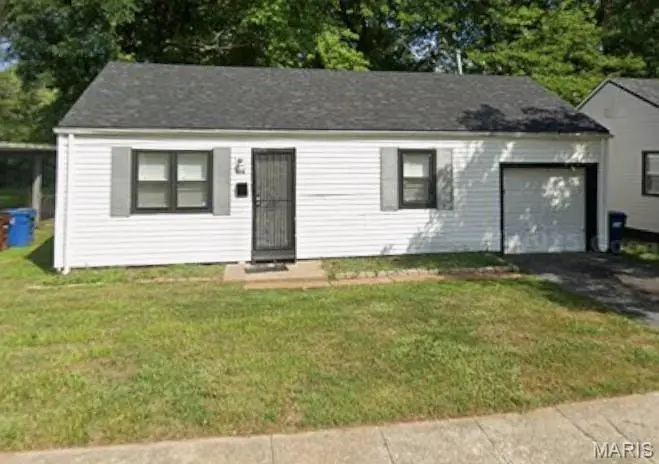
470 Mueller Ave · Ferguson, MO
Flood risk 5/10 · Moderate
- FEMA flood zone
- X (unshaded)
- Chance of flooding over 30 yrs
- 0.65%
- Est. flood insurance / yr
- $507 – $1,088
Fire risk 1/10 · Minimal
- Est. fire insurance / yr
- $1,054 – $1,958
Heat risk 4/10 · Minor
- Hot days now (above 106°F)
- 7 days/yr
- Hot days in 30 yrs
- 21 days/yr
Wind risk 2/10 · Minimal
- Chance of severe wind over 30 yrs
- 1.0%
Air-quality risk 4/10 · Minor
- Unhealthy air days now
- 4 days/yr
- Unhealthy air days in 30 yrs
- 5 days/yr
Risk factors via First Street. Map © Google.
Why this score? — see what drove the C+ grade
The composite is a weighted blend of 9 inputs, each scored 0–100. Each bar is that input's sub-score; the figure is the points it added to the 100-point composite (weight × sub-score).
- Cash flow +30.0/30.0
- 1% rule +10.0/10.0
- DSCR +10.0/10.0
- Rent growth +4.8/5.0
- Livability +2.9/5.0
- Condition / age +2.5/5.0
- Schools +1.2/10.0
- ARV discount +0.0/15.0
- Appreciation +0.0/10.0
$65,000
🖨 Deal sheet 📄 Offer letter ✓ Due diligence
Listing remarks MLS
Charming and cozy 2-bedroom, 1-bath home with attached 1-car garage. This inviting residence features a bright, sun-filled living area, functional kitchen with dedicated dining space, and comfortable bedrooms with ample storage. Thoughtful updates enhance modern comfort while preserving classic charm. The attached garage provides convenient access and additional storage, while the compact yard ensures low-maintenance upkeep. Ideally located in a friendly neighborhood near everyday amenities, this well-maintained property presents an investment opportunity with steady cash flow potential.
Key facts
- 6,499 sq ft lot
- Garage
- Built 1949
Neighborhood map
What this means for you Summary
Snapshot
- This is a 2-bed/1.0-bath single-family listed at $65k.
Deal economics
- At list price, monthly cash flow is $374 ($4k/yr) — positive.
- The deal already cash-flows at list — no discount required.
- Meets the 1% rule at list price ($1k rent vs $65k).
- Recommended offer: $59k (9.0% below list) — sets the bar for market timing.
- Cap rate 13.2% vs local median 9.2% in Ferguson — top-decile yield for the area; either an underpriced asset or a hidden risk that comps aren't pricing in. Stress-test before assuming the spread holds.
Location & tenants
- Location reads 58/100 on livability (#586 in MO) — a working-class tenant base; expect higher turnover. Strengths: cost of living A+, housing B+; Watch: health & safety C-, schools F, crime F.
- Ferguson-Florissant R-II (suburban): math 7% / reading 20% proficiency, ranked #311 of 324 in MO (top 96%) — low school quality limits family demand, transient renter base, plan for 1-2y turnover; 70% free/reduced lunch — lower-income household profile, screen leases tightly.
- Market conditions: Rents rising fast (+9.0%/yr); 162 active listings in the ZIP; 10 comparable units currently listed for rent nearby; rentals at typical pace (median 24d on market — plan ~3-4 weeks tenant-placement turnaround); 40% of comp listings sitting > 30 days — soft ceiling on asking rent; 920 units permitted in St. Louis County in 2024 (250 in 5+ unit buildings).
Forward outlook
- Local home prices are declining (-3.0%/yr); year-one equity from $449 of loan paydown is wiped out by about $2k of value loss. Plan a longer hold.
- At projected returns (-3.0% appreciation + 8.0% rent growth), your $18k cash investment doubles in ~5 years — after that, you're playing with house money.
Negotiation context
- It's been on market 119 days — a 9% lower offer ($59k) is reasonable based on typical stale-listing flexibility.
- 2 sale attempts since 6y ago; this cycle's ask has dropped $5k (7%) from the opening price — seller is motivated, your offer sets the floor, not the list.
Risks & watch-outs
- Watch-outs: built in 1949 — expect roof / HVAC / electrical / plumbing capex.
- Climate carrying-cost: moderate flood risk — expect insurance premiums to compound above CPI over the hold.
Questions for the listing agent
- It's been on market 119 days. Have you received any prior offers? Is the seller open to a 9% concession, seller financing, or rate buy-down credit?
- Built in 1949 — when were the roof, HVAC, electrical panel, plumbing, and water heater last replaced?
- Why hasn't it sold? Are there any deal-killer items the seller is aware of (foundation, flood, title, zoning, code violations)?
- Is there a deadline driving the sale (1031 exchange, divorce, estate, relocation)? That informs how much negotiation room exists.
- Schools are F-rated, which usually means shorter tenancies and higher turnover. Who's the typical renter profile here, and what's been the actual vacancy rate?
- Crime grade is F in this area — have there been break-ins, vandalism, or insurance claims at this property in the last 3 years? What carrier currently insures it and at what premium?
- What's the average days-on-market for RENTAL listings here right now (not sales)? A rising rental-DOM trend means longer vacancies and softer asking-rent achievability than the comps imply.
- What's the recent tenant-quality profile in this submarket — average credit score on applications, eviction rate, late-payment / NSF rate, and stable-employment percentage? A property-management company in the area should have these aggregated.
- How much new for-sale + rental construction is in the pipeline within 1–3 miles? Heavy new supply typically softens prices + rents 12–24 months out; constrained supply supports both.
Investment metrics
- 1% rule
- 1.56% ✓
- Cap rate
- 13.19%
- Cash-on-cash
- 24.65%
- DSCR
- 2.10
- GRM
- 5.3
CMA / ARV
- ARV (median comp)
- $55,651
- List price
- $65,000
- Delta
- 16.80%
- Verdict
- OVERPRICED
- Comps
- 20 within 1.0 mi
Show comp detail 12 sales within ~0.75 mi
| Address | Dist | Beds/Ba | Sqft | Sold | Price | $/sf | Match |
|---|---|---|---|---|---|---|---|
| 462 S Dade Ave | 0.12mi | 2/1.0 | 720 (+3%) | 5mo | $60,750 | $84 | 84 |
| 302 Plaza Ave | 0.33mi | 2/1.0 | 704 (+1%) | 11mo | $85,000 | $121 | 74 |
| 811 Marvin Ave | 0.38mi | 2/1.0 | 720 (+3%) | 7mo | $99,999 | $139 | 71 |
| 346 Mueller Ave | 0.22mi | 1/1.0 (-1) | 700 (+1%) | 19mo | $39,900 | $57 | 68 |
| 313 S Dade Ave | 0.31mi | 2/1.0 | 768 (+10%) | 5mo | $67,500 | $88 | 64 |
| 808 Arline Ave | 0.51mi | 3/2.0 (+1) | 720 (+3%) | 0mo | $125,000 | $174 | 61 |
| 901 Arline Ave | 0.48mi | 1/1.0 (-1) | 744 (+7%) | 8mo | $50,000 | $67 | 55 |
| 405 Estelle Ave | 0.60mi | 2/1.0 | 775 (+11%) | 1mo | $79,900 | $103 | 53 |
| 350 S Harvey Ave | 0.37mi | 2/1.0 | 608 (-13%) | 14mo | $40,000 | $66 | 50 |
| 129 Wiegel Dr | 0.74mi | 2/1.0 | 672 (-3%) | 20mo | $83,000 | $124 | 43 |
| 137 Wiegel Dr | 0.72mi | 2/1.0 | 768 (+10%) | 11mo | $34,900 | $45 | 40 |
| 230 Georgia Ave | 0.60mi | 3/1.0 (+1) | 800 (+15%) | 15mo | $85,000 | $106 | 29 |
Match score weights: distance 35% · size 25% · config 20% · recency 20%. Top-matched comps best support the ARV.
Projected returns pro-forma
-3.0% appreciation · 8.0% rent growth · sell at horizon
- IRR
- 23.4%
- Equity multiple
- 2.02×
- Total profit
- $18,633
- Equity at exit
- $9,692
- IRR
- 34.3%
- Equity multiple
- 4.92×
- Total profit
- $71,268
- Equity at exit
- $5,620
Cash invested: $18,200 (down + closing). Projections, not guarantees.
Landlord ↔ Tenant lean methodology
- Overall (STATE)
- 81 Strongly Landlord-Friendly
- State Missouri
- 81 Strongly Landlord-Friendly · R+10
- County
- — inherits STATE
- City
- — inherits STATE
ZIP-level market 63135
- Rents YoY
- 9.0%
- Active inventory
- 162
- Price-to-rent
- 5.3×
Monthly cashflow live
- Estimated rent
- $1,014 high interval (Pro) →
- Mortgage (P&I)
- −$341
- Tax from tax record
- −$59 /mo · $708/yr
- Insurance
- −$27
- HOA
- −$0
- Vacancy / Maint / Mgmt
- −$213
- Net cashflow
- $374
Break-even live
UW: 25.0% down · 7.5% · 30yr · 1.5% tax · 5.0% vac · 8.0% maint · 8.0% mgmt
Financing live
Cash to close
- Down payment
- $16,250
- Closing costs
- $1,950
- Reserves months
- —
- Total cash needed
- —
Loan-product check · same deal, 3 products live
Conventional
25% down · 7.5% · 30yr
- Down + closing
- —
- Monthly P&I
- —
- Monthly cashflow
- —
- DSCR
- —
- Eligible?
- —
Personal DTI + credit; lowest rate.
DSCR
20% down · 8.5% · 30yr
- Down + closing
- —
- Monthly P&I
- —
- Monthly cashflow
- —
- DSCR
- —
- Eligible?
- —
No personal income docs; deal must DSCR.
Hard money
10% down · 12.0% · 12mo
- Down + closing
- —
- Monthly P&I
- —
- Monthly cashflow
- —
- DSCR
- —
- Eligible?
- —
Short-term bridge; refi at stabilization.
Rent comps 10 comps
| Address | Beds | Baths | Sqft | Rent | $/sqft | DOM | Units | Dist |
|---|---|---|---|---|---|---|---|---|
| 5500 Mable Ave Unit 5518 B4 St. Louis, MO | 2.0 | 1.0 | 750 | $835 | $1.11 | 43d | 1 | 0.05mi |
| 334 Mueller Ave Saint Louis, MO | 1.0 | 1.0 | 713 | $825 | $1.16 | 23d | 1 | 0.24mi |
| 806 Marvin Ave Saint Louis, MO | 2.0 | 1.0 | 726 | $1,100 | $1.52 | 43d | 1 | 0.41mi |
| 601 Carson Rd Saint Louis, MO | 2.0 | 1.0 | 743 | $950 | $1.28 | 23d | 1 | 0.76mi |
| 26 Arbor Village Ct Ferguson, MO | 1.0–2.0 | 1.0 | 714 | $950 | $1.33 | 23d | 1 | 0.95mi |
| 9316 Koenig Cir Berkeley, MO | 2.0 | 1.0 | 720 | $1,150 | $1.60 | 4d | 5 | 1.16mi |
| 7733 Brand Ave Saint Louis, MO | 2.0 | 1.0 | 656 | $1,090 | $1.66 | 23d | 1 | 1.22mi |
| 6180 Emerald Ave Saint Louis, MO | 2.0 | 1.0 | 729 | $1,300 | $1.78 | 43d | 1 | 1.36mi |
| 6315 Washington Ave Berkeley, MO | 2.0 | 1.0 | 739 | $1,175 | $1.59 | 16d | 1 | 1.46mi |
| 6336 Washington Ave Berkeley, MO | 2.0 | 1.0 | 720 | $1,175 | $1.63 | 43d | 1 | 1.49mi |
Listing history 27 events
-
2026-06-18days on market $65,000 Active 119 DOM
-
2026-06-17days on market $65,000 Active 118 DOM
-
2026-06-16days on market $65,000 Active 117 DOM
-
2026-06-15days on market $65,000 Active 116 DOM
-
2026-06-13days on market $65,000 Active 114 DOM
-
2026-06-13days on market $65,000 Active 113 DOM
-
2026-06-09days on market $65,000 Active 110 DOM
-
2026-06-08days on market $65,000 Active 109 DOM
-
2026-06-07days on market $65,000 Active 108 DOM
-
2026-06-05pricedays on market $65,000 Active 105 DOM
-
2026-06-03days on market $69,000 Active 104 DOM
-
2026-06-02days on market $69,000 Active 103 DOM
-
2026-06-01days on market $69,000 Active 102 DOM
-
2026-05-31days on market $69,000 Active 101 DOM
-
2026-04-15price $69,000 594-char remark
Show marketing remark (594 chars)
Charming and cozy 2-bedroom, 1-bath home with attached 1-car garage. This inviting residence features a bright, sun-filled living area, functional kitchen with dedicated dining space, and comfortable bedrooms with ample storage. Thoughtful updates enhance modern comfort while preserving classic charm. The attached garage provides convenient access and additional storage, while the compact yard ensures low-maintenance upkeep. Ideally located in a friendly neighborhood near everyday amenities, this well-maintained property presents an investment opportunity with steady cash flow potential.
-
2026-02-19$70,000 Active 594-char remark
Show marketing remark (594 chars)
Charming and cozy 2-bedroom, 1-bath home with attached 1-car garage. This inviting residence features a bright, sun-filled living area, functional kitchen with dedicated dining space, and comfortable bedrooms with ample storage. Thoughtful updates enhance modern comfort while preserving classic charm. The attached garage provides convenient access and additional storage, while the compact yard ensures low-maintenance upkeep. Ideally located in a friendly neighborhood near everyday amenities, this well-maintained property presents an investment opportunity with steady cash flow potential.
-
2021-03-18soldstatus $135,413
-
2020-12-17soldstatus $33,000
-
2020-08-05soldstatus $11,000
-
2020-06-24soldstatus Closed 90-char remark
Show marketing remark (90 chars)
Property is being sold as-is. Seller to pay for no inspections, utilities, and/or repairs.
-
2020-06-08status Pending 90-char remark
Show marketing remark (90 chars)
Property is being sold as-is. Seller to pay for no inspections, utilities, and/or repairs.
-
2020-05-07$15,000 Active 90-char remark
Show marketing remark (90 chars)
Property is being sold as-is. Seller to pay for no inspections, utilities, and/or repairs.
-
2013-04-22soldstatus $966,000
-
2002-08-27soldstatus
-
1999-12-21soldstatus
-
1999-05-06soldstatus $16,000
-
1999-05-04soldstatus $8,000
ⓘ Source: listings_history table (triggers on properties + properties_extension) + one-shot
backfill from property_details.listing_events for pre-trigger history.
Tax reassessment forecast MO · Resets to sale price
- Current annual tax
- $708 · $59/mo
- Projected year-2 tax
- $708 · $59/mo
- Expected delta
- $0/yr ($0/mo · 0.0%)
ⓘ Screening estimate from a state-policy table — verify with the county assessor before closing.
Climate risk First Street
- Flood 5/10 Major FEMA zone X (unshaded) · 65% chance over 30 yrs
- Wildfire 1/10 Low
- Heat 4/10 Moderate 7 d/yr ≥106°F today · 21 d/yr by 30 yrs out
- Wind 2/10 Low 100% chance of damaging wind over 30 yrs
- Air quality 4/10 Moderate 4 unhealthy d/yr today · 5 by 30 yrs out
Nearby sold comps map
Loading sold comps map…
Walkable amenities ~0.75 mi
Loading nearby amenities…
Taxation est. · year 1
- Rental income
- $12,163
- − Mortgage interest
- −$3,641
- − Property taxes
- −$708
- − Insurance
- −$325
- − Repairs & maintenance
- −$973
- − Management
- −$973
- − Depreciation
- −$1,891
- Taxable income
- $3,652
- Est. tax owed @ 24.0%
- −$877
- After-tax cash flow
- $3,609/yr
For passive investors: Depreciation is non-cash, so a rental often shows a tax loss while cash-flowing — sheltering income. Rental losses are passive: they offset passive income freely, and up to $25,000/yr can offset ordinary (W-2) income if you actively participate and your MAGI is under $100k (phasing out to $0 by $150k); unused losses carry forward. On sale, claimed depreciation is recaptured at up to 25%, and gains may owe capital-gains tax (a 1031 exchange can defer both). Figures are a year-1 estimate at your 24.0% rate — not tax advice; consult a CPA.
Schools (NCES district)
- District
- Ferguson-Florissant R-II
- NCES district ID
- 2912010
- Math proficiency
- 7% ▼ -9.00%
- Reading proficiency
- 20% ▼ -6.00%
- Median HH income
- $44,610
- Composite
- 11.96/100
- National rank
- #9666
- State rank
- #311 of 324 in MO
Livability — Ferguson
- Score
- 58/100
- State rank
- #586
- US rank
- #20809
Category grades
Schools grade is shown separately in the Schools card above.
Census & demographics
- Census place
- Ferguson, MO
- County
- Saint Louis County · 888,823 people
- City population
- 18,381
- Metro
- St. Louis, MO-IL
- Population (ZIP)
- 18,381
- Household income
- $52,328
- Rent vs Own
- Severe rent burden
- 957.0
Population outlook (St. Louis County) Hauer SSP2
- Today (2025)
- 1,025,227 people
- By 2030
- 1,028,023 · +0.3%
- By 2040
- 1,020,940 · -0.4%
- By 2050
- 1,007,280 · -1.8%
- By 2075
- 987,277 · -3.7%
- By 2100
- 921,984 · -10.1%
Race, ethnicity, and origin ACS 2023
- Neighborhood character
- Predominantly Black (66%)
- Race & ethnicity
- Black 66% White 28% Two or more races 3% Hispanic / Latino 2%
- Common ancestry
- Lithuanian 1% Iranian 1% Romanian 1%
- Foreign-born
- 1% · Canada
- Languages at home
- 95% English-only · Spanish 4%
Political lean MEDSL · St. Louis
- 2024 margin
- Strong D (+23.4) · D 60.8% · R 37.4% · Other 1.7%
- 2008→2024 swing
- +3.5pp toward D · 2008: 19.9pp · 2024: 23.4pp
- All cycles
- 2024: D+23.4 2020: D+24.0 2016: D+16.2 2012: D+13.7 2008: D+19.9
Not yet ingested
- Civics
- —
Market trends
- HPI YoY
- ▼ -152.56%
- Current HPI
- 138.6781
- Rent YoY
- ▲ 9.03%
- Metro
- St. Louis, MO-IL
- State GDP YoY
- ▲ 1.84%
- F500 in state
- 20
Industry mix (Fortune 500 HQ in MO)
| Industry | F500 HQs | Revenue |
|---|---|---|
| Healthcare | 1 | $163B |
|
||
| Insurance | 1 | $21B |
|
||
| Industrial Technology | 1 | $17B |
|
||
| Retail | 1 | $16B |
|
||
| Industrial Distribution | 1 | $10B |
|
||
| Utilities | 1 | $9B |
|
||
Price history
+762.5% since first listed13 events — show timeline
- 2026-04-15 Price Changed $69,000 MARIS as Distributed by MLS Grid
- 2026-02-19 Listed $70,000 MARIS as Distributed by MLS Grid
- 2021-03-18 Sold (Public Records) $135,413 Public Records
- 2020-12-17 Sold (Public Records) $33,000 Public Records
- 2020-08-05 Sold (Public Records) $11,000 Public Records
- 2020-06-24 Sold (MLS) — MARIS as Distributed by MLS Grid
- 2020-06-08 Pending — MARIS as Distributed by MLS Grid
- 2020-05-07 Listed $15,000 MARIS as Distributed by MLS Grid
- 2013-04-22 Sold (Public Records) $966,000 Public Records
- 2002-08-27 Sold (Public Records) — Public Records
- 1999-12-21 Sold (Public Records) — Public Records
- 1999-05-06 Sold (Public Records) $16,000 Public Records
- 1999-05-04 Sold (Public Records) $8,000 Public Records
Property tax history
+4.6%/yrLatest (2022): $708 · +3.2% YoY. Source: county tax records.
Cash-flow waterfall
monthlySold comps — $/sqft
last 12 mo · ≤1 miLoading sold comps…