 🏷️ Likely Rental
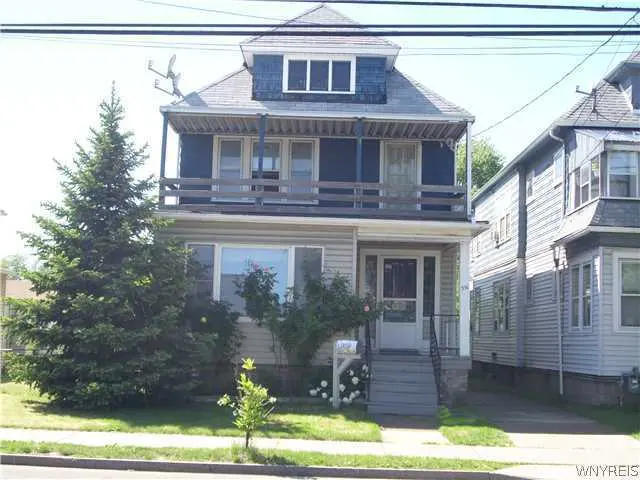
550 Ontario St · Buffalo, NY
Flood risk 4/10 · Minor
- FEMA flood zone
- X (unshaded)
- Chance of flooding over 30 yrs
- 0.22%
- Est. flood insurance / yr
- $473 – $860
Fire risk 1/10 · Minimal
- Est. fire insurance / yr
- $691 – $1,283
Heat risk 3/10 · Minor
- Hot days now (above 93°F)
- 7 days/yr
- Hot days in 30 yrs
- 15 days/yr
Wind risk 1/10 · Minimal
- Chance of severe wind over 30 yrs
- —
Air-quality risk 3/10 · Minor
- Unhealthy air days now
- 3 days/yr
- Unhealthy air days in 30 yrs
- 4 days/yr
Risk factors via First Street. Map © Google.
Why this score? — see what drove the B+ grade
The composite is a weighted blend of 9 inputs, each scored 0–100. Each bar is that input's sub-score; the figure is the points it added to the 100-point composite (weight × sub-score).
- Cash flow +30.0/30.0
- ARV discount +15.0/15.0
- DSCR +10.0/10.0
- 1% rule +9.5/10.0
- Rent growth +4.5/5.0
- Livability +3.9/5.0
- Schools +3.3/10.0
- Condition / age +2.5/5.0
- Appreciation +0.0/10.0
$189,000
🖨 Deal sheet 📄 Offer letter ✓ Due diligence
Multi-family units
County records classify this as Multi-Family (2-4 Unit). Listing-text estimate: 1 unit. estimate disagrees with records
Listing remarks MLS
WHY RENT WHEN YOU CAN OWN * BUILD EQUITY * LET YOUR TENANT HELP PAY THE MORTGAGE * SPACIOUS & SOLIDLY BUILT 3/3 DOUBLE IN THE UP AND COMING RIVERSIDE NEIGHBORHOOD * LOWER UNIT FEATURES A LARGE LIVING ROOM WITH ARTIFICIAL FIREPLACE * FORMAL DINING ROOM HAS A CEILING FAN * EAT IN KITCHEN IS PARTIALLY UPDATED * ONE BEDROOM HAS A DOOR THAT LEADS TO A 20X20 REAR COVERED DECK * BOTH UNITS FEATURE NATURAL WOODWORK AND BUILT IN CABINETS * UPPER UNIT HAS A 12X9 OPEN FRONT PORCH * UPGRADED ELECTRICAL SERVICE IN EACH UNIT * GLASS BLOCK BASEMENT * OFF STREET PARKING * SEPARATE UTILITIES EXCEPT FOR WATER * RENT COULD BE HIGHER
Key facts
- 3,750 sq ft lot
- Parking
- Built 1925
Neighborhood map
What this means for you Summary
Snapshot
- This is a 6-bed/2.0-bath multifamily listed at $189k.
Deal economics
- At list price, monthly cash flow is $1k ($12k/yr) — positive.
- The deal already cash-flows at list — no discount required.
- Meets the 1% rule at list price ($3k rent vs $189k).
- Recommended offer: $186k (1.5% below list) — sets the bar for market timing.
- Cap rate 12.7% vs local median 8.0% in Buffalo — top-decile yield for the area; either an underpriced asset or a hidden risk that comps aren't pricing in. Stress-test before assuming the spread holds.
Location & tenants
- Location reads 77/100 on livability (#195 in NY, #3,011 nationally) — a middle-class / working-renter tenant base. Strengths: commute A+, housing A+, health & safety A+; Watch: crime F, employment D-.
- Buffalo City School District (urban): math 41% / reading 40% proficiency, ranked #535 of 590 in NY (top 91%) — families likely to look elsewhere, expect single-tenant / working-renter base with shorter leases; 75% free/reduced lunch — lower-income household profile, screen leases tightly.
- Market conditions: Rents rising fast (+8.2%/yr); 197 active listings in the ZIP; lower-income renter base — watch delinquency; 1,244 units permitted in Erie County in 2024 (563 in 5+ unit buildings).
- At $2,734/mo this rent would consume 83% of the median local household income ($40k/yr) (locally 2177% of renters already pay >50% of income on rent) — very limited rent-growth headroom before tenants either downsize or default.
Forward outlook
- Local home prices are declining (-3.0%/yr); year-one equity from $1k of loan paydown is wiped out by about $6k of value loss. Plan a longer hold.
- At projected returns (-3.0% appreciation + 8.0% rent growth), your $53k cash investment doubles in ~5 years — after that, you're playing with house money.
Negotiation context
- It's been on market 20 days — a 2% lower offer ($186k) is reasonable based on typical stale-listing flexibility.
- 3 sale attempts since 13y ago with the ask held roughly flat each time — persistent listings suggest the price (not the market) is what's stuck; bring a comps-based counter.
- Current owner paid $58k; list at $189k implies a 226% gain — meaningful room to come down on a strong offer.
Risks & watch-outs
- Watch-outs: built in 1925 — expect roof / HVAC / electrical / plumbing capex.
Questions for the listing agent
- Built in 1925 — when were the roof, HVAC, electrical panel, plumbing, and water heater last replaced?
- Is there a deadline driving the sale (1031 exchange, divorce, estate, relocation)? That informs how much negotiation room exists.
- Crime grade is F in this area — have there been break-ins, vandalism, or insurance claims at this property in the last 3 years? What carrier currently insures it and at what premium?
- What's the average days-on-market for RENTAL listings here right now (not sales)? A rising rental-DOM trend means longer vacancies and softer asking-rent achievability than the comps imply.
- What's the recent tenant-quality profile in this submarket — average credit score on applications, eviction rate, late-payment / NSF rate, and stable-employment percentage? A property-management company in the area should have these aggregated.
- How much new apartment / multifamily construction is in the pipeline within 1–3 miles? Heavy new supply (>2% of stock underway) typically softens rents 12–24 months out; light construction supports rent growth.
Investment metrics
- 1% rule
- 1.45% ✓
- Cap rate
- 12.68%
- Cash-on-cash
- 22.79%
- DSCR
- 2.01
- GRM
- 5.8
CMA / ARV
- ARV (median comp)
- $373,412
- List price
- $189,000
- Delta
- -49.39%
- Verdict
- UNDERPRICED
- Comps
- 20 within 1.0 mi
Show comp detail 12 sales within ~0.75 mi
| Address | Dist | Beds/Ba | Sqft | Sold | Price | $/sf | Match |
|---|---|---|---|---|---|---|---|
| 528 Ontario St | 0.04mi | 6/2.0 | 2,664 (+8%) | 11mo | $240,000 | $90 | 77 |
| 129 Philadelphia St | 0.10mi | 6/2.0 | 2,292 (-8%) | 9mo | $250,000 | $109 | 75 |
| 74 Philadelphia St | 0.09mi | 6/2.0 | 2,160 (-13%) | 5mo | $170,000 | $79 | 70 |
| 68 Baxter St | 0.57mi | 6/2.0 | 2,430 (-2%) | 5mo | $165,000 | $68 | 66 |
| 908 Tonawanda St | 0.61mi | 6/2.0 | 2,332 (-6%) | 2mo | $145,000 | $62 | 60 |
| 179 Laird Ave | 0.40mi | 6/2.0 | 2,825 (+14%) | 0mo | $278,500 | $99 | 58 |
| 65 Huetter Ave | 0.75mi | 6/2.0 | 2,464 (-1%) | 13mo | $100,100 | $41 | 53 |
| 311 Newfield St | 0.45mi | 6/2.0 | 2,129 (-14%) | 6mo | $215,000 | $101 | 50 |
| 208 Roesch Ave | 0.38mi | 6/2.0 | 2,160 (-13%) | 13mo | $250,000 | $116 | 50 |
| 84 Riverside Ave | 0.64mi | 6/2.0 | 2,200 (-11%) | 13mo | $250,000 | $114 | 41 |
| 241 Laird Ave | 0.52mi | 6/4.0 | 2,200 (-11%) | 13mo | $83,500 | $38 | 39 |
| 378 Wabash Ave | 0.73mi | 5/2.0 (-1) | 2,299 (-7%) | 13mo | $285,000 | $124 | 38 |
Match score weights: distance 35% · size 25% · config 20% · recency 20%. Top-matched comps best support the ARV.
Projected returns pro-forma
-3.0% appreciation · 8.0% rent growth · sell at horizon
- IRR
- 20.9%
- Equity multiple
- 1.90×
- Total profit
- $47,795
- Equity at exit
- $28,181
- IRR
- 32.0%
- Equity multiple
- 4.58×
- Total profit
- $189,612
- Equity at exit
- $16,341
Cash invested: $52,920 (down + closing). Projections, not guarantees.
Landlord ↔ Tenant lean methodology
- Overall (STATE)
- 15 Strongly Tenant-Friendly
- State New York
- 15 Strongly Tenant-Friendly · D+10
- County
- — inherits STATE
- City
- — inherits STATE
ZIP-level market 14207
- Home prices YoY
- -18.9%
- Rents YoY
- 8.2%
- Active inventory
- 197
- Price-to-rent
- 11.5×
Monthly cashflow live
- Estimated rent
- $2,734 high interval (Pro) →
- Mortgage (P&I)
- −$991
- Tax from tax record
- −$85 /mo · $1,017/yr
- Insurance
- −$79
- HOA
- −$0
- Vacancy / Maint / Mgmt
- −$574
- Net cashflow
- $1,005
Break-even live
2-unit breakdown (identical units grouped — click to expand)
| Units | Beds | Baths | Est. rent |
|---|---|---|---|
| 2× units | 3 | 1.5 | $2,734 |
| #1 | 3 | 1.5 | $1,367 |
| #2 | 3 | 1.5 | $1,367 |
| Total (2 units) | $2,734 | ||
UW: 25.0% down · 7.5% · 30yr · 1.5% tax · 5.0% vac · 8.0% maint · 8.0% mgmt
Financing live
Cash to close
- Down payment
- $47,250
- Closing costs
- $5,670
- Reserves months
- —
- Total cash needed
- —
Loan-product check · same deal, 3 products live
Conventional
25% down · 7.5% · 30yr
- Down + closing
- —
- Monthly P&I
- —
- Monthly cashflow
- —
- DSCR
- —
- Eligible?
- —
Personal DTI + credit; lowest rate.
DSCR
20% down · 8.5% · 30yr
- Down + closing
- —
- Monthly P&I
- —
- Monthly cashflow
- —
- DSCR
- —
- Eligible?
- —
No personal income docs; deal must DSCR.
Hard money
10% down · 12.0% · 12mo
- Down + closing
- —
- Monthly P&I
- —
- Monthly cashflow
- —
- DSCR
- —
- Eligible?
- —
Short-term bridge; refi at stabilization.
Listing history 12 events
-
2026-06-13statusdays on market $189,000 Pending 20 DOM
-
2026-06-10days on market $189,000 Active 19 DOM
-
2026-06-09days on market $189,000 Active 18 DOM
-
2026-06-08days on market $189,000 Active 17 DOM
-
2026-06-07statusdays on market $189,000 Active 16 DOM
-
2026-05-07historical Active Under Contract
-
2026-05-06status Active
-
2026-05-05status Pending
-
2026-04-19$189,000 Active
-
2013-09-16soldstatus $58,000 627-char remark
Show marketing remark (627 chars)
WHY RENT WHEN YOU CAN OWN * BUILD EQUITY * LET YOUR TENANT HELP PAY THE MORTGAGE * SPACIOUS & SOLIDLY BUILT 3/3 DOUBLE IN THE UP AND COMING RIVERSIDE NEIGHBORHOOD * LOWER UNIT FEATURES A LARGE LIVING ROOM WITH ARTIFICIAL FIREPLACE * FORMAL DINING ROOM HAS A CEILING FAN * EAT IN KITCHEN IS PARTIALLY UPDATED * ONE BEDROOM HAS A DOOR THAT LEADS TO A 20X20 REAR COVERED DECK * BOTH UNITS FEATURE NATURAL WOODWORK AND BUILT IN CABINETS * UPPER UNIT HAS A 12X9 OPEN FRONT PORCH * UPGRADED ELECTRICAL SERVICE IN EACH UNIT * GLASS BLOCK BASEMENT * OFF STREET PARKING * SEPARATE UTILITIES EXCEPT FOR WATER * RENT COULD BE HIGHER
-
2013-09-16soldstatus $55,000
Show marketing remark (627 chars)
WHY RENT WHEN YOU CAN OWN * BUILD EQUITY * LET YOUR TENANT HELP PAY THE MORTGAGE * SPACIOUS & SOLIDLY BUILT 3/3 DOUBLE IN THE UP AND COMING RIVERSIDE NEIGHBORHOOD * LOWER UNIT FEATURES A LARGE LIVING ROOM WITH ARTIFICIAL FIREPLACE * FORMAL DINING ROOM HAS A CEILING FAN * EAT IN KITCHEN IS PARTIALLY UPDATED * ONE BEDROOM HAS A DOOR THAT LEADS TO A 20X20 REAR COVERED DECK * BOTH UNITS FEATURE NATURAL WOODWORK AND BUILT IN CABINETS * UPPER UNIT HAS A 12X9 OPEN FRONT PORCH * UPGRADED ELECTRICAL SERVICE IN EACH UNIT * GLASS BLOCK BASEMENT * OFF STREET PARKING * SEPARATE UTILITIES EXCEPT FOR WATER * RENT COULD BE HIGHER
-
2013-03-19$64,900 627-char remark
Show marketing remark (627 chars)
WHY RENT WHEN YOU CAN OWN * BUILD EQUITY * LET YOUR TENANT HELP PAY THE MORTGAGE * SPACIOUS & SOLIDLY BUILT 3/3 DOUBLE IN THE UP AND COMING RIVERSIDE NEIGHBORHOOD * LOWER UNIT FEATURES A LARGE LIVING ROOM WITH ARTIFICIAL FIREPLACE * FORMAL DINING ROOM HAS A CEILING FAN * EAT IN KITCHEN IS PARTIALLY UPDATED * ONE BEDROOM HAS A DOOR THAT LEADS TO A 20X20 REAR COVERED DECK * BOTH UNITS FEATURE NATURAL WOODWORK AND BUILT IN CABINETS * UPPER UNIT HAS A 12X9 OPEN FRONT PORCH * UPGRADED ELECTRICAL SERVICE IN EACH UNIT * GLASS BLOCK BASEMENT * OFF STREET PARKING * SEPARATE UTILITIES EXCEPT FOR WATER * RENT COULD BE HIGHER
ⓘ Source: listings_history table (triggers on properties + properties_extension) + one-shot
backfill from property_details.listing_events for pre-trigger history.
Tax reassessment forecast NY · Partial reset (capped growth)
- Current annual tax
- $1,017 · $85/mo
- Projected year-2 tax
- $2,105 · $175/mo
- Expected delta
- +$1,089/yr (+$91/mo · 107.1%)
ⓘ Screening estimate from a state-policy table — verify with the county assessor before closing.
Climate risk First Street
- Flood 4/10 Moderate FEMA zone X (unshaded) · 22% chance over 30 yrs
- Wildfire 1/10 Low
- Heat 3/10 Moderate 7 d/yr ≥93°F today · 15 d/yr by 30 yrs out
- Wind 1/10 Low
- Air quality 3/10 Moderate 3 unhealthy d/yr today · 4 by 30 yrs out
Nearby sold comps map
Loading sold comps map…
Walkable amenities ~0.75 mi
Loading nearby amenities…
Taxation est. · year 1
- Rental income
- $32,808
- − Mortgage interest
- −$10,587
- − Property taxes
- −$1,017
- − Insurance
- −$945
- − Repairs & maintenance
- −$2,625
- − Management
- −$2,625
- − Depreciation
- −$5,498
- Taxable income
- $9,512
- Est. tax owed @ 24.0%
- −$2,283
- After-tax cash flow
- $9,780/yr
For passive investors: Depreciation is non-cash, so a rental often shows a tax loss while cash-flowing — sheltering income. Rental losses are passive: they offset passive income freely, and up to $25,000/yr can offset ordinary (W-2) income if you actively participate and your MAGI is under $100k (phasing out to $0 by $150k); unused losses carry forward. On sale, claimed depreciation is recaptured at up to 25%, and gains may owe capital-gains tax (a 1031 exchange can defer both). Figures are a year-1 estimate at your 24.0% rate — not tax advice; consult a CPA.
Schools (NCES district)
- District
- Buffalo City School District
- NCES district ID
- 3605850
- Math proficiency
- 41% ▲ 11.00%
- Reading proficiency
- 40% ▲ 7.00%
- Median HH income
- $31,665
- Composite
- 33.17/100
- National rank
- #5544
- State rank
- #535 of 590 in NY
Livability — Buffalo
- Score
- 77/100
- State rank
- #195
- US rank
- #3011
Category grades
Schools grade is shown separately in the Schools card above.
Census & demographics
- Census place
- Buffalo, NY
- County
- Erie County · 714,559 people
- City population
- 440,021
- Metro
- Buffalo-Cheektowaga, NY
- Population (ZIP)
- 26,327
- Household income
- $39,753
- Rent vs Own
- Severe rent burden
- 2177.0
Population outlook (Erie County) Hauer SSP2
- Today (2025)
- 933,037 people
- By 2030
- 935,181 · +0.2%
- By 2040
- 928,531 · -0.5%
- By 2050
- 905,725 · -2.9%
- By 2075
- 834,037 · -10.6%
- By 2100
- 708,033 · -24.1%
Race, ethnicity, and origin ACS 2023
- Neighborhood character
- Highly diverse neighborhood (Simpson 0.74)
- Race & ethnicity
- White 40% Hispanic / Latino 23% Black 16% Asian 15% Two or more races 14%
- Hispanic origin (detail)
- Puerto Rican 18% Dominican 2%
- Common ancestry
- Romanian 8% Portuguese 1% Arab 1%
- Foreign-born
- 19% · Philippines, Canada, India
- Languages at home
- 65% English-only · Spanish 14% Other Asian/Pacific 10% Other Indo-European 5%
Political lean MEDSL · Erie
- 2024 margin
- Lean D (+9.7) · D 54.8% · R 45.2%
- 2008→2024 swing
- -7.9pp toward R · 2008: 17.5pp · 2024: 9.7pp
- All cycles
- 2024: D+9.7 2020: D+14.7 2016: D+4.8 2012: D+15.6 2008: D+17.5
Not yet ingested
- Civics
- —
Market trends
- HPI YoY
- ▼ -54.42%
- Current HPI
- 233.0902
- Rent YoY
- ▲ 8.19%
- Metro
- Buffalo-Cheektowaga, NY
- State GDP YoY
- ▲ 2.60%
- F500 in state
- 92
Industry mix (Fortune 500 HQ in NY)
| Industry | F500 HQs | Revenue |
|---|---|---|
| Financial Services | 10 | $950B |
|
||
| Consumer Goods | 9 | $162B |
|
||
| Insurance | 4 | $225B |
|
||
| Telecommunications | 2 | $144B |
|
||
| Pharmaceuticals | 2 | $112B |
|
||
| Media / Entertainment | 2 | $69B |
|
||
Price history
+191.2% since first listed7 events — show timeline
- 2026-05-07 Contingent — WNYREIS
- 2026-05-06 Relisted — WNYREIS
- 2026-05-05 Pending — WNYREIS
- 2026-04-19 Listed $189,000 WNYREIS
- 2013-09-16 Sold (Public Records) $55,000 Public Records
- 2013-09-16 Sold (MLS) $58,000 WNYREIS
- 2013-03-19 Listed $64,900 WNYREIS
Property tax history
+22.8%/yrLatest (2020): $1,017 · +0.0% YoY. Source: county tax records.
Cash-flow waterfall
monthlySold comps — $/sqft
last 12 mo · ≤1 miLoading sold comps…