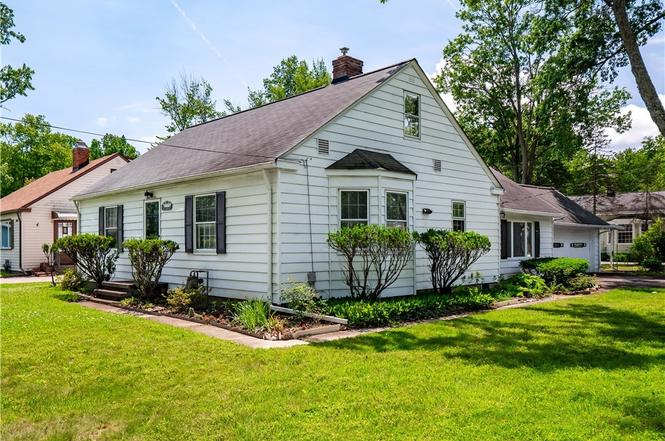
3650 Dover Center Rd · Westlake, OH
Flood risk 4/10 · Minor
- FEMA flood zone
- X (unshaded)
- Chance of flooding over 30 yrs
- 0.22%
- Est. flood insurance / yr
- $507 – $1,088
Fire risk 1/10 · Minimal
- Est. fire insurance / yr
- $713 – $1,323
Heat risk 2/10 · Minimal
- Hot days now (above 95°F)
- 7 days/yr
- Hot days in 30 yrs
- 16 days/yr
Wind risk 1/10 · Minimal
- Chance of severe wind over 30 yrs
- —
Air-quality risk 2/10 · Minimal
- Unhealthy air days now
- 1 days/yr
- Unhealthy air days in 30 yrs
- 3 days/yr
Risk factors via First Street. Map © Google.
Why this score? — see what drove the C grade
The composite is a weighted blend of 9 inputs, each scored 0–100. Each bar is that input's sub-score; the figure is the points it added to the 100-point composite (weight × sub-score).
- Cash flow +17.7/30.0
- ARV discount +15.0/15.0
- Schools +6.6/10.0
- DSCR +5.5/10.0
- 1% rule +5.2/10.0
- Livability +4.1/5.0
- Rent growth +3.1/5.0
- Condition / age +2.5/5.0
- Appreciation +0.0/10.0
$240,000
🖨 Deal sheet 📄 Offer letter ✓ Due diligence
Listing remarks MLS
Great Starter-corner Lot-pine Paneled 2nd Flr-1.5 Baths On 1st-spacious Family Rm-attached 2 Car Gar-alum Siding New Storm Windows-beautiful Oak Floors-checklist
Key facts
- Hardwood flooring
- Side-entry driveway
- Westlake location
Tags
Neighborhood map
What this means for you Summary
Snapshot
- This is a 3-bed/1.5-bath single-family listed at $240k.
Deal economics
- At list price, monthly cash flow is $195 ($2k/yr) — positive.
- The deal already cash-flows at list — no discount required.
- Meets the 1% rule at list price ($2k rent vs $240k).
- Cap rate 7.3% vs local median 3.3% in Westlake — top-decile yield for the area; either an underpriced asset or a hidden risk that comps aren't pricing in. Stress-test before assuming the spread holds.
Location & tenants
- Location reads 82/100 on livability (#79 in OH, #1,202 nationally) — a professional / high-income tenant draw. Strengths: schools A+, crime A+, employment A+; Watch: amenities F, commute F.
- Westlake City (suburban): math 71% / reading 79% proficiency, ranked #76 of 656 in OH (top 12%) — strong family-tenant draw, lease renewals of 3-5y typical; only 15% free/reduced lunch — higher-income household profile.
- Market conditions: Rents rising (+2.3%/yr); 163 active listings in the ZIP; 6 comparable units currently listed for rent nearby; rentals lingering (median 44d on market — plan ~5-8 weeks vacancy on turnover, expect pricing pressure); 50% of comp listings sitting > 30 days — soft ceiling on asking rent; high-income renter base; 1,441 units permitted in Cuyahoga County in 2024 (700 in 5+ unit buildings).
Forward outlook
- Local home prices are declining (-3.0%/yr); year-one equity from $2k of loan paydown is wiped out by about $7k of value loss. Plan a longer hold.
- Cuyahoga County population projected to shrink 8% by 2050 — rents likely to lag national; underwrite the cash flow, not the appreciation.
Negotiation context
- Only 1 days on market — expect competitive offers; lowballing is unlikely to land.
- 2 sale attempts since 34y ago with the ask held roughly flat each time — persistent listings suggest the price (not the market) is what's stuck; bring a comps-based counter.
- Current owner paid $85k; list at $240k implies a 182% gain — meaningful room to come down on a strong offer.
Risks & watch-outs
- Watch-outs: built in 1949 — expect roof / HVAC / electrical / plumbing capex.
Questions for the listing agent
- Built in 1949 — when were the roof, HVAC, electrical panel, plumbing, and water heater last replaced?
- Is there a deadline driving the sale (1031 exchange, divorce, estate, relocation)? That informs how much negotiation room exists.
- Schools are A-rated — typically a magnet for longer-tenancy family renters. What's the average tenant stay here, and is there a school-zone premium baked into asking?
- What's the average days-on-market for RENTAL listings here right now (not sales)? A rising rental-DOM trend means longer vacancies and softer asking-rent achievability than the comps imply.
- What's the recent tenant-quality profile in this submarket — average credit score on applications, eviction rate, late-payment / NSF rate, and stable-employment percentage? A property-management company in the area should have these aggregated.
- How much new for-sale + rental construction is in the pipeline within 1–3 miles? Heavy new supply typically softens prices + rents 12–24 months out; constrained supply supports both.
Investment metrics
- 1% rule
- 1.02% ✓
- Cap rate
- 7.27%
- Cash-on-cash
- 3.48%
- DSCR
- 1.15
- GRM
- 8.2
CMA / ARV
- ARV (on-the-fly)
- $327,212
- Comps found
- 12
Show comp detail 12 sales within ~0.75 mi
| Address | Dist | Beds/Ba | Sqft | Sold | Price | $/sf | Match |
|---|---|---|---|---|---|---|---|
| 26454 Strawberry Ln | 0.38mi | 3/2.0 | 1,858 (+2%) | 4mo | $396,000 | $213 | 74 |
| 27680 Dunford Rd | 0.33mi | 4/2.0 (+1) | 1,876 (+3%) | 10mo | $320,000 | $171 | 65 |
| 3974 Winton Park Dr | 0.30mi | 3/2.0 | 2,040 (+12%) | 2mo | $369,500 | $181 | 63 |
| 27158 Rose Rd | 0.29mi | 3/1.5 | 1,628 (-11%) | 9mo | $335,000 | $206 | 61 |
| 26716 Chapel Hill Dr | 0.33mi | 3/2.0 | 2,048 (+12%) | 6mo | $342,500 | $167 | 58 |
| 26358 Rose Rd | 0.57mi | 4/2.0 (+1) | 1,902 (+4%) | 3mo | $393,263 | $207 | 57 |
| 26864 Sweetbriar Dr | 0.51mi | 4/2.5 (+1) | 1,890 (+3%) | 8mo | $205,000 | $108 | 55 |
| 26839 Fairfax Ln | 0.49mi | 3/2.0 | 2,044 (+12%) | 3mo | $365,000 | $179 | 53 |
| 26725 Sweetbriar Dr | 0.58mi | 3/2.0 | 1,972 (+8%) | 7mo | $240,000 | $122 | 52 |
| 26501 Waterbury Cir | 0.54mi | 3/1.5 | 2,044 (+12%) | 7mo | $342,000 | $167 | 50 |
| 26646 Sweetbriar Dr | 0.56mi | 4/2.5 (+1) | 1,960 (+7%) | 5mo | $345,100 | $176 | 48 |
| 4075 Brewster Dr | 0.70mi | 4/2.5 (+1) | 2,002 (+10%) | 12mo | $420,000 | $210 | 32 |
Match score weights: distance 35% · size 25% · config 20% · recency 20%. Top-matched comps best support the ARV.
Projected returns pro-forma
-3.0% appreciation · 2.32% rent growth · sell at horizon
- IRR
- -11.6%
- Equity multiple
- 0.58×
- Total profit
- $-28,061
- Equity at exit
- $35,785
- IRR
- -3.4%
- Equity multiple
- 0.78×
- Total profit
- $-14,837
- Equity at exit
- $20,751
Cash invested: $67,200 (down + closing). Projections, not guarantees.
Landlord ↔ Tenant lean methodology
- Overall (STATE)
- 73 Landlord-Friendly
- State Ohio
- 73 Landlord-Friendly · R+6
- County
- — inherits STATE
- City
- — inherits STATE
ZIP-level market 44145
- Rents YoY
- 2.3%
- Active inventory
- 163
- Price-to-rent
- 8.2×
Monthly cashflow live
- Estimated rent
- $2,437 high interval (Pro) →
- Mortgage (P&I)
- −$1,259
- Tax from tax record
- −$372 /mo · $4,459/yr
- Insurance
- −$100
- HOA
- −$0
- Vacancy / Maint / Mgmt
- −$512
- Net cashflow
- $195
Break-even live
UW: 25.0% down · 7.5% · 30yr · 1.5% tax · 5.0% vac · 8.0% maint · 8.0% mgmt
Financing live
Cash to close
- Down payment
- $60,000
- Closing costs
- $7,200
- Reserves months
- —
- Total cash needed
- —
Loan-product check · same deal, 3 products live
Conventional
25% down · 7.5% · 30yr
- Down + closing
- —
- Monthly P&I
- —
- Monthly cashflow
- —
- DSCR
- —
- Eligible?
- —
Personal DTI + credit; lowest rate.
DSCR
20% down · 8.5% · 30yr
- Down + closing
- —
- Monthly P&I
- —
- Monthly cashflow
- —
- DSCR
- —
- Eligible?
- —
No personal income docs; deal must DSCR.
Hard money
10% down · 12.0% · 12mo
- Down + closing
- —
- Monthly P&I
- —
- Monthly cashflow
- —
- DSCR
- —
- Eligible?
- —
Short-term bridge; refi at stabilization.
Rent comps 6 comps
| Address | Beds | Baths | Sqft | Rent | $/sqft | DOM | Units | Dist |
|---|---|---|---|---|---|---|---|---|
| 28310 Center Ridge Rd Westlake, OH | 3.0 | 2.0 | 2120 | $2,300 | $1.08 | 1d | 1 | 0.77mi |
| 4238 Porter Rd North Olmsted, OH | 3.0 | 1.0 | 1240 | $1,980 | $1.60 | 44d | 1 | 0.86mi |
| 29395 Hummingbird Cir Westlake, OH | 3.0 | 2.0 | 1846 | $3,200 | $1.73 | 10d | 1 | 1.14mi |
| 25312 Hall Dr Westlake, OH | 4.0 | 1.5 | 1260 | $2,280 | $1.81 | 44d | 1 | 1.29mi |
| 29842 Lenox Dr #225 Westlake, OH | 2.0 | 2.0 | 1233 | $1,850 | $1.50 | 44d | 1 | 1.48mi |
| 29826 Center Ridge Rd Unit 216 Westlake, OH | 2.0 | 2.0 | 1307 | $1,800 | $1.38 | 1d | 1 | 1.50mi |
Listing history 3 events
-
2026-06-19status $240,000 Pending 1 DOM
-
2026-06-17remarks 699-char remark
-
2026-06-17$240,000 Active 1 DOM
ⓘ Source: listings_history table (triggers on properties + properties_extension) + one-shot
backfill from property_details.listing_events for pre-trigger history.
Tax reassessment forecast OH · Partial reset (capped growth)
- Current annual tax
- $4,459 · $372/mo
- Projected year-2 tax
- $4,459 · $372/mo
- Expected delta
- $0/yr ($0/mo · 0.0%)
ⓘ Screening estimate from a state-policy table — verify with the county assessor before closing.
Climate risk First Street
- Flood 4/10 Moderate FEMA zone X (unshaded) · 22% chance over 30 yrs
- Wildfire 1/10 Low
- Heat 2/10 Low 7 d/yr ≥95°F today · 16 d/yr by 30 yrs out
- Wind 1/10 Low
- Air quality 2/10 Low 1 unhealthy d/yr today · 3 by 30 yrs out
Nearby sold comps map
Loading sold comps map…
Walkable amenities ~0.75 mi
Loading nearby amenities…
Taxation est. · year 1
- Rental income
- $29,240
- − Mortgage interest
- −$13,444
- − Property taxes
- −$4,459
- − Insurance
- −$1,200
- − Repairs & maintenance
- −$2,339
- − Management
- −$2,339
- − Depreciation
- −$6,982
- Taxable loss
- −$1,523
- Est. tax savings @ 24.0%
- +$366
- After-tax cash flow
- $2,703/yr
For passive investors: Depreciation is non-cash, so a rental often shows a tax loss while cash-flowing — sheltering income. Rental losses are passive: they offset passive income freely, and up to $25,000/yr can offset ordinary (W-2) income if you actively participate and your MAGI is under $100k (phasing out to $0 by $150k); unused losses carry forward. On sale, claimed depreciation is recaptured at up to 25%, and gains may owe capital-gains tax (a 1031 exchange can defer both). Figures are a year-1 estimate at your 24.0% rate — not tax advice; consult a CPA.
Schools (NCES district)
- District
- Westlake City
- NCES district ID
- 3904506
- Math proficiency
- 71% ▼ -12.00%
- Reading proficiency
- 79% ▼ -7.00%
- Median HH income
- $74,709
- Composite
- 65.85/100
- National rank
- #451
- State rank
- #76 of 656 in OH
Livability — Westlake
- Score
- 82/100
- State rank
- #79
- US rank
- #1202
Category grades
Schools grade is shown separately in the Schools card above.
Census & demographics
- Census place
- Westlake, OH
- County
- Cuyahoga County · 1,090,369 people
- City population
- 34,104
- Metro
- Cleveland-Elyria, OH
- Population (ZIP)
- 34,104
- Household income
- $112,200
- Rent vs Own
- Severe rent burden
- 690.0
Population outlook (Cuyahoga County) Hauer SSP2
- Today (2025)
- 1,244,621 people
- By 2030
- 1,230,093 · -1.2%
- By 2040
- 1,189,108 · -4.5%
- By 2050
- 1,145,706 · -7.9%
- By 2075
- 1,076,557 · -13.5%
- By 2100
- 978,987 · -21.3%
Race, ethnicity, and origin ACS 2023
- Neighborhood character
- Predominantly White (85%)
- Race & ethnicity
- White 85% Asian 7% Two or more races 5% Hispanic / Latino 4% Black 2%
- Common ancestry
- Romanian 7% Lithuanian 3% Subsaharan African 2%
- Foreign-born
- 13% · Canada, China, South Korea
- Languages at home
- 84% English-only · Arabic 5% Other Indo-European 4% Russian/Polish/Slavic 2%
Political lean MEDSL · Cuyahoga
- 2024 margin
- Solid D (+31.5) · D 65.4% · R 33.9%
- 2008→2024 swing
- -7.4pp toward R · 2008: 38.9pp · 2024: 31.5pp
- All cycles
- 2024: D+31.5 2020: D+34.1 2016: D+35.0 2012: D+38.7 2008: D+38.9
Not yet ingested
- Civics
- —
Market trends
- HPI YoY
- ▼ -191.97%
- Current HPI
- 202.4805
- Rent YoY
- ▲ 2.32%
- Metro
- Cleveland-Elyria, OH
- State GDP YoY
- ▲ 1.98%
- F500 in state
- 48
Industry mix (Fortune 500 HQ in OH)
| Industry | F500 HQs | Revenue |
|---|---|---|
| Insurance | 3 | $145B |
|
||
| Industrial Machinery | 3 | $49B |
|
||
| Financial Services | 3 | $24B |
|
||
| Consumer Goods | 2 | $93B |
|
||
| Aerospace / Defense | 2 | $47B |
|
||
| Utilities | 2 | $33B |
|
||
Price history
+154.0% since first listed5 events — show timeline
- 2026-06-17 Listed $240,000 MLSNOW
- 1992-07-16 Sold (Public Records) $85,000 Public Records
- 1992-07-16 Sold (Public Records) $85,000 Public Records
- 1992-07-16 Sold (MLS) $85,000 MLSNOW
- 1992-04-29 Listed $94,500 MLSNOW
Property tax history
+4.7%/yrLatest (2025): $4,459 · -1.0% YoY. Source: county tax records.
Cash-flow waterfall
monthlySold comps — $/sqft
last 12 mo · ≤1 miLoading sold comps…