 Duplex
809 Station St · South Fayette, PA
Flood risk 1/10 · Minimal
- FEMA flood zone
- X (unshaded)
- Chance of flooding over 30 yrs
- 0.0%
- Est. flood insurance / yr
- $473 – $860
Fire risk 1/10 · Minimal
- Est. fire insurance / yr
- $511 – $949
Heat risk 3/10 · Minor
- Hot days now (above 96°F)
- 7 days/yr
- Hot days in 30 yrs
- 17 days/yr
Wind risk 2/10 · Minimal
- Chance of severe wind over 30 yrs
- —
Air-quality risk 2/10 · Minimal
- Unhealthy air days now
- 1 days/yr
- Unhealthy air days in 30 yrs
- 2 days/yr
Risk factors via First Street. Map © Google.
Why this score? — see what drove the B grade
The composite is a weighted blend of 9 inputs, each scored 0–100. Each bar is that input's sub-score; the figure is the points it added to the 100-point composite (weight × sub-score).
- Cash flow +27.5/30.0
- DSCR +9.7/10.0
- 1% rule +8.0/10.0
- ARV discount +7.5/15.0
- Schools +6.7/10.0
- Appreciation +3.7/10.0
- Rent growth +2.5/5.0
- Livability +2.5/5.0
- Condition / age +2.5/5.0
$199,999
🖨 Deal sheet 📄 Offer letter ✓ Due diligence
Multi-family units
County records classify this as Multi-Family (2-4 Unit). Listing-text estimate: 2 units. confirmed
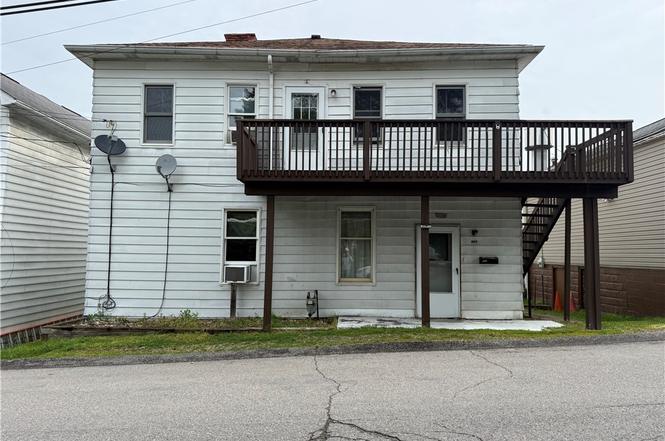
Listing remarks MLS
Great investment property in South Fayette School District. Two story up and down duplex located in Sturgeon with convenient access to the Panhandle trail. Each unit has 2 bedrooms, living room, kitchen & full bath. Both units have a washer and dryer in their units. All of the utilities have been separated. Nice level yard with storage shed and off street parking in the rear of the home. Solid rental history!
Key facts
- Off street parking
- On street parking
- 4,159 sq ft lot
Tags
Property features AI
Finance
- Financial info: Gross rental income listed as $21,600 annually; Current actual rent shown as $900 per unit; Vacancy allowance listed as $1,080
Exterior
- Parking: Off-street parking; On-street parking
- Utilities: Electricity available; Natural gas available; Public sewer available; Public water available
- Home design: Two-unit multi-family property
- Construction: Aluminum siding; Asphalt roof
- Exterior features: Lot zoned R2
Interior
- Bedrooms: Two 2-bedroom units
- Bathrooms: Each unit has one full bathroom
- Interior features: Unfinished basement
Neighborhood map
What this means for you Summary
Snapshot
- This is a 2 × 2-bed/1.0-bath units multifamily listed at $200k.
Deal economics
- At list price, monthly cash flow is $593 ($7k/yr) — positive. Per door: $297/mo.
- The deal already cash-flows at list — no discount required.
- Meets the 1% rule at list price ($3k rent vs $200k).
Location & tenants
- Location reads: area grade B — affects rentability + tenant quality, not the cash-flow math above.
- South Fayette Township SD (suburban): math 67% / reading 85% proficiency, ranked #12 of 539 in PA (top 2%) — strong family-tenant draw, lease renewals of 3-5y typical; only 10% free/reduced lunch — higher-income household profile.
- Market conditions: 2 active listings in the ZIP; 2,996 units permitted in Allegheny County in 2024 (1,588 in 5+ unit buildings).
Forward outlook
- Local home prices are declining (-2.6%/yr); year-one equity from $1k of loan paydown is wiped out by about $5k of value loss. Plan a longer hold.
- At projected returns (-2.6% appreciation + 3.0% rent growth), your $56k cash investment doubles in ~9 years — after that, you're playing with house money.
Negotiation context
- Only 3 days on market — expect competitive offers; lowballing is unlikely to land.
- 3 sale attempts since 11y ago with the ask held roughly flat each time — persistent listings suggest the price (not the market) is what's stuck; bring a comps-based counter.
- Current owner paid $165k; 21% above their basis — modest negotiation headroom, anchor on the comps not their cost.
Risks & watch-outs
- Watch-outs: built in 1900 — expect roof / HVAC / electrical / plumbing capex.
Questions for the listing agent
- Can we see the unit-by-unit rent roll, current vacancy, and any below-market leases? What's the average tenancy length?
- What capital expenditures (roof, boiler, parking lot, exteriors) have been made in the last 5 years, and what's planned in the next 2?
- Built in 1900 — when were the roof, HVAC, electrical panel, plumbing, and water heater last replaced?
- Is there a deadline driving the sale (1031 exchange, divorce, estate, relocation)? That informs how much negotiation room exists.
- What's the average days-on-market for RENTAL listings here right now (not sales)? A rising rental-DOM trend means longer vacancies and softer asking-rent achievability than the comps imply.
- What's the recent tenant-quality profile in this submarket — average credit score on applications, eviction rate, late-payment / NSF rate, and stable-employment percentage? A property-management company in the area should have these aggregated.
- How much new apartment / multifamily construction is in the pipeline within 1–3 miles? Heavy new supply (>2% of stock underway) typically softens rents 12–24 months out; light construction supports rent growth.
Investment metrics
- 1% rule
- 1.30% ✓
- Cap rate
- 9.85%
- Cash-on-cash
- 12.71%
- DSCR
- 1.57
- GRM
- 6.4
CMA / ARV
No comps found within radius.
Projected returns pro-forma
-2.62% appreciation · 3.0% rent growth · sell at horizon
- IRR
- 3.9%
- Equity multiple
- 1.15×
- Total profit
- $8,676
- Equity at exit
- $33,255
- IRR
- 12.8%
- Equity multiple
- 2.06×
- Total profit
- $59,318
- Equity at exit
- $23,250
Cash invested: $56,000 (down + closing). Projections, not guarantees.
Landlord ↔ Tenant lean methodology
- Overall (STATE)
- 62 Landlord-Friendly
- State Pennsylvania
- 62 Landlord-Friendly · EVEN
- County
- — inherits STATE
- City
- — inherits STATE
ZIP-level market 15082
- Home prices YoY
- -1.1%
- Active inventory
- 2
- Price-to-rent
- 12.9×
Monthly cashflow live
- Estimated rent
- $2,590 medium interval (Pro) →
- Mortgage (P&I)
- −$1,049
- Tax from tax record
- −$321 /mo · $3,851/yr
- Insurance
- −$83
- HOA
- −$0
- Vacancy / Maint / Mgmt
- −$544
- Net cashflow
- $593
Break-even live
2-unit breakdown (identical units grouped — click to expand)
| Units | Beds | Baths | Est. rent |
|---|---|---|---|
| 2× units | 2 | 1 | $2,590 |
| #1 | 2 | 1 | $1,295 |
| #2 | 2 | 1 | $1,295 |
| Total (2 units) | $2,590 | ||
UW: 25.0% down · 7.5% · 30yr · 1.5% tax · 5.0% vac · 8.0% maint · 8.0% mgmt
Financing live
Cash to close
- Down payment
- $50,000
- Closing costs
- $6,000
- Reserves months
- —
- Total cash needed
- —
Loan-product check · same deal, 3 products live
Conventional
25% down · 7.5% · 30yr
- Down + closing
- —
- Monthly P&I
- —
- Monthly cashflow
- —
- DSCR
- —
- Eligible?
- —
Personal DTI + credit; lowest rate.
DSCR
20% down · 8.5% · 30yr
- Down + closing
- —
- Monthly P&I
- —
- Monthly cashflow
- —
- DSCR
- —
- Eligible?
- —
No personal income docs; deal must DSCR.
Hard money
10% down · 12.0% · 12mo
- Down + closing
- —
- Monthly P&I
- —
- Monthly cashflow
- —
- DSCR
- —
- Eligible?
- —
Short-term bridge; refi at stabilization.
Listing history 4 events
-
2026-06-18days on market $199,999 Active 3 DOM
-
2026-06-17days on market $199,999 Active 2 DOM
-
2026-06-15remarks 647-char remark
-
2026-06-15$199,999 Active 1 DOM
ⓘ Source: listings_history table (triggers on properties + properties_extension) + one-shot
backfill from property_details.listing_events for pre-trigger history.
Tax reassessment forecast PA · Partial reset (capped growth)
- Current annual tax
- $3,851 · $321/mo
- Projected year-2 tax
- $3,851 · $321/mo
- Expected delta
- $0/yr ($0/mo · -0.0%)
ⓘ Screening estimate from a state-policy table — verify with the county assessor before closing.
Climate risk First Street
- Flood 1/10 Low FEMA zone X (unshaded) · 0% chance over 30 yrs
- Wildfire 1/10 Low
- Heat 3/10 Moderate 7 d/yr ≥96°F today · 17 d/yr by 30 yrs out
- Wind 2/10 Low
- Air quality 2/10 Low 1 unhealthy d/yr today · 2 by 30 yrs out
Nearby sold comps map
Loading sold comps map…
Walkable amenities ~0.75 mi
Loading nearby amenities…
Taxation est. · year 1
- Rental income
- $31,080
- − Mortgage interest
- −$11,203
- − Property taxes
- −$3,851
- − Insurance
- −$1,000
- − Repairs & maintenance
- −$2,486
- − Management
- −$2,486
- − Depreciation
- −$5,818
- Taxable income
- $4,235
- Est. tax owed @ 24.0%
- −$1,017
- After-tax cash flow
- $6,100/yr
For passive investors: Depreciation is non-cash, so a rental often shows a tax loss while cash-flowing — sheltering income. Rental losses are passive: they offset passive income freely, and up to $25,000/yr can offset ordinary (W-2) income if you actively participate and your MAGI is under $100k (phasing out to $0 by $150k); unused losses carry forward. On sale, claimed depreciation is recaptured at up to 25%, and gains may owe capital-gains tax (a 1031 exchange can defer both). Figures are a year-1 estimate at your 24.0% rate — not tax advice; consult a CPA.
Schools (NCES district)
- District
- South Fayette Township SD
- NCES district ID
- 4220580
- Math proficiency
- 67% ▼ -9.00%
- Reading proficiency
- 85% ▼ -5.00%
- Median HH income
- $74,409
- Composite
- 66.61/100
- National rank
- #415
- State rank
- #12 of 539 in PA
Livability — South Fayette
No livability data for this city. (Only ~50 U.S. cities are tracked.)
Census & demographics
- Census place
- Sturgeon, PA
- Population (ZIP)
- 225
Population outlook (Allegheny County) Hauer SSP2
- Today (2025)
- 1,250,282 people
- By 2030
- 1,256,482 · +0.5%
- By 2040
- 1,256,318 · +0.5%
- By 2050
- 1,244,169 · -0.5%
- By 2075
- 1,197,693 · -4.2%
- By 2100
- 1,093,187 · -12.6%
Race, ethnicity, and origin ACS 2023
- Neighborhood character
- Predominantly White (100%)
- Race & ethnicity
- White 100%
- Common ancestry
- Romanian 9% English 5% Lithuanian 5%
Political lean MEDSL · Allegheny
- 2024 margin
- Strong D (+20.3) · D 59.7% · R 39.4%
- 2008→2024 swing
- +4.8pp toward D · 2008: 15.5pp · 2024: 20.3pp
- All cycles
- 2024: D+20.3 2020: D+20.4 2016: D+16.4 2012: D+14.4 2008: D+15.5
Not yet ingested
- Civics
- —
Market trends
- HPI YoY
- ▼ -2.62%
- Current HPI
- 225.916
- Rent YoY
- —
- Metro
- —
- State GDP YoY
- ▲ 1.68%
- F500 in state
- 34
Industry mix (Fortune 500 HQ in PA)
| Industry | F500 HQs | Revenue |
|---|---|---|
| Healthcare | 2 | $309B |
|
||
| Insurance | 2 | $27B |
|
||
| Telecommunications / Media | 1 | $124B |
|
||
| Industrial Distribution | 1 | $22B |
|
||
| Financial Services | 1 | $20B |
|
||
| Chemicals / Materials | 1 | $18B |
|
||
Price history
+73.9% since first listed11 events — show timeline
- 2026-06-15 Listed $199,999 West Penn MLS
- 2022-04-07 Pending — West Penn MLS
- 2022-04-06 Sold (MLS) $165,000 West Penn MLS
- 2022-02-10 Contingent — West Penn MLS
- 2022-02-10 Pending — West Penn MLS
- 2022-01-18 Listed $179,000 West Penn MLS
- 2015-12-06 Delisted — West Penn MLS
- 2015-11-21 Contingent — West Penn MLS
- 2015-11-05 Price Changed $98,900 West Penn MLS
- 2015-09-06 Price Changed $109,000 West Penn MLS
- 2015-07-27 Listed $115,000 West Penn MLS
Property tax history
+5.3%/yrLatest (2026): $3,851 · +2.6% YoY. Source: county tax records.
Cash-flow waterfall
monthlySold comps — $/sqft
last 12 mo · ≤1 miLoading sold comps…