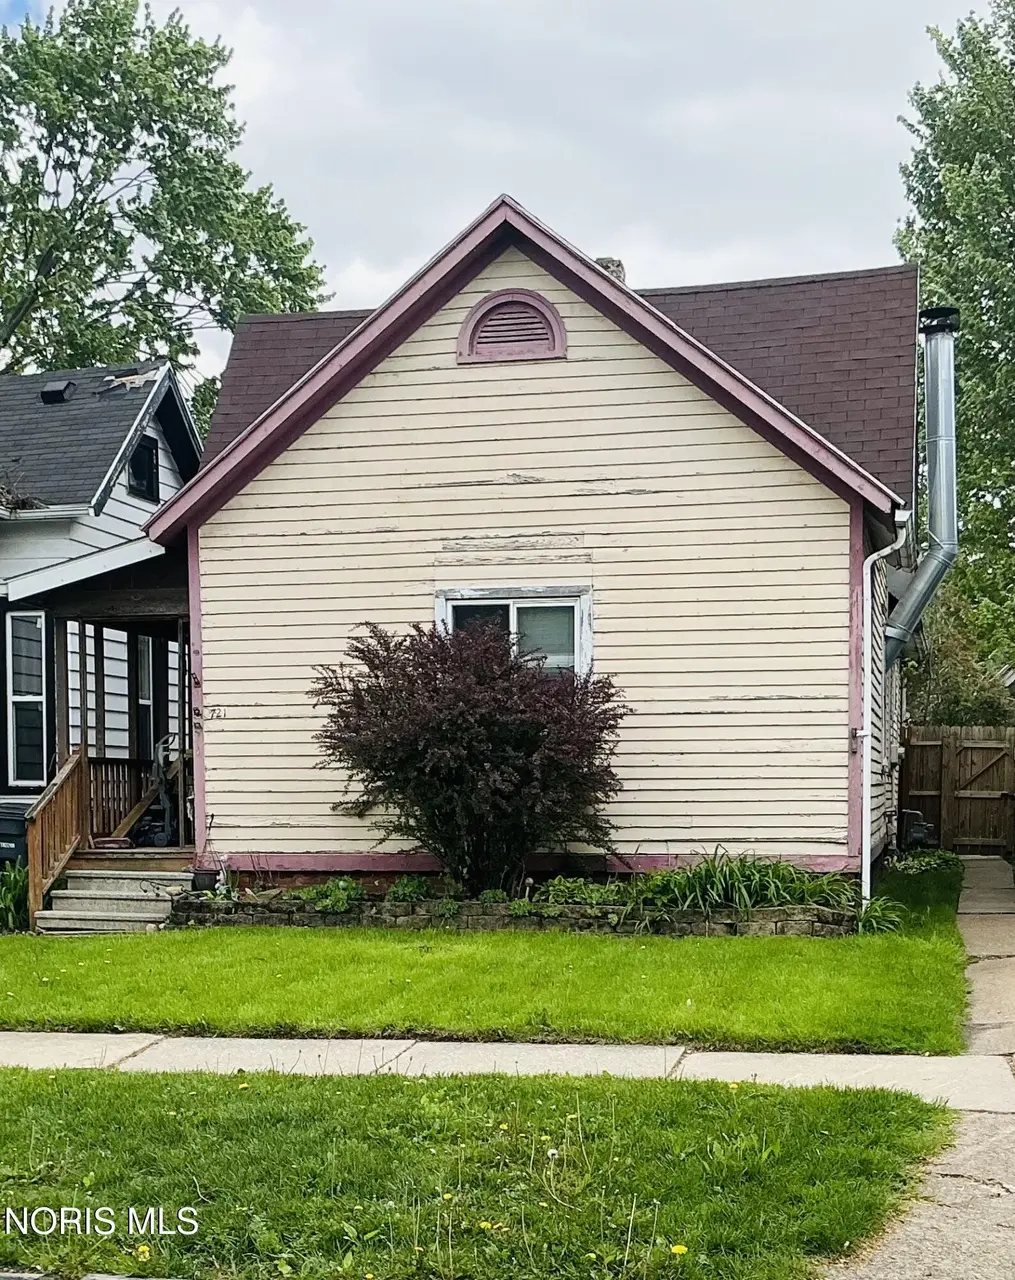
721 Thayer St · Toledo, OH
Flood risk 6/10 · Moderate
- FEMA flood zone
- X (unshaded)
- Chance of flooding over 30 yrs
- 0.68%
- Est. flood insurance / yr
- $507 – $1,088
Fire risk 1/10 · Minimal
- Est. fire insurance / yr
- $713 – $1,323
Heat risk 3/10 · Minor
- Hot days now (above 101°F)
- 7 days/yr
- Hot days in 30 yrs
- 16 days/yr
Wind risk 2/10 · Minimal
- Chance of severe wind over 30 yrs
- —
Air-quality risk 2/10 · Minimal
- Unhealthy air days now
- 1 days/yr
- Unhealthy air days in 30 yrs
- 2 days/yr
Risk factors via First Street. Map © Google.
Why this score? — see what drove the B- grade
The composite is a weighted blend of 9 inputs, each scored 0–100. Each bar is that input's sub-score; the figure is the points it added to the 100-point composite (weight × sub-score).
- Cash flow +30.0/30.0
- 1% rule +10.0/10.0
- DSCR +10.0/10.0
- Appreciation +5.4/10.0
- Rent growth +4.5/5.0
- Livability +3.3/5.0
- Condition / age +2.5/5.0
- Schools +1.6/10.0
- ARV discount +0.0/15.0
$51,500
🖨 Deal sheet 📄 Offer letter ✓ Due diligence
Listing remarks
Opportunity awaits at 721 Thayer St! This property is full of potential—perfect for an investor, rehabber, or buyer ready to build equity with the right amount of TLC. The home features a spacious living room with a cozy wood-burning fireplace, two bedrooms, dining room with a built-in wall buffet/bar and an eat-in kitchen. A 3-season enclosed back porch adds additional living space. The fenced backyard has an above-ground pool and hot tub. Ceiling fans throughout, window A/C units stay, appliances stay (including washer, dryer & freezer), workbenches in the 2-car detached garage and basement stay—ideal for storage or projects. Conveniently located near the Toledo Zoo, Wal
Key facts
- Hot tub
- Built in wall buffet
- Above ground pool
Tags
Property features AI
Exterior
- Parking: Detached 2-car garage; Alley access; Off-street parking
- Utilities: Electricity connected (circuit breakers); Natural gas connected; Public water; Public sewer; WiFi available
- Home design: Single-family house; One story
- Construction: Frame construction; Block foundation; Built (year per public records)
- Exterior features: Enclosed porch; Front porch; Rear porch; Wood fencing; Above-ground private pool; Shingle roof
Interior
- Kitchen: Refrigerator; Gas range connection; Eat-in kitchen
- Bedrooms: Bedroom 2 on the main level; Additional main-level bedrooms (sizes listed in rooms)
- Flooring: Carpet; Linoleum
- Bathrooms: 1 full bathroom
- Heating & cooling: Forced air heating (natural gas); Ceiling fans; Window air conditioning units
- Interior features: Eat-in kitchen; Spa/Hot Tub; Ceiling fans throughout; Screens on windows; Storm door(s); 1 fireplace in the living room; 6 total rooms
- Laundry & utility: Washer; Dryer; Washer hookup in basement; Gas dryer hookup; Water heater
Neighborhood map
What this means for you Summary
Snapshot
- This is a 3-bed/1.0-bath single-family listed at $52k.
Deal economics
- At list price, monthly cash flow is $398 ($5k/yr) — positive.
- The deal already cash-flows at list — no discount required.
- Meets the 1% rule at list price ($950 rent vs $52k).
- Recommended offer: $51k (1.5% below list) — sets the bar for market timing.
- Cap rate 15.6% vs local median 7.6% in Toledo — top-decile yield for the area; either an underpriced asset or a hidden risk that comps aren't pricing in. Stress-test before assuming the spread holds.
Location & tenants
- Location reads 66/100 on livability (#645 in OH) — a middle-class / working-renter tenant base. Strengths: cost of living A+, housing A+, health & safety A+; Watch: amenities C-, crime F, commute F.
- Toledo City (urban): math 15% / reading 24% proficiency, ranked #634 of 656 in OH (top 97%) — low school quality limits family demand, transient renter base, plan for 1-2y turnover; 72% free/reduced lunch — lower-income household profile, screen leases tightly.
- Zoned schools: Marshall Stemm Academy (math 2% / reading 8%, grade F, #1,554 of 1,584 statewide, top 100%, 374 students, 0% FRL); Waite High School (math 12% / reading 24%, grade F, #687 of 781 statewide, top 88%, 997 students, 0% FRL) — zoned schools average 0% FRL vs 72% district-wide (72 pts lower); this property's tenant base skews higher-income than the district average.
- Market conditions: Rents rising fast (+7.8%/yr); 99 active listings in the ZIP; 15 comparable units currently listed for rent nearby; rentals at typical pace (median 23d on market — plan ~3-4 weeks tenant-placement turnaround); 47% of comp listings sitting > 30 days — soft ceiling on asking rent; lower-income renter base — watch delinquency; 415 units permitted in Lucas County in 2024 (122 in 5+ unit buildings).
Forward outlook
- In year one you build about $742 of equity ($356 loan paydown + $386 appreciation (0.8% local appreciation)).
- Lucas County population projected at -16% by 2050 — secular population decline; favor cash flow + early exit over multi-decade hold.
- At projected returns (0.8% appreciation + 7.8% rent growth), your $14k cash investment doubles in ~3 years — after that, you're playing with house money.
Negotiation context
- It's been on market 18 days — a 2% lower offer ($51k) is reasonable based on typical stale-listing flexibility.
- Current owner paid $18k; list at $52k implies a 186% gain — meaningful room to come down on a strong offer.
Risks & watch-outs
- Watch-outs: built in 1887 — expect roof / HVAC / electrical / plumbing capex.
- Climate carrying-cost: major flood risk — expect insurance premiums to compound above CPI over the hold.
Questions for the listing agent
- Built in 1887 — when were the roof, HVAC, electrical panel, plumbing, and water heater last replaced?
- Is there a deadline driving the sale (1031 exchange, divorce, estate, relocation)? That informs how much negotiation room exists.
- Schools are D-rated, which usually means shorter tenancies and higher turnover. Who's the typical renter profile here, and what's been the actual vacancy rate?
- Crime grade is F in this area — have there been break-ins, vandalism, or insurance claims at this property in the last 3 years? What carrier currently insures it and at what premium?
- What's the average days-on-market for RENTAL listings here right now (not sales)? A rising rental-DOM trend means longer vacancies and softer asking-rent achievability than the comps imply.
- What's the recent tenant-quality profile in this submarket — average credit score on applications, eviction rate, late-payment / NSF rate, and stable-employment percentage? A property-management company in the area should have these aggregated.
- How much new for-sale + rental construction is in the pipeline within 1–3 miles? Heavy new supply typically softens prices + rents 12–24 months out; constrained supply supports both.
Investment metrics
- 1% rule
- 1.84% ✓
- Cap rate
- 15.57%
- Cash-on-cash
- 33.14%
- DSCR
- 2.47
- GRM
- 4.5
CMA / ARV
- ARV (median comp)
- $38,663
- List price
- $51,500
- Delta
- 33.20%
- Verdict
- OVERPRICED
- Comps
- 20 within 1.0 mi
Show comp detail 12 sales within ~0.75 mi
| Address | Dist | Beds/Ba | Sqft | Sold | Price | $/sf | Match |
|---|---|---|---|---|---|---|---|
| 837 Orchard St | 0.14mi | 3/1.0 | 1,224 (+2%) | 1mo | $19,000 | $16 | 91 |
| 1057 Harding Dr | 0.25mi | 3/2.0 | 1,184 (-2%) | 4mo | $98,500 | $83 | 78 |
| 1127 Harding Dr | 0.32mi | 3/1.0 | 1,104 (-8%) | 4mo | $22,000 | $20 | 68 |
| 445 Hiett Ave | 0.62mi | 3/1.0 | 1,144 (-5%) | 3mo | $33,000 | $29 | 60 |
| 511 Congress St | 0.45mi | 3/1.0 | 1,109 (-8%) | 6mo | $55,000 | $50 | 60 |
| 518 South Ave | 0.67mi | 3/1.0 | 1,255 (+4%) | 6mo | $64,000 | $51 | 57 |
| 1152 Colton St | 0.54mi | 3/1.0 | 1,046 (-13%) | 1mo | $65,000 | $62 | 52 |
| 837 Lorain St | 0.35mi | 3/2.0 | 1,380 (+14%) | 8mo | $75,000 | $54 | 49 |
| 634 Spencer St | 0.71mi | 4/1.0 (+1) | 1,294 (+7%) | 8mo | $85,000 | $66 | 44 |
| 1402 Prouty Ave | 0.68mi | 3/1.0 | 1,030 (-15%) | 1mo | $50,000 | $49 | 43 |
| 1022 Salem St | 0.72mi | 3/2.0 | 1,128 (-6%) | 11mo | $21,000 | $19 | 43 |
| 710 Western Ave | 0.66mi | 2/1.0 (-1) | 1,028 (-15%) | 8mo | $72,500 | $71 | 33 |
Match score weights: distance 35% · size 25% · config 20% · recency 20%. Top-matched comps best support the ARV.
Projected returns pro-forma
0.75% appreciation · 7.8% rent growth · sell at horizon
- IRR
- 39.5%
- Equity multiple
- 3.12×
- Total profit
- $30,519
- Equity at exit
- $16,913
- IRR
- 44.3%
- Equity multiple
- 7.24×
- Total profit
- $89,989
- Equity at exit
- $21,968
Cash invested: $14,420 (down + closing). Projections, not guarantees.
Landlord ↔ Tenant lean methodology
- Overall (STATE)
- 73 Landlord-Friendly
- State Ohio
- 73 Landlord-Friendly · R+6
- County
- — inherits STATE
- City
- — inherits STATE
ZIP-level market 43609
- Home prices YoY
- 0.3%
- Rents YoY
- 7.8%
- Active inventory
- 99
- Price-to-rent
- 4.5×
Monthly cashflow live
- Estimated rent
- $950 high interval (Pro) →
- Mortgage (P&I)
- −$270
- Tax from tax record
- −$61 /mo · $729/yr
- Insurance
- −$21
- HOA
- −$0
- Vacancy / Maint / Mgmt
- −$199
- Net cashflow
- $398
Break-even live
UW: 25.0% down · 7.5% · 30yr · 1.5% tax · 5.0% vac · 8.0% maint · 8.0% mgmt
Financing live
Cash to close
- Down payment
- $12,875
- Closing costs
- $1,545
- Reserves months
- —
- Total cash needed
- —
Loan-product check · same deal, 3 products live
Conventional
25% down · 7.5% · 30yr
- Down + closing
- —
- Monthly P&I
- —
- Monthly cashflow
- —
- DSCR
- —
- Eligible?
- —
Personal DTI + credit; lowest rate.
DSCR
20% down · 8.5% · 30yr
- Down + closing
- —
- Monthly P&I
- —
- Monthly cashflow
- —
- DSCR
- —
- Eligible?
- —
No personal income docs; deal must DSCR.
Hard money
10% down · 12.0% · 12mo
- Down + closing
- —
- Monthly P&I
- —
- Monthly cashflow
- —
- DSCR
- —
- Eligible?
- —
Short-term bridge; refi at stabilization.
Rent comps 15 comps
| Address | Beds | Baths | Sqft | Rent | $/sqft | DOM | Units | Dist |
|---|---|---|---|---|---|---|---|---|
| 771 Orchard St Unit 7715 Toledo, OH | 2.0 | 1.0 | 1086 | $645 | $0.59 | 23d | 1 | 0.20mi |
| 837 Colburn St Unit 2 Toledo, OH | 2.0 | 1.0 | 1158 | $695 | $0.60 | 23d | 1 | 0.27mi |
| 837 Colburn St Unit 1 Toledo, OH | 2.0 | 1.0 | 1178 | $700 | $0.59 | 43d | 1 | 0.27mi |
| 827 Colburn St Toledo, OH | 2.0 | 1.0 | 1092 | $750 | $0.69 | 43d | 1 | 0.28mi |
| 2424 Broadway St Toledo, OH | 3.0 | 1.0 | 1416 | $1,049 | $0.74 | 13d | 1 | 0.54mi |
| 1418 Colburn St Toledo, OH | 3.0 | 1.0 | 992 | $1,200 | $1.21 | 13d | 1 | 0.74mi |
| 1321 Gordon St Toledo, OH | 3.0 | 1.0 | 1121 | $1,050 | $0.94 | 43d | 1 | 0.78mi |
| 724 Spencer St Toledo, OH | 3.0 | 1.5 | 1127 | $1,100 | $0.98 | 43d | 1 | 0.81mi |
| 2594 Broadway St Toledo, OH | 2.0 | 1.0 | 1076 | $825 | $0.77 | 43d | 1 | 0.88mi |
| 705 Nicholas St Toledo, OH | 2.0 | 1.0 | 1037 | $900 | $0.87 | 43d | 1 | 0.89mi |
| 532 Carlton St Toledo, OH | 3.0 | 1.0 | 1130 | $1,050 | $0.93 | 43d | 1 | 0.89mi |
| 244 Knower St Toledo, OH | 3.0 | 1.0 | 1120 | $995 | $0.89 | 13d | 1 | 0.91mi |
| 523 Nicholas St Toledo, OH | 3.0 | 1.0 | 1290 | $1,350 | $1.05 | 13d | 1 | 0.92mi |
| 1734 Arlington Ave Toledo, OH | 2.0 | 1.0 | 700 | $800 | $1.14 | 13d | 1 | 1.21mi |
| 337 Broadway St Unit 201 Toledo, OH | 2.0 | 1.0 | 1455 | $1,650 | $1.13 | 23d | 1 | 1.42mi |
Listing history 3 events
-
2026-04-29$51,500 Active 1007-char remark
-
1988-05-27soldstatus $18,000
-
1980-01-24soldstatus $9,500
ⓘ Source: listings_history table (triggers on properties + properties_extension) + one-shot
backfill from property_details.listing_events for pre-trigger history.
Tax reassessment forecast OH · Partial reset (capped growth)
- Current annual tax
- $729 · $61/mo
- Projected year-2 tax
- $766 · $64/mo
- Expected delta
- +$37/yr (+$3/mo · 5.1%)
ⓘ Screening estimate from a state-policy table — verify with the county assessor before closing.
Climate risk First Street
- Flood 6/10 Major FEMA zone X (unshaded) · 68% chance over 30 yrs
- Wildfire 1/10 Low
- Heat 3/10 Moderate 7 d/yr ≥101°F today · 16 d/yr by 30 yrs out
- Wind 2/10 Low
- Air quality 2/10 Low 1 unhealthy d/yr today · 2 by 30 yrs out
Nearby sold comps map
Loading sold comps map…
Walkable amenities ~0.75 mi
Loading nearby amenities…
Taxation est. · year 1
- Rental income
- $11,400
- − Mortgage interest
- −$2,885
- − Property taxes
- −$729
- − Insurance
- −$258
- − Repairs & maintenance
- −$912
- − Management
- −$912
- − Depreciation
- −$1,498
- Taxable income
- $4,206
- Est. tax owed @ 24.0%
- −$1,010
- After-tax cash flow
- $3,769/yr
For passive investors: Depreciation is non-cash, so a rental often shows a tax loss while cash-flowing — sheltering income. Rental losses are passive: they offset passive income freely, and up to $25,000/yr can offset ordinary (W-2) income if you actively participate and your MAGI is under $100k (phasing out to $0 by $150k); unused losses carry forward. On sale, claimed depreciation is recaptured at up to 25%, and gains may owe capital-gains tax (a 1031 exchange can defer both). Figures are a year-1 estimate at your 24.0% rate — not tax advice; consult a CPA.
Schools (NCES district)
- District
- Toledo City
- NCES district ID
- 3904490
- Math proficiency
- 15% ▼ -16.00%
- Reading proficiency
- 24% ▼ -13.00%
- Median HH income
- $32,137
- Composite
- 15.76/100
- National rank
- #9276
- State rank
- #634 of 656 in OH
Livability — Toledo
- Score
- 66/100
- State rank
- #645
- US rank
- #11442
Category grades
Schools grade is shown separately in the Schools card above.
Census & demographics
- Census place
- Toledo, OH
- County
- Lucas County · 380,724 people
- City population
- 280,811
- Metro
- Toledo, OH
- Population (ZIP)
- 21,404
- Household income
- $42,313
- Rent vs Own
- Severe rent burden
- 1603.0
Population outlook (Lucas County) Hauer SSP2
- Today (2025)
- 420,751 people
- By 2030
- 410,187 · -2.5%
- By 2040
- 384,019 · -8.7%
- By 2050
- 355,125 · -15.6%
- By 2075
- 291,683 · -30.7%
- By 2100
- 233,670 · -44.5%
Race, ethnicity, and origin ACS 2023
- Neighborhood character
- Diverse neighborhood (Simpson 0.66)
- Race & ethnicity
- White 47% Black 29% Hispanic / Latino 17% Two or more races 9%
- Hispanic origin (detail)
- Mexican 15%
- Common ancestry
- Romanian 5% Lithuanian 2% Italian 1%
- Foreign-born
- 4% · Canada, China
- Languages at home
- 92% English-only · Spanish 5% Arabic 1% French/Haitian/Cajun 1%
Political lean MEDSL · Lucas
- 2024 margin
- D (+12.6) · D 55.8% · R 43.2%
- 2008→2024 swing
- -18.9pp toward R · 2008: 31.4pp · 2024: 12.6pp
- All cycles
- 2024: D+12.6 2020: D+16.8 2016: D+17.4 2012: D+30.4 2008: D+31.4
Not yet ingested
- Civics
- —
Market trends
- HPI YoY
- ▲ 0.75%
- Current HPI
- 235.2515
- Rent YoY
- ▲ 7.80%
- Metro
- Toledo, OH
- State GDP YoY
- ▲ 1.98%
- F500 in state
- 48
Industry mix (Fortune 500 HQ in OH)
| Industry | F500 HQs | Revenue |
|---|---|---|
| Insurance | 3 | $145B |
|
||
| Industrial Machinery | 3 | $49B |
|
||
| Financial Services | 3 | $24B |
|
||
| Consumer Goods | 2 | $93B |
|
||
| Aerospace / Defense | 2 | $47B |
|
||
| Utilities | 2 | $33B |
|
||
Price history
+442.1% since first listed4 events — show timeline
- 2026-05-19 Pending — NORIS
- 2026-04-29 Listed $51,500 NORIS
- 1988-05-27 Sold (Public Records) $18,000 Public Records
- 1980-01-24 Sold (Public Records) $9,500 Public Records
Property tax history
+1.7%/yrLatest (2025): $729 · +4.1% YoY. Source: county tax records.
Cash-flow waterfall
monthlySold comps — $/sqft
last 12 mo · ≤1 miLoading sold comps…