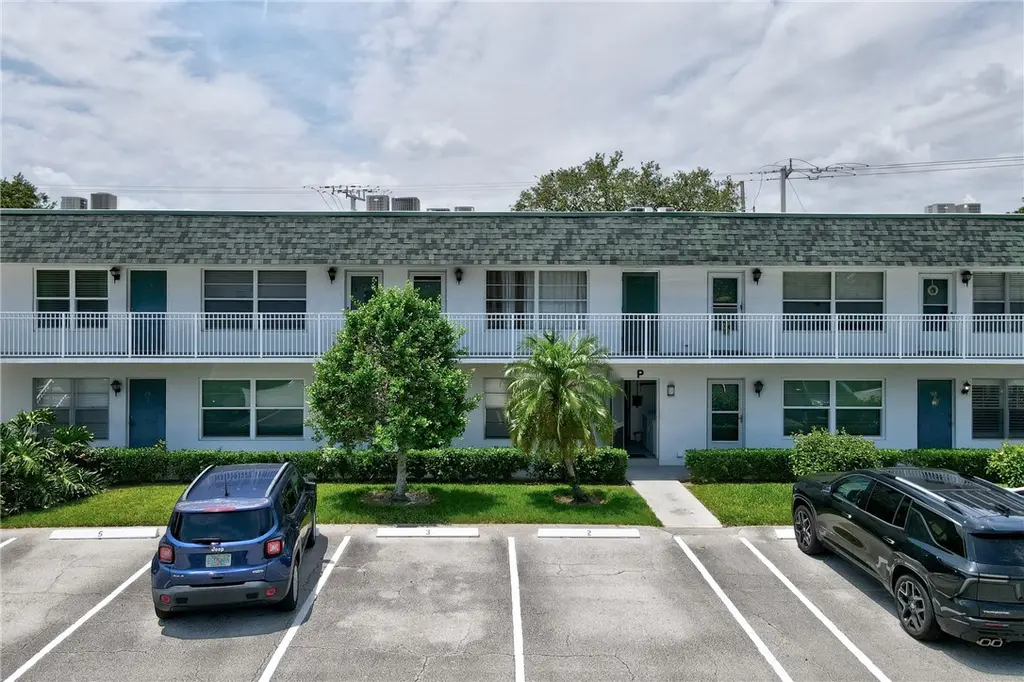
2800 Indian River Blvd Unit P3 · Vero Beach, FL
Flood risk 9/10 · Severe
- FEMA flood zone
- X (shaded)
- Chance of flooding over 30 yrs
- 0.99%
- Est. flood insurance / yr
- $507 – $1,088
Fire risk 3/10 · Minor
- Est. fire insurance / yr
- $947 – $1,759
Heat risk 10/10 · Severe
- Hot days now (above 105°F)
- 7 days/yr
- Hot days in 30 yrs
- 23 days/yr
Wind risk 10/10 · Severe
- Chance of severe wind over 30 yrs
- 99.0%
Air-quality risk 1/10 · Minimal
- Unhealthy air days now
- 0 days/yr
- Unhealthy air days in 30 yrs
- 0 days/yr
Risk factors via First Street. Map © Google.
Why this score? — see what drove the B- grade
The composite is a weighted blend of 9 inputs, each scored 0–100. Each bar is that input's sub-score; the figure is the points it added to the 100-point composite (weight × sub-score).
- Cash flow +20.5/30.0
- ARV discount +15.0/15.0
- 1% rule +10.0/10.0
- DSCR +6.5/10.0
- Schools +4.2/10.0
- Livability +4.0/5.0
- Condition / age +4.0/5.0
- Rent growth +2.1/5.0
- Appreciation +0.0/10.0
$98,000
🖨 Deal sheet 📄 Offer letter ✓ Due diligence
Listing remarks
Vero Beach lifestyle meets easy living! This ground-floor 1BR/1.5BA garden-style condo is offered turn-key and ready for immediate enjoyment. Ideal for seasonal living, a vacation retreat, or downsizing. Granite counters highlight the kitchen, while tile flooring runs through the main living area and enclosed patio. Rarely found condo storage includes two large walk-in closets, linen closet, and private storage locker. Community amenities include clubhouse, community pool, and shuffle ball courts. 2 miles to the nearest beach access, with shops and restaurants even closer.
Key facts
- Ground-floor
- Walk-in closets
- Tile flooring
Tags
Property features AI
Finance
- Other: Property has a view
- Financial info: Pets not allowed
- HOA & community: Keystone Property Mngmt association; Monthly association fee of $463.12; Association covers insurance, ground and structure maintenance, recreation facilities, reserve fund, and trash; Community amenities include clubhouse, shuffleboard, and pool; Senior community
Exterior
- Parking: Assigned uncovered parking
- Utilities: Public water; Public sewer
- Home design: 2-story building; Faces east; Has attached property
- Construction: Block and concrete construction; Metal and rolled/hot mop roof
- Exterior features: Enclosed porch; Porch; Community pool
Interior
- Kitchen: Refrigerator; Range; Microwave; Disposal; Electric water heater
- Bedrooms: Bedroom (12 x 12)
- Flooring: Carpet; Tile
- Bathrooms: 1 full bathroom; 1 half bathroom
- Heating & cooling: Central heating; Central air conditioning
- Interior features: Furnished; Jalousie windows with window treatments; Carpet and tile flooring
- Laundry & utility: Laundry located in common area
Neighborhood map
What this means for you Summary
Snapshot
- This is a 1-bed/1.5-bath townhouse listed at $98k. Condition is rated good.
Deal economics
- At list price, monthly cash flow is $63 ($753/yr) — positive.
- The deal already cash-flows at list — no discount required.
- Meets the 1% rule at list price ($2k rent vs $98k).
- Recommended offer: $95k (3.0% below list) — sets the bar for market timing.
- Cap rate 7.9% vs local median 2.9% in Vero Beach — top-decile yield for the area; either an underpriced asset or a hidden risk that comps aren't pricing in. Stress-test before assuming the spread holds.
Location & tenants
- Location reads 80/100 on livability (#116 in FL, #1,784 nationally) — a professional / high-income tenant draw. Strengths: crime A+, commute A+, health & safety A+; Watch: employment D+, amenities D.
- Indian River (other): math 48% / reading 52% proficiency, ranked #35 of 73 in FL (top 48%) — acceptable for families but not a draw, mixed tenant base, ~2y average lease.
- Market conditions: Rents soft (-1.7%/yr); 206 active listings in the ZIP; 11 comparable units currently listed for rent nearby; rentals leasing fast (median 14d on market — plan ~1-2 weeks tenant-placement turnaround); 564 units permitted in Indian River County in 2024 (281 in 5+ unit buildings).
- This rent runs 35% of the median local income ($55k/yr) — at the standard rent-burdened threshold; future hikes will face affordability resistance.
Forward outlook
- Local home prices are declining (-3.0%/yr); year-one equity from $678 of loan paydown is wiped out by about $3k of value loss. Plan a longer hold.
- Indian River County population projected at +18% by 2050 — long-run rental-demand tailwind backs the buy-and-hold thesis.
Negotiation context
- It's been on market 43 days — a 3% lower offer ($95k) is reasonable based on typical stale-listing flexibility.
Risks & watch-outs
- Watch-outs: flood insurance adds $66/mo; HOA is 29% of rent.
- Climate carrying-cost: severe flood risk; severe wind risk, 99% chance of damaging wind over 30y; extreme-heat days projected 7→23/yr by 2055 (HVAC capex compounding) — expect insurance premiums to compound above CPI over the hold.
Questions for the listing agent
- It's been on market 43 days. Have you received any prior offers? Is the seller open to a 3% concession, seller financing, or rate buy-down credit?
- Built in 1971 — when were the roof, HVAC, electrical panel, plumbing, and water heater last replaced?
- What's the actual annual flood-insurance premium (NFIP or private), and is the property in a SFHA with mandatory coverage?
- What does the HOA fee cover, when was the last increase, and are there any pending special assessments or reserve-fund shortfalls?
- Is there a deadline driving the sale (1031 exchange, divorce, estate, relocation)? That informs how much negotiation room exists.
- What's the average days-on-market for RENTAL listings here right now (not sales)? A rising rental-DOM trend means longer vacancies and softer asking-rent achievability than the comps imply.
- What's the recent tenant-quality profile in this submarket — average credit score on applications, eviction rate, late-payment / NSF rate, and stable-employment percentage? A property-management company in the area should have these aggregated.
- How much new for-sale + rental construction is in the pipeline within 1–3 miles? Heavy new supply typically softens prices + rents 12–24 months out; constrained supply supports both.
Investment metrics
- 1% rule
- 1.64% ✓
- Cap rate
- 7.87%
- Cash-on-cash
- 5.65%
- DSCR
- 1.25
- GRM
- 5.1
CMA / ARV
- ARV (on-the-fly)
- $125,100
- Comps found
- 12
Show comp detail 12 sales within ~0.75 mi
| Address | Dist | Beds/Ba | Sqft | Sold | Price | $/sf | Match |
|---|---|---|---|---|---|---|---|
| 2800 Indian River Blvd Unit M7 | 0.00mi | 1/1.5 | 695 (0%) | 2mo | $110,000 | $158 | 98 |
| 2800 Indian River Blvd Unit 8F | 0.00mi | 1/1.5 | 695 (0%) | 3mo | $165,000 | $237 | 98 |
| 2800 Indian River Blvd Unit 2q | 0.00mi | 1/1.5 | 695 (0%) | 3mo | $76,000 | $109 | 98 |
| 2800 Indian River Blvd Unit L4 | 0.02mi | 1/1.5 | 695 (0%) | 4mo | $135,000 | $194 | 96 |
| 2800 Indian River Blvd Unit 7N | 0.00mi | 1/1.5 | 695 (0%) | 6mo | $80,000 | $115 | 95 |
| 2800 Indian River Blvd Unit L8 | 0.00mi | 1/1.5 | 695 (0%) | 6mo | $98,000 | $141 | 95 |
| 2800 Indian River Blvd Unit L2 | 0.00mi | 1/1.0 | 695 (0%) | 4mo | $125,000 | $180 | 94 |
| 2800 Indian River Blvd Unit 7t | 0.00mi | 1/1.5 | 695 (0%) | 9mo | $140,500 | $202 | 93 |
| 2800 Indian River Blvd Unit 2f | 0.00mi | 1/1.5 | 695 (0%) | 20mo | $159,000 | $229 | 84 |
| 2800 Indian River Blvd Unit O7 | 0.00mi | 1/1.5 | 695 (0%) | 22mo | $205,000 | $295 | 82 |
| 677 Royal Palm Blvd #6 | 0.59mi | 1/1.0 | 700 (+1%) | 1mo | $120,000 | $171 | 69 |
| 2333 Indian River Blvd #601 | 0.44mi | 1/1.0 | 624 (-10%) | 3mo | $93,500 | $150 | 58 |
Match score weights: distance 35% · size 25% · config 20% · recency 20%. Top-matched comps best support the ARV.
Projected returns pro-forma
-3.0% appreciation · 0.0% rent growth · sell at horizon
- IRR
- -17.6%
- Equity multiple
- 0.41×
- Total profit
- $-16,245
- Equity at exit
- $14,612
- IRR
- -25.8%
- Equity multiple
- 0.06×
- Total profit
- $-25,782
- Equity at exit
- $8,473
Cash invested: $27,440 (down + closing). Projections, not guarantees.
Landlord ↔ Tenant lean methodology
- Overall (STATE)
- 87 Strongly Landlord-Friendly
- State Florida
- 87 Strongly Landlord-Friendly · R+3
- County
- — inherits STATE
- City
- — inherits STATE
ZIP-level market 32960
- Home prices YoY
- -25.5%
- Rents YoY
- -1.7%
- Active inventory
- 206
- Price-to-rent
- 5.1×
Monthly cashflow live
- Estimated rent
- $1,607 high interval (Pro) →
- Mortgage (P&I)
- −$514
- Tax est. 1.5%
- −$122 /mo · $1,470/yr
- Insurance
- −$41
- Flood insurance flood zone
- −$66 /mo · $798/yr
- HOA
- −$463
- Vacancy / Maint / Mgmt
- −$337
- Net cashflow
- $63
Break-even live
UW: 25.0% down · 7.5% · 30yr · 1.5% tax · 5.0% vac · 8.0% maint · 8.0% mgmt
Financing live
Cash to close
- Down payment
- $24,500
- Closing costs
- $2,940
- Reserves months
- —
- Total cash needed
- —
Loan-product check · same deal, 3 products live
Conventional
25% down · 7.5% · 30yr
- Down + closing
- —
- Monthly P&I
- —
- Monthly cashflow
- —
- DSCR
- —
- Eligible?
- —
Personal DTI + credit; lowest rate.
DSCR
20% down · 8.5% · 30yr
- Down + closing
- —
- Monthly P&I
- —
- Monthly cashflow
- —
- DSCR
- —
- Eligible?
- —
No personal income docs; deal must DSCR.
Hard money
10% down · 12.0% · 12mo
- Down + closing
- —
- Monthly P&I
- —
- Monthly cashflow
- —
- DSCR
- —
- Eligible?
- —
Short-term bridge; refi at stabilization.
Rent comps 11 comps
| Address | Beds | Baths | Sqft | Rent | $/sqft | DOM | Units | Dist |
|---|---|---|---|---|---|---|---|---|
| 2800 Indian River Blvd Vero Beach, FL | 1.0–2.0 | 1.5–2.0 | 847 | $1,400 | $1.65 | 13d | 5 | 0.03mi |
| 819 26th St Vero Beach, FL | 1.0 | 1.0 | 474 | $1,400 | $2.95 | 13d | 1 | 0.64mi |
| 715 19th Pl Vero Beach, FL | 1.0–2.0 | 1.0–2.0 | 600 | $1,645 | $2.74 | 13d | 7 | 0.90mi |
| 1825 Cobia Dr Unit 103H Vero Beach, FL | 1.0 | 1.0 | 650 | $2,400 | $3.69 | 13d | 1 | 0.91mi |
| 1830 Robalo Dr Apt B103 Vero Beach, FL | 1.0 | 1.0 | 650 | $2,100 | $3.23 | 13d | 1 | 0.91mi |
| 1815 Robalo Dr Unit C201 Vero Beach, FL | 1.0 | 1.0 | 650 | $1,700 | $2.62 | 13d | 1 | 0.92mi |
| 2359 De Soto Ave Vero Beach, FL | 1.0 | 1.0 | 570 | $1,500 | $2.63 | 21d | 1 | 1.06mi |
| 615 Azalea Ln Unit 4 Vero Beach, FL | — | 1.0 | 350 | $1,650 | $4.71 | 13d | 1 | 1.13mi |
| 854 Bougainvillea Ln Unit 3 Vero Beach, FL | 1.0 | 1.0 | 650 | $2,150 | $3.31 | 13d | 1 | 1.38mi |
| 854 Bougainvillea Ln Unit 3 Vero Beach, FL | 1.0 | 1.0 | 650 | $2,250 | $3.46 | 21d | 1 | 1.38mi |
| 3850 11th Dr Vero Beach, FL | 1.0–3.0 | 1.0–2.0 | 1029 | $1,799 | $1.75 | 13d | 57 | 1.39mi |
HOA detail
- Monthly dues
- $463 · $5,556/yr
- Likely covers
- pool
Listing history 17 events
-
2026-06-19days on market $98,000 Active 43 DOM
-
2026-06-18days on market $98,000 Active 42 DOM
-
2026-06-17days on market $98,000 Active 41 DOM
-
2026-06-16days on market $98,000 Active 40 DOM
-
2026-06-15days on market $98,000 Active 39 DOM
-
2026-06-14days on market $98,000 Active 37 DOM
-
2026-06-13days on market $98,000 Active 36 DOM
-
2026-06-10days on market $98,000 Active 34 DOM
-
2026-06-09days on market $98,000 Active 33 DOM
-
2026-06-08days on market $98,000 Active 32 DOM
-
2026-06-07days on market $98,000 Active 31 DOM
-
2026-06-05days on market $98,000 Active 28 DOM
-
2026-06-02days on market $98,000 Active 26 DOM
-
2026-06-01days on market $98,000 Active 25 DOM
-
2026-05-31days on market $98,000 Active 24 DOM
-
2026-05-30days on market $98,000 Active 23 DOM
-
2026-05-07$98,000 Active
ⓘ Source: listings_history table (triggers on properties + properties_extension) + one-shot
backfill from property_details.listing_events for pre-trigger history.
Climate risk First Street
- Flood 9/10 Extreme FEMA zone X (shaded) · 99% chance over 30 yrs
- Wildfire 3/10 Moderate
- Heat 10/10 Extreme 7 d/yr ≥105°F today · 23 d/yr by 30 yrs out
- Wind 10/10 Extreme 99% chance of damaging wind over 30 yrs
- Air quality 1/10 Low 0 unhealthy d/yr today · 0 by 30 yrs out
Nearby sold comps map
Loading sold comps map…
Walkable amenities ~0.75 mi
Loading nearby amenities…
Taxation est. · year 1
- Rental income
- $19,282
- − Mortgage interest
- −$5,490
- − Property taxes
- −$1,470
- − Insurance
- −$1,288
- − Repairs & maintenance
- −$1,543
- − Management
- −$1,543
- − HOA
- −$5,556
- − Depreciation
- −$2,851
- Taxable loss
- −$457
- Est. tax savings @ 24.0%
- +$110
- After-tax cash flow
- $862/yr
For passive investors: Depreciation is non-cash, so a rental often shows a tax loss while cash-flowing — sheltering income. Rental losses are passive: they offset passive income freely, and up to $25,000/yr can offset ordinary (W-2) income if you actively participate and your MAGI is under $100k (phasing out to $0 by $150k); unused losses carry forward. On sale, claimed depreciation is recaptured at up to 25%, and gains may owe capital-gains tax (a 1031 exchange can defer both). Figures are a year-1 estimate at your 24.0% rate — not tax advice; consult a CPA.
Condition & rehab AI · 12 photos
This ground-floor 1BR/1.5BA garden-style condo is in good condition with minimal repairs needed. Painting and landscaping improvements would significantly enhance its curb appeal and value.
Value-add opportunities
- Both Painting (interior and exterior) — Fresh paint enhances curb appeal and interior aesthetics
- Both Landscaping improvements — Enhances curb appeal and adds value
- Both New flooring (kitchen and bathrooms) — Modern flooring improves aesthetics and functionality
- Both New kitchen appliances — Upgrades kitchen appliances add value and functionality
- Both New bathroom fixtures — Modern fixtures enhance bathroom aesthetics and functionality
Renovation cost estimate screening
Value-add ROI direction
- Both Painting (interior and exterior) — Fresh paint enhances curb appeal and interior aesthetics ↑
- Both Landscaping improvements — Enhances curb appeal and adds value ↑
- Both New flooring (kitchen and bathrooms) — Modern flooring improves aesthetics and functionality ↑
- Both New kitchen appliances — Upgrades kitchen appliances add value and functionality ↑
- Both New bathroom fixtures — Modern fixtures enhance bathroom aesthetics and functionality ↑
ⓘ Cost ranges are severity-bucket heuristics (US national rule-of-thumb). Get contractor quotes + a written scope before underwriting a rehab budget.
Schools (NCES district)
- District
- Indian River
- NCES district ID
- 1200930
- Math proficiency
- 48% ▼ -9.00%
- Reading proficiency
- 52% ▼ -3.00%
- Median HH income
- $46,597
- Composite
- 42.45/100
- National rank
- #3218
- State rank
- #35 of 73 in FL
Livability — Vero Beach
- Score
- 80/100
- State rank
- #116
- US rank
- #1784
Category grades
Schools grade is shown separately in the Schools card above.
Census & demographics
- Census place
- Vero Beach, FL
- County
- Indian River County · 143,738 people
- City population
- 98,707
- Metro
- Sebastian-Vero Beach, FL
- Population (ZIP)
- 25,259
- Household income
- $54,682
- Rent vs Own
- Severe rent burden
- 1166.0
Population outlook (Indian River County) Hauer SSP2
- Today (2025)
- 165,104 people
- By 2030
- 172,869 · +4.7%
- By 2040
- 185,640 · +12.4%
- By 2050
- 194,465 · +17.8%
- By 2075
- 211,115 · +27.9%
- By 2100
- 211,781 · +28.3%
Race, ethnicity, and origin ACS 2023
- Neighborhood character
- Majority White (65%)
- Race & ethnicity
- White 65% Hispanic / Latino 16% Two or more races 12% Black 10% Asian 4% Native American 1%
- Hispanic origin (detail)
- Mexican 6% Puerto Rican 3% Cuban 2%
- Common ancestry
- Italian 4% Slovak 3% Romanian 3%
- Foreign-born
- 11% · Canada, Jamaica, Vietnam
- Languages at home
- 82% English-only · Spanish 13% French/Haitian/Cajun 2% Other Asian/Pacific 1%
Political lean MEDSL · Indian River
- 2024 margin
- Strong R (+27.4) · D 36.0% · R 63.4%
- 2008→2024 swing
- -12.5pp toward R · 2008: -14.8pp · 2024: -27.4pp
- All cycles
- 2024: R+27.4 2020: R+21.6 2016: R+24.5 2012: R+22.3 2008: R+14.8
Not yet ingested
- Civics
- —
Market trends
- HPI YoY
- ▼ -103.20%
- Current HPI
- 302.0029
- Rent YoY
- ▼ -1.66%
- Metro
- Sebastian-Vero Beach, FL
- State GDP YoY
- ▲ 3.28%
- F500 in state
- 36
Industry mix (Fortune 500 HQ in FL)
| Industry | F500 HQs | Revenue |
|---|---|---|
| Industrial Technology | 2 | $29B |
|
||
| Insurance | 2 | $17B |
|
||
| Retail | 1 | $60B |
|
||
| Technology Distribution | 1 | $58B |
|
||
| Homebuilding | 1 | $35B |
|
||
| Technology Manufacturing | 1 | $35B |
|
||
Price history
1 event — show timeline
- 2026-05-07 Listed $98,000 RAIRCMLS
Cash-flow waterfall
monthlySold comps — $/sqft
last 12 mo · ≤1 miLoading sold comps…