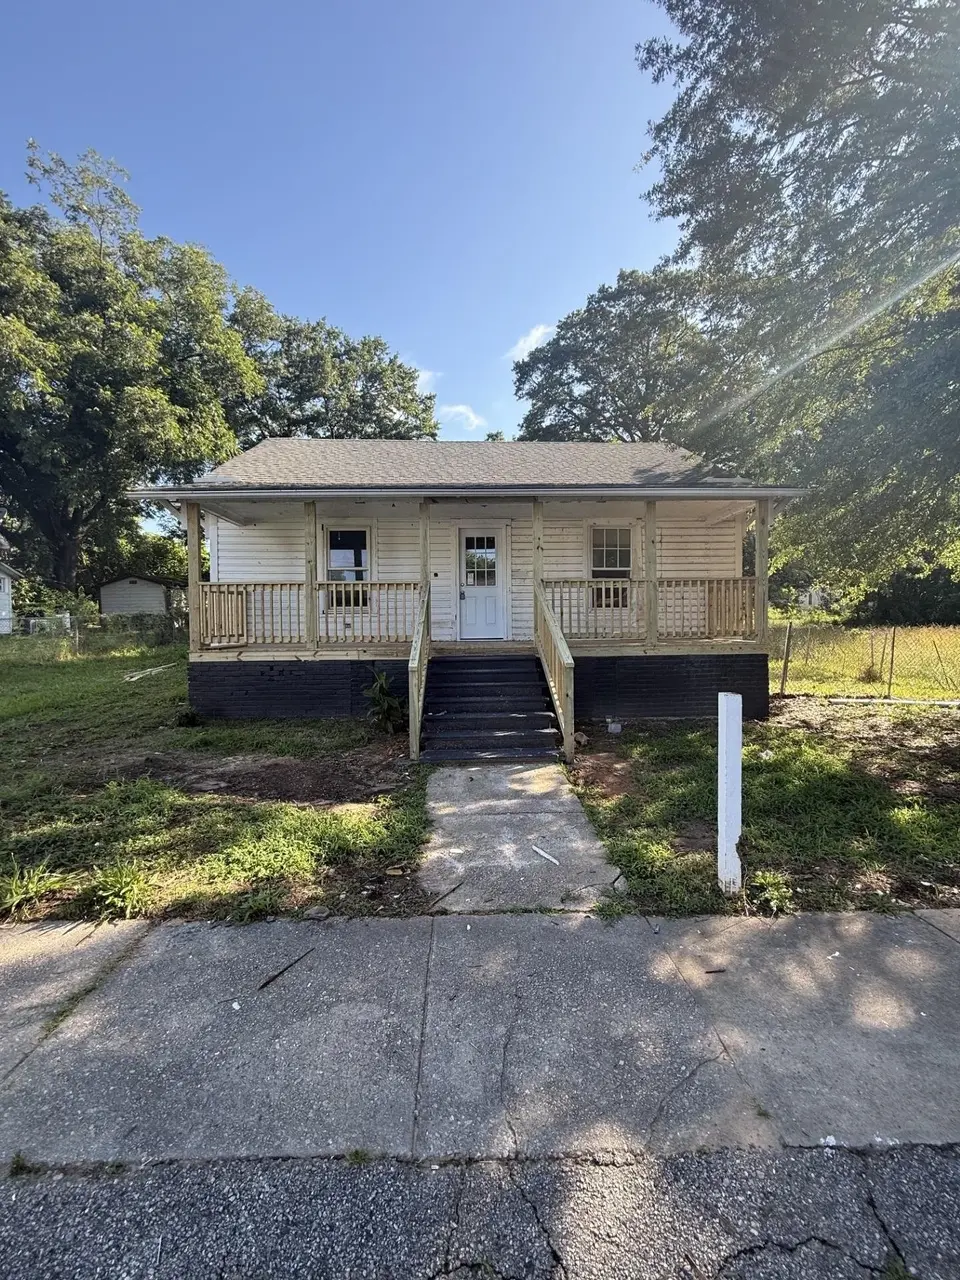
267 Beason St · Woodruff, SC
Flood risk 1/10 · Minimal
- FEMA flood zone
- X (unshaded)
- Chance of flooding over 30 yrs
- 0.0%
- Est. flood insurance / yr
- $507 – $1,088
Fire risk 3/10 · Minor
- Est. fire insurance / yr
- $783 – $1,453
Heat risk 6/10 · Moderate
- Hot days now (above 105°F)
- 7 days/yr
- Hot days in 30 yrs
- 16 days/yr
Wind risk 2/10 · Minimal
- Chance of severe wind over 30 yrs
- 3.0%
Air-quality risk 3/10 · Minor
- Unhealthy air days now
- 2 days/yr
- Unhealthy air days in 30 yrs
- 3 days/yr
Risk factors via First Street. Map © Google.
Why this score? — see what drove the B+ grade
The composite is a weighted blend of 9 inputs, each scored 0–100. Each bar is that input's sub-score; the figure is the points it added to the 100-point composite (weight × sub-score).
- Cash flow +30.0/30.0
- ARV discount +15.0/15.0
- 1% rule +10.0/10.0
- DSCR +10.0/10.0
- Schools +3.8/10.0
- Livability +3.2/5.0
- Rent growth +2.5/5.0
- Condition / age +2.5/5.0
- Appreciation +0.0/10.0
$69,900
🖨 Deal sheet 📄 Offer letter ✓ Due diligence
Listing remarks
267 Beason Street in Woodruff is a great opportunity for investors, flippers, or buyers looking to add their own touch. This 2-bedroom, 1-bath handyman special features a brand-new roof, new front porch, and new exterior doors, providing a solid start for renovations. Situated on a spacious, level lot, the property offers plenty of room for outdoor living, expansion, or future improvements. With strong potential and a convenient location, this home is ready for its next owner to bring their vision to life. Owner Financing with approved qualifications.
Key facts
- Brand new roof
- New front porch
- New exterior doors
Tags
Property features AI
Exterior
- Utilities: Public water; Public sewer
- Home design: Single-family residence; One story
- Construction: Level lot; Zoned R-2
- Exterior features: Front porch
Interior
- Flooring: Hardwood
- Bathrooms: 1 full bathroom
- Interior features: Electric water heater; Hardwood flooring
Neighborhood map
What this means for you Summary
Snapshot
- This is a 2-bed/1.0-bath single-family listed at $70k.
Deal economics
- At list price, monthly cash flow is $425 ($5k/yr) — positive.
- The deal already cash-flows at list — no discount required.
- Meets the 1% rule at list price ($1k rent vs $70k).
- Recommended offer: $69k (1.5% below list) — sets the bar for market timing.
- Cap rate 13.6% vs local median 4.0% in Woodruff — top-decile yield for the area; either an underpriced asset or a hidden risk that comps aren't pricing in. Stress-test before assuming the spread holds.
Location & tenants
- Location reads 65/100 on livability (#135 in SC) — a middle-class / working-renter tenant base. Strengths: cost of living A+, health & safety A+, crime A; Watch: amenities D+, commute F, employment F.
- Spartanburg 04 (town): math 47% / reading 45% proficiency, ranked #23 of 80 in SC (top 29%) — families likely to look elsewhere, expect single-tenant / working-renter base with shorter leases.
- Zoned schools: Woodruff Elementary (math 48% / reading 41%, grade F, #226 of 597 statewide, top 40%, 647 students, 81% FRL); Woodruff Middle (math 42% / reading 38%, grade F, #78 of 229 statewide, top 35%, 686 students, 78% FRL); Woodruff High (math 67% / reading 82%, grade B+, #38 of 196 statewide, top 20%, 788 students, 73% FRL) — zoned schools average 77% FRL vs 54% district-wide (24 pts higher); higher-poverty schools than district average — tighter screening recommended.
- Market conditions: 666 active listings in the ZIP; 3 comparable units currently listed for rent nearby; rentals at typical pace (median 24d on market — plan ~3-4 weeks tenant-placement turnaround); solid renter incomes; 3,129 units permitted in Spartanburg County in 2024 (40 in 5+ unit buildings).
- This rent is only 17% of the median local income ($80k/yr) — well below the 30% rent-burden line; pricing power to push rent on renewal without tenant pushback.
Forward outlook
- Local home prices are declining (-3.0%/yr); year-one equity from $483 of loan paydown is wiped out by about $2k of value loss. Plan a longer hold.
- Spartanburg County population projected at +18% by 2050 — long-run rental-demand tailwind backs the buy-and-hold thesis.
- At projected returns (-3.0% appreciation + 3.0% rent growth), your $20k cash investment doubles in ~5 years — after that, you're playing with house money.
Negotiation context
- It's been on market 17 days — a 2% lower offer ($69k) is reasonable based on typical stale-listing flexibility.
Risks & watch-outs
- Climate carrying-cost: extreme-heat days projected 7→16/yr by 2055 (HVAC capex compounding) — expect insurance premiums to compound above CPI over the hold.
Questions for the listing agent
- Built in 1960 — when were the roof, HVAC, electrical panel, plumbing, and water heater last replaced?
- Is there a deadline driving the sale (1031 exchange, divorce, estate, relocation)? That informs how much negotiation room exists.
- What's the average days-on-market for RENTAL listings here right now (not sales)? A rising rental-DOM trend means longer vacancies and softer asking-rent achievability than the comps imply.
- What's the recent tenant-quality profile in this submarket — average credit score on applications, eviction rate, late-payment / NSF rate, and stable-employment percentage? A property-management company in the area should have these aggregated.
- How much new for-sale + rental construction is in the pipeline within 1–3 miles? Heavy new supply typically softens prices + rents 12–24 months out; constrained supply supports both.
Investment metrics
- 1% rule
- 1.62% ✓
- Cap rate
- 13.58%
- Cash-on-cash
- 26.04%
- DSCR
- 2.16
- GRM
- 5.1
CMA / ARV
- ARV (on-the-fly)
- $124,670
- Comps found
- 12
Show comp detail 12 sales within ~0.75 mi
| Address | Dist | Beds/Ba | Sqft | Sold | Price | $/sf | Match |
|---|---|---|---|---|---|---|---|
| 256 Woodruff St | 0.04mi | 2/1.0 | 956 (-0%) | 18mo | $85,000 | $89 | 82 |
| 249 Poole St | 0.17mi | 2/1.0 | 921 (-4%) | 15mo | $120,000 | $130 | 73 |
| 308 Poole St | 0.16mi | 1/1.0 (-1) | 816 (-15%) | 2mo | $65,000 | $80 | 61 |
| 429 Poole St | 0.25mi | 2/1.0 | 816 (-15%) | 6mo | $46,000 | $56 | 59 |
| 140 Simpson Ave | 0.34mi | 2/1.0 | 1,100 (+15%) | 3mo | $92,000 | $84 | 57 |
| 561 Woodruff St | 0.40mi | 3/2.0 (+1) | 910 (-5%) | 11mo | $162,500 | $179 | 55 |
| 121 Wofford St St | 0.59mi | 3/1.0 (+1) | 975 (+2%) | 14mo | $165,000 | $169 | 53 |
| 443 Buncombe St | 0.24mi | 3/1.0 (+1) | 1,069 (+12%) | 15mo | $92,500 | $87 | 52 |
| 16 Poplar St | 0.42mi | 3/2.0 (+1) | 1,090 (+14%) | 2mo | $210,000 | $193 | 47 |
| 20 Poplar St | 0.47mi | 3/2.0 (+1) | 1,100 (+15%) | 1mo | $221,000 | $201 | 44 |
| 107 White Oak Rd | 0.61mi | 3/1.0 (+1) | 1,040 (+8%) | 15mo | $124,000 | $119 | 40 |
| 606 Buncombe St | 0.45mi | 3/2.0 (+1) | 1,100 (+15%) | 14mo | $239,900 | $218 | 34 |
Match score weights: distance 35% · size 25% · config 20% · recency 20%. Top-matched comps best support the ARV.
Projected returns pro-forma
-3.0% appreciation · 3.0% rent growth · sell at horizon
- IRR
- 19.8%
- Equity multiple
- 1.80×
- Total profit
- $15,734
- Equity at exit
- $10,422
- IRR
- 28.0%
- Equity multiple
- 3.48×
- Total profit
- $48,575
- Equity at exit
- $6,044
Cash invested: $19,572 (down + closing). Projections, not guarantees.
Landlord ↔ Tenant lean methodology
- Overall (STATE)
- 90 Strongly Landlord-Friendly
- State South Carolina
- 90 Strongly Landlord-Friendly · R+6
- County
- — inherits STATE
- City
- — inherits STATE
ZIP-level market 29388
- Home prices YoY
- -11.9%
- Active inventory
- 666
- Price-to-rent
- 5.1×
Monthly cashflow live
- Estimated rent
- $1,136 medium interval (Pro) →
- Mortgage (P&I)
- −$367
- Tax from tax record
- −$77 /mo · $921/yr
- Insurance
- −$29
- HOA
- −$0
- Vacancy / Maint / Mgmt
- −$238
- Net cashflow
- $425
Break-even live
UW: 25.0% down · 7.5% · 30yr · 1.5% tax · 5.0% vac · 8.0% maint · 8.0% mgmt
Financing live
Cash to close
- Down payment
- $17,475
- Closing costs
- $2,097
- Reserves months
- —
- Total cash needed
- —
Loan-product check · same deal, 3 products live
Conventional
25% down · 7.5% · 30yr
- Down + closing
- —
- Monthly P&I
- —
- Monthly cashflow
- —
- DSCR
- —
- Eligible?
- —
Personal DTI + credit; lowest rate.
DSCR
20% down · 8.5% · 30yr
- Down + closing
- —
- Monthly P&I
- —
- Monthly cashflow
- —
- DSCR
- —
- Eligible?
- —
No personal income docs; deal must DSCR.
Hard money
10% down · 12.0% · 12mo
- Down + closing
- —
- Monthly P&I
- —
- Monthly cashflow
- —
- DSCR
- —
- Eligible?
- —
Short-term bridge; refi at stabilization.
Rent comps 3 comps
| Address | Beds | Baths | Sqft | Rent | $/sqft | DOM | Units | Dist |
|---|---|---|---|---|---|---|---|---|
| 251 Fairview St Unit 1 Woodruff, SC | 2.0 | 1.0 | 896 | $875 | $0.98 | 23d | 1 | 0.66mi |
| 605 Round St Woodruff, SC | 2.0 | 1.0 | 1073 | $1,395 | $1.30 | 23d | 1 | 0.92mi |
| 727 S Main St Unit 1 Woodruff, SC | 2.0 | 1.0 | 800 | $800 | $1.00 | 23d | 1 | 1.06mi |
Listing history 13 events
-
2026-06-18days on market $69,900 Active 17 DOM
-
2026-06-17days on market $69,900 Active 16 DOM
-
2026-06-16days on market $69,900 Active 15 DOM
-
2026-06-15days on market $69,900 Active 14 DOM
-
2026-06-13days on market $69,900 Active 12 DOM
-
2026-06-13days on market $69,900 Active 11 DOM
-
2026-06-10days on market $69,900 Active 9 DOM
-
2026-06-09days on market $69,900 Active 8 DOM
-
2026-06-08days on market $69,900 Active 7 DOM
-
2026-06-07days on market $69,900 Active 6 DOM
-
2026-06-03days on market $69,900 Active 2 DOM
-
2026-06-02remarks 557-char remark
-
2026-06-02$69,900 Active 1 DOM
ⓘ Source: listings_history table (triggers on properties + properties_extension) + one-shot
backfill from property_details.listing_events for pre-trigger history.
Tax reassessment forecast SC · Resets to sale price
- Current annual tax
- $921 · $77/mo
- Projected year-2 tax
- $921 · $77/mo
- Expected delta
- $0/yr ($0/mo · 0.0%)
ⓘ Screening estimate from a state-policy table — verify with the county assessor before closing.
Climate risk First Street
- Flood 1/10 Low FEMA zone X (unshaded) · 0% chance over 30 yrs
- Wildfire 3/10 Moderate
- Heat 6/10 Major 7 d/yr ≥105°F today · 16 d/yr by 30 yrs out
- Wind 2/10 Low 3% chance of damaging wind over 30 yrs
- Air quality 3/10 Moderate 2 unhealthy d/yr today · 3 by 30 yrs out
Nearby sold comps map
Loading sold comps map…
Walkable amenities ~0.75 mi
Loading nearby amenities…
Taxation est. · year 1
- Rental income
- $13,628
- − Mortgage interest
- −$3,915
- − Property taxes
- −$921
- − Insurance
- −$350
- − Repairs & maintenance
- −$1,090
- − Management
- −$1,090
- − Depreciation
- −$2,033
- Taxable income
- $4,228
- Est. tax owed @ 24.0%
- −$1,015
- After-tax cash flow
- $4,082/yr
For passive investors: Depreciation is non-cash, so a rental often shows a tax loss while cash-flowing — sheltering income. Rental losses are passive: they offset passive income freely, and up to $25,000/yr can offset ordinary (W-2) income if you actively participate and your MAGI is under $100k (phasing out to $0 by $150k); unused losses carry forward. On sale, claimed depreciation is recaptured at up to 25%, and gains may owe capital-gains tax (a 1031 exchange can defer both). Figures are a year-1 estimate at your 24.0% rate — not tax advice; consult a CPA.
Schools (NCES district)
- District
- Spartanburg 04
- NCES district ID
- 4503570
- Math proficiency
- 47% ▼ -15.00%
- Reading proficiency
- 45% ▼ -6.00%
- Median HH income
- $39,416
- Composite
- 38.47/100
- National rank
- #4190
- State rank
- #23 of 80 in SC
Livability — Woodruff
- Score
- 65/100
- State rank
- #135
- US rank
- #13093
Category grades
Schools grade is shown separately in the Schools card above.
Census & demographics
- Census place
- Woodruff, SC
- County
- Spartanburg County · 258,607 people
- City population
- 16,868
- Metro
- Spartanburg, SC
- Population (ZIP)
- 16,868
- Household income
- $79,828
- Rent vs Own
- Severe rent burden
- 303.0
Population outlook (Spartanburg County) Hauer SSP2
- Today (2025)
- 325,495 people
- By 2030
- 338,800 · +4.1%
- By 2040
- 363,471 · +11.7%
- By 2050
- 384,156 · +18.0%
- By 2075
- 430,137 · +32.1%
- By 2100
- 442,733 · +36.0%
Race, ethnicity, and origin ACS 2023
- Neighborhood character
- Predominantly White (78%)
- Race & ethnicity
- White 78% Black 13% Hispanic / Latino 6% Two or more races 3%
- Hispanic origin (detail)
- Mexican 4%
- Common ancestry
- Serbian 3% Slovak 2% Iranian 1%
- Foreign-born
- 4% · Canada
- Languages at home
- 95% English-only · Spanish 4% Russian/Polish/Slavic 1%
Political lean MEDSL · Spartanburg
- 2024 margin
- Solid R (+33.6) · D 32.6% · R 66.2% · Other 1.2%
- 2008→2024 swing
- -12.0pp toward R · 2008: -21.6pp · 2024: -33.6pp
- All cycles
- 2024: R+33.6 2020: R+27.3 2016: R+30.0 2012: R+23.1 2008: R+21.6
Not yet ingested
- Civics
- —
Market trends
- HPI YoY
- ▼ -37.96%
- Current HPI
- 279.6651
- Rent YoY
- —
- Metro
- Spartanburg, SC
- State GDP YoY
- ▲ 4.51%
- F500 in state
- 2
Industry mix (Fortune 500 HQ in SC)
| Industry | F500 HQs | Revenue |
|---|---|---|
| Packaging | 1 | $7B |
|
||
Price history
1 event — show timeline
- 2026-06-01 Listed $69,900 SPMLS
Property tax history
+3.0%/yrLatest (2025): $921 · +1.7% YoY. Source: county tax records.
Cash-flow waterfall
monthlySold comps — $/sqft
last 12 mo · ≤1 miLoading sold comps…