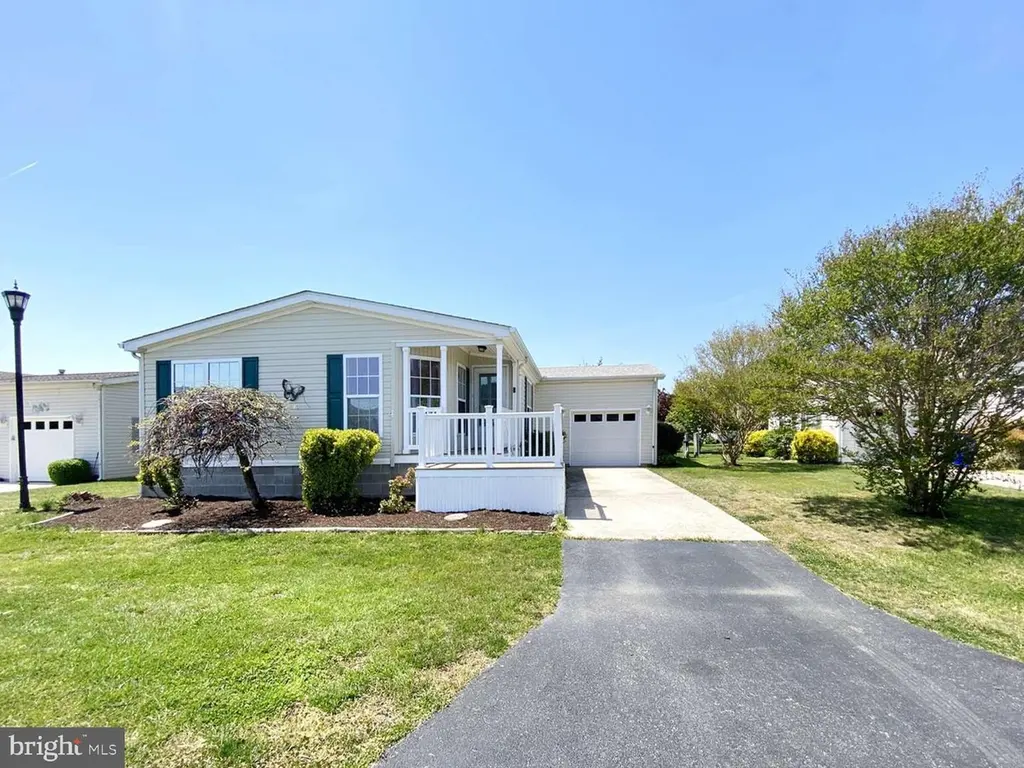
4 Mayfair Ln · Lewes, DE
Flood risk 1/10 · Minimal
- FEMA flood zone
- X (unshaded)
- Chance of flooding over 30 yrs
- 0.0%
- Est. flood insurance / yr
- $473 – $860
Fire risk 1/10 · Minimal
- Est. fire insurance / yr
- $476 – $884
Heat risk 8/10 · Major
- Hot days now (above 101°F)
- 7 days/yr
- Hot days in 30 yrs
- 19 days/yr
Wind risk 8/10 · Major
- Chance of severe wind over 30 yrs
- 80.0%
Air-quality risk 2/10 · Minimal
- Unhealthy air days now
- 1 days/yr
- Unhealthy air days in 30 yrs
- 1 days/yr
Risk factors via First Street. Map © Google.
Why this score? — see what drove the C grade
The composite is a weighted blend of 9 inputs, each scored 0–100. Each bar is that input's sub-score; the figure is the points it added to the 100-point composite (weight × sub-score).
- Cash flow +25.7/30.0
- DSCR +8.6/10.0
- 1% rule +6.8/10.0
- ARV discount +5.5/15.0
- Schools +4.2/10.0
- Livability +3.4/5.0
- Rent growth +2.7/5.0
- Condition / age +2.5/5.0
- Appreciation +0.0/10.0
$219,000
🖨 Deal sheet (PDF) 📄 Offer letter ✓ Due diligence
Listing remarks
Manufactured in 2000 this well-kept home has curb appeal and a private patio for your enjoyment. Open the door to the curvy archways and a Euro feel inside, featuring a neutral color palette with luxury vinyl plank flooring in the main living areas, a spacious living room, formal dining room, breakfast nook and kitchen with prep island, skylights and appliances including a new gas stove. The primary ensuite bedroom is located at the rear of the home and offers a roomy walk-in closet and connecting ensuite bath with dual sinks, a soaking tub and walk-in shower. Completing the floor plan is a second bedroom, another full bath as well as flex space for your home office, a crafting corner or ad
Key facts
- 40.19 acre lot
- 2 garage spots
- Community pool
Property features AI
Finance
- Other: Property listed in excellent condition; Land lease has ~100 years remaining
- Financial info: Monthly land lease payment
- HOA & community: Community indoor heated saltwater pool
Exterior
- Parking: Attached front-entry 2-car garage; Total of 2 garage/parking spaces
- Utilities: Private water; Public sewer; Natural gas available; Electric available; Cable TV available
- Home design: Manufactured home; Pitched roof; Main entrance faces west; Senior community (55+); Land lease ownership
- Construction: Built by Ritz Craft; Constructed of block, concrete, glass and vinyl siding; Block foundation with crawl space; No basement
- Exterior features: Patio(s); Porch(es); Bump-outs; BBQ grill; Exterior lighting; Street lights
Interior
- Kitchen: Dishwasher; Disposal; Gas oven/range; Stove; Microwave; Refrigerator; Extra refrigerator/freezer; Eat-in kitchen / breakfast area; Kitchen island
- Bedrooms: 3 bedrooms on the main level; At least one bedroom on the entry level
- Flooring: Hardwood; Carpet (partially carpeted); Vinyl
- Bathrooms: 2 full bathrooms (both on the main level); Master bath with stall shower
- Heating & cooling: Heat pumps; Natural gas heating; Central air conditioning; Programmable thermostat; 100 amp electrical service
- Interior features: Breakfast area; Built-ins; Ceiling fans; Combination kitchen/dining; Formal separate dining room; Kitchen island; Master bath; Skylights; Stall shower; Stain/lead glass windows; Window treatments; Walk-in closets; Storm door; 9'+ ceilings; Drywall walls/ceilings
- Laundry & utility: Washer and dryer (main floor); 60+ gallon natural gas water heater
Neighborhood map
What this means for you Summary
Snapshot
- This is a 3-bed/2.0-bath manufactured listed at $219k.
Deal economics
- At list price, monthly cash flow is $527 ($6k/yr) — positive.
- The deal already cash-flows at list — no discount required.
- Meets the 1% rule at list price ($3k rent vs $219k).
- Recommended offer: $212k (3.0% below list) — sets the bar for market timing.
- Cap rate 9.2% vs local median 1.7% in Lewes — top-decile yield for the area; either an underpriced asset or a hidden risk that comps aren't pricing in. Stress-test before assuming the spread holds.
Location & tenants
- Location reads 67/100 on livability (#40 in DE) — a middle-class / working-renter tenant base. Strengths: crime A+, employment A+, health & safety A+; Watch: commute F, cost of living F.
- Cape Henlopen School District (town): math 42% / reading 55% proficiency, ranked #5 of 26 in DE (top 19%) — families likely to look elsewhere, expect single-tenant / working-renter base with shorter leases.
- Zoned schools: Lewes Elementary School (math 58% / reading 60%, grade B-, #4 of 105 statewide, top 4%, 582 students, 0% FRL); Mariner Middle School (math 32% / reading 48%, grade F, #7 of 36 statewide, top 17%, 664 students, 0% FRL); Cape Henlopen High School (math 26% / reading 51%, grade F, #14 of 40 statewide, top 33%, 1,813 students, 0% FRL) — zoned schools average 0% FRL vs 41% district-wide (41 pts lower); this property's tenant base skews higher-income than the district average.
- Market conditions: Rents flat; 818 active listings in the ZIP; 7 comparable units currently listed for rent nearby; rentals lingering (median 44d on market — plan ~5-8 weeks vacancy on turnover, expect pricing pressure); 57% of comp listings sitting > 30 days — soft ceiling on asking rent; solid renter incomes; 4,354 units permitted in Sussex County in 2024 (344 in 5+ unit buildings).
- This rent runs 32% of the median local income ($97k/yr) — at the standard rent-burdened threshold; future hikes will face affordability resistance.
Forward outlook
- Local home prices are declining (-3.0%/yr); year-one equity from $2k of loan paydown is wiped out by about $7k of value loss. Plan a longer hold.
- Sussex County population projected at +25% by 2050 — long-run rental-demand tailwind backs the buy-and-hold thesis.
Negotiation context
- It's been on market 41 days — a 3% lower offer ($212k) is reasonable based on typical stale-listing flexibility.
- 2 sale attempts since 16y ago with the ask held roughly flat each time — persistent listings suggest the price (not the market) is what's stuck; bring a comps-based counter.
Risks & watch-outs
- Climate carrying-cost: severe wind risk, 80% chance of damaging wind over 30y; extreme-heat days projected 7→19/yr by 2055 (HVAC capex compounding) — expect insurance premiums to compound above CPI over the hold.
Questions for the listing agent
- It's been on market 41 days. Have you received any prior offers? Is the seller open to a 3% concession, seller financing, or rate buy-down credit?
- Is there a deadline driving the sale (1031 exchange, divorce, estate, relocation)? That informs how much negotiation room exists.
- Schools are B-rated — typically a magnet for longer-tenancy family renters. What's the average tenant stay here, and is there a school-zone premium baked into asking?
- What's the average days-on-market for RENTAL listings here right now (not sales)? A rising rental-DOM trend means longer vacancies and softer asking-rent achievability than the comps imply.
- What's the recent tenant-quality profile in this submarket — average credit score on applications, eviction rate, late-payment / NSF rate, and stable-employment percentage? A property-management company in the area should have these aggregated.
- How much new for-sale + rental construction is in the pipeline within 1–3 miles? Heavy new supply typically softens prices + rents 12–24 months out; constrained supply supports both.
Investment metrics
- 1% rule
- 1.18% ✓
- Cap rate
- 9.18%
- Cash-on-cash
- 10.30%
- DSCR
- 1.46
- GRM
- 7.1
CMA / ARV
- ARV (median comp)
- $209,691
- List price
- $219,000
- Delta
- 4.44%
- Verdict
- FAIR
- Comps
- 20 within 1.0 mi
Show comp detail 1 sale within ~0.75 mi
| Address | Dist | Beds/Ba | Sqft | Sold | Price | $/sf | Match |
|---|---|---|---|---|---|---|---|
| 31702 Siham Rd #2339 | 0.61mi | 3/2.0 | 1,524 (-6%) | 22mo | $130,000 | $85 | 43 |
Match score weights: distance 35% · size 25% · config 20% · recency 20%. Top-matched comps best support the ARV.
Projected returns pro-forma
-3.0% appreciation · 0.77% rent growth · sell at horizon
- IRR
- -3.4%
- Equity multiple
- 0.88×
- Total profit
- $-7,578
- Equity at exit
- $32,654
- IRR
- 3.6%
- Equity multiple
- 1.24×
- Total profit
- $14,503
- Equity at exit
- $18,935
Cash invested: $61,320 (down + closing). Projections, not guarantees.
Landlord ↔ Tenant lean methodology
- Overall (STATE)
- 70 Landlord-Friendly
- State Delaware
- 70 Landlord-Friendly · D+7
- County
- — inherits STATE
- City
- — inherits STATE
ZIP-level market 19958
- Rents YoY
- 0.8%
- Active inventory
- 818
- Price-to-rent
- 7.1×
Monthly cashflow live
- Estimated rent
- $2,582 high interval (Pro) →
- Mortgage (P&I)
- −$1,148
- Tax est. 1.5%
- −$274 /mo · $3,285/yr
- Insurance
- −$91
- HOA
- −$0
- Vacancy / Maint / Mgmt
- −$542
- Net cashflow
- $527
Break-even live
Sensitivity live
| Price | -10% $678 | -5% $602 | +0% $527 | +5% $451 | +10% $375 |
|---|---|---|---|---|---|
| Rent | -10% $323 | -5% $425 | +0% $527 | +5% $629 | +10% $731 |
| Rate | -1.0pp $637 | -0.5pp $582 | base $527 | +0.5pp $470 | +1.0pp $412 |
UW: 25.0% down · 7.5% · 30yr · 1.5% tax · 5.0% vac · 8.0% maint · 8.0% mgmt
Financing live
Cash to close
- Down payment
- $54,750
- Closing costs
- $6,570
- Reserves months
- —
- Total cash needed
- —
Loan-product check · same deal, 3 products live
Conventional
25% down · 7.5% · 30yr
- Down + closing
- —
- Monthly P&I
- —
- Monthly cashflow
- —
- DSCR
- —
- Eligible?
- —
Personal DTI + credit; lowest rate.
DSCR
20% down · 8.5% · 30yr
- Down + closing
- —
- Monthly P&I
- —
- Monthly cashflow
- —
- DSCR
- —
- Eligible?
- —
No personal income docs; deal must DSCR.
Hard money
10% down · 12.0% · 12mo
- Down + closing
- —
- Monthly P&I
- —
- Monthly cashflow
- —
- DSCR
- —
- Eligible?
- —
Short-term bridge; refi at stabilization.
Rent comps 7 comps
| Address | Beds | Baths | Sqft | Rent | $/sqft | DOM | Units | Dist |
|---|---|---|---|---|---|---|---|---|
| 20141 Riesling Ln #306 Lewes, DE | 2.0 | 2.0 | 1600 | $2,600 | $1.62 | 44d | 1 | 0.64mi |
| 24258 Zinfandel Ln Lewes, DE | 2.0 | 2.0 | 1300 | $2,300 | $1.77 | 44d | 1 | 0.68mi |
| 12001 Old Vine Blvd Lewes, DE | 1.0–2.0 | 1.0–2.0 | 987 | $3,055 | $3.10 | 14d | 17 | 0.70mi |
| 24238 Zinfandel Ln Lewes, DE | 2.0 | 2.0 | 1300 | $2,300 | $1.77 | 44d | 1 | 0.73mi |
| 17010 Minos Conaway Rd Lewes, DE | 3.0 | 2.0 | 1600 | $2,500 | $1.56 | 44d | 1 | 0.99mi |
| 17432 Slipper Shell Way #5 Lewes, DE | 3.0 | 2.0 | 1840 | $2,150 | $1.17 | 21d | 1 | 1.34mi |
| 18 Greystone Dr Lewes, DE | 3.0 | 2.5 | 2114 | $2,875 | $1.36 | 21d | 1 | 1.49mi |
Listing history 19 events
-
2026-06-18days on market $219,000 Active 41 DOM
-
2026-06-17days on market $219,000 Active 40 DOM
-
2026-06-16days on market $219,000 Active 39 DOM
-
2026-06-15days on market $219,000 Active 38 DOM
-
2026-06-14days on market $219,000 Active 36 DOM
-
2026-06-13days on market $219,000 Active 35 DOM
-
2026-06-10days on market $219,000 Active 33 DOM
-
2026-06-09days on market $219,000 Active 32 DOM
-
2026-06-08days on market $219,000 Active 31 DOM
-
2026-06-07days on market $219,000 Active 30 DOM
-
2026-06-05days on market $219,000 Active 27 DOM
-
2026-06-03days on market $219,000 Active 26 DOM
-
2026-06-02days on market $219,000 Active 25 DOM
-
2026-06-01days on market $219,000 Active 24 DOM
-
2026-05-31days on market $219,000 Active 23 DOM
-
2026-05-30days on market $219,000 Active 22 DOM
-
2026-05-08$219,000 Active 1762-char remark
-
2011-05-17historical
-
2010-05-17$90,900
ⓘ Source: listings_history table (triggers on properties + properties_extension) + one-shot
backfill from property_details.listing_events for pre-trigger history.
Climate risk First Street
- Flood 1/10 Low FEMA zone X (unshaded) · 0% chance over 30 yrs
- Wildfire 1/10 Low
- Heat 8/10 Severe 7 d/yr ≥101°F today · 19 d/yr by 30 yrs out
- Wind 8/10 Severe 80% chance of damaging wind over 30 yrs
- Air quality 2/10 Low 1 unhealthy d/yr today · 1 by 30 yrs out
Nearby sold comps map
Loading sold comps map…
Walkable amenities ~0.75 mi
Loading nearby amenities…
Taxation est. · year 1
- Rental income
- $30,988
- − Mortgage interest
- −$12,267
- − Property taxes
- −$3,285
- − Insurance
- −$1,095
- − Repairs & maintenance
- −$2,479
- − Management
- −$2,479
- − Depreciation
- −$6,371
- Taxable income
- $3,012
- Est. tax owed @ 24.0%
- −$723
- After-tax cash flow
- $5,596/yr
For passive investors: Depreciation is non-cash, so a rental often shows a tax loss while cash-flowing — sheltering income. Rental losses are passive: they offset passive income freely, and up to $25,000/yr can offset ordinary (W-2) income if you actively participate and your MAGI is under $100k (phasing out to $0 by $150k); unused losses carry forward. On sale, claimed depreciation is recaptured at up to 25%, and gains may owe capital-gains tax (a 1031 exchange can defer both). Figures are a year-1 estimate at your 24.0% rate — not tax advice; consult a CPA.
Schools (NCES district)
- District
- Cape Henlopen School District
- NCES district ID
- 1000170
- Math proficiency
- 42% ▼ -14.00%
- Reading proficiency
- 55% ▼ -10.00%
- Median HH income
- $60,196
- Composite
- 42.47/100
- National rank
- #3214
- State rank
- #5 of 26 in DE
Livability — Lewes
- Score
- 67/100
- State rank
- #40
- US rank
- #11077
Category grades
Schools grade is shown separately in the Schools card above.
Census & demographics
- County
- Sussex County · 82,708 people
- City population
- 31,938
- Metro
- Salisbury, MD-DE
- Population (ZIP)
- 31,938
- Household income
- $97,197
- Rent vs Own
- Severe rent burden
- 545.0
Population outlook (Sussex County) Hauer SSP2
- Today (2025)
- 248,853 people
- By 2030
- 264,464 · +6.3%
- By 2040
- 290,980 · +16.9%
- By 2050
- 311,259 · +25.1%
- By 2075
- 352,488 · +41.6%
- By 2100
- 367,406 · +47.6%
Race, ethnicity, and origin ACS 2023
- Neighborhood character
- Predominantly White (88%)
- Race & ethnicity
- White 88% Two or more races 6% Hispanic / Latino 4% Black 2% Asian 2%
- Common ancestry
- Romanian 6% Slovak 3% Italian 2%
- Foreign-born
- 6% · Canada
- Languages at home
- 93% English-only · Spanish 3% Other Indo-European 1% Russian/Polish/Slavic 1%
Political lean MEDSL · Sussex
- 2024 margin
- R (+11.0) · D 43.9% · R 54.9% · Other 1.2%
- 2008→2024 swing
- -2.4pp toward R · 2008: -8.6pp · 2024: -11.0pp
- All cycles
- 2024: R+11.0 2020: R+11.2 2016: R+22.0 2012: R+13.0 2008: R+8.6
Not yet ingested
- Civics
- —
Market trends
- HPI YoY
- ▼ -204.07%
- Current HPI
- 299.0736
- Rent YoY
- ▲ 0.77%
- Metro
- Salisbury, MD-DE
- State GDP YoY
- —
- F500 in state
- 0
Price history
+140.9% since first listed3 events — show timeline
- 2026-05-08 Listed $219,000 BRIGHT MLS
- 2011-05-17 Listing Removed — BRIGHT MLS
- 2010-05-17 Listed $90,900 BRIGHT MLS
Property tax history
-6.1%/yrLatest (2025): $284 · -48.6% YoY. Source: county tax records.
Cash-flow waterfall
monthlySold comps — $/sqft
last 12 mo · ≤1 miLoading sold comps…