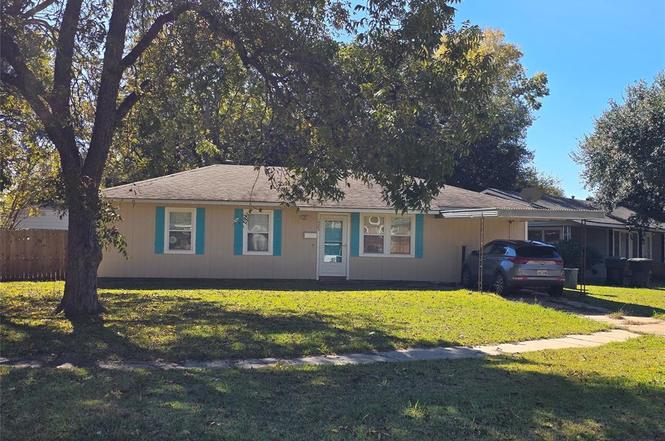
1523 Viosca St · Bossier City, LA
Flood risk 2/10 · Minimal
- FEMA flood zone
- X (unshaded)
- Chance of flooding over 30 yrs
- 0.07%
- Est. flood insurance / yr
- $507 – $1,088
Fire risk 1/10 · Minimal
- Est. fire insurance / yr
- $1,269 – $2,357
Heat risk 7/10 · Major
- Hot days now (above 110°F)
- 7 days/yr
- Hot days in 30 yrs
- 22 days/yr
Wind risk 6/10 · Moderate
- Chance of severe wind over 30 yrs
- 63.0%
Air-quality risk 2/10 · Minimal
- Unhealthy air days now
- 1 days/yr
- Unhealthy air days in 30 yrs
- 2 days/yr
Risk factors via First Street. Map © Google.
Why this score? — see what drove the B grade
The composite is a weighted blend of 9 inputs, each scored 0–100. Each bar is that input's sub-score; the figure is the points it added to the 100-point composite (weight × sub-score).
- Cash flow +26.8/30.0
- ARV discount +15.0/15.0
- DSCR +9.2/10.0
- 1% rule +7.2/10.0
- Rent growth +4.1/5.0
- Schools +3.8/10.0
- Livability +3.6/5.0
- Condition / age +2.5/5.0
- Appreciation +0.0/10.0
$112,000
🖨 Deal sheet 📄 Offer letter ✓ Due diligence
Listing remarks
ATTENTION INVESTORS!!! Don't let this one slip through your hands! Remodel started but never finished. This home is perfect for adding to your rental portfolio or just finishing up the remodel for your own family! Spacious corner lot in highly sought after Glendale Subdivision! Very convenient location to shopping, restaurants, interstate, or just a short drive over the river to Shreveport! Home may qualify for Conventional financing or Cash. Bring us your offers!! Schedule a showing today!
Key facts
- Glendale subdivision
- Convenient location
- Corner lot
Tags
Property features AI
Finance
- Other: Property listed as active and for sale; Possession at closing/funding
- Financial info: No second mortgage indicated; Loan type: Treat as clear
- HOA & community: No homeowners association
Exterior
- Parking: One covered parking space; One carport space; Driveway access
- Utilities: Municipal utility district: No; Other utilities
- Home design: Single-family residence; Residential property; One story; Built in 1956; Not attached to another dwelling
- Construction: Built in 1956
- Exterior features: Lot under 0.5 acre (approximately 0.224 acres); Subdivision: Glendale Subdivision
Interior
- Kitchen: Other appliances
- Bedrooms: Three bedrooms (all on the main level); Primary bedroom on the main level
- Bathrooms: One full bathroom
- Interior features: Six total rooms; One living area; One dining area; One-level floorplan; Other interior features
- Laundry & utility: No specific laundry/utility details provided
Neighborhood map
What this means for you Summary
Snapshot
- This is a 3-bed/1.0-bath single-family listed at $112k.
Deal economics
- At list price, monthly cash flow is $305 ($4k/yr) — positive.
- The deal already cash-flows at list — no discount required.
- Meets the 1% rule at list price ($1k rent vs $112k).
- Cap rate 9.6% vs local median 4.7% in Bossier City — top-decile yield for the area; either an underpriced asset or a hidden risk that comps aren't pricing in. Stress-test before assuming the spread holds.
Location & tenants
- Location reads 71/100 on livability (#47 in LA) — a middle-class / working-renter tenant base. Strengths: commute A+, cost of living A+, housing A+; Watch: employment D+, crime F, amenities F.
- Bossier Parish (urban): math 40% / reading 47% proficiency, ranked #17 of 98 in LA (top 17%) — families likely to look elsewhere, expect single-tenant / working-renter base with shorter leases.
- Market conditions: Rents rising fast (+6.6%/yr); 421 active listings in the ZIP; 20 comparable units currently listed for rent nearby; rentals at typical pace (median 21d on market — plan ~3-4 weeks tenant-placement turnaround); 716 units permitted in Bossier Parish in 2024 (0 in 5+ unit buildings).
Forward outlook
- Local home prices are declining (-3.0%/yr); year-one equity from $774 of loan paydown is wiped out by about $3k of value loss. Plan a longer hold.
- Bossier County population projected at +28% by 2050 — long-run rental-demand tailwind backs the buy-and-hold thesis.
- At projected returns (-3.0% appreciation + 6.6% rent growth), your $31k cash investment doubles in ~8 years — after that, you're playing with house money.
Negotiation context
- Only 4 days on market — expect competitive offers; lowballing is unlikely to land.
Risks & watch-outs
- Watch-outs: built in 1956 — expect roof / HVAC / electrical / plumbing capex.
- Climate carrying-cost: major wind risk, 63% chance of damaging wind over 30y; extreme-heat days projected 7→22/yr by 2055 (HVAC capex compounding) — expect insurance premiums to compound above CPI over the hold.
Questions for the listing agent
- Built in 1956 — when were the roof, HVAC, electrical panel, plumbing, and water heater last replaced?
- Is there a deadline driving the sale (1031 exchange, divorce, estate, relocation)? That informs how much negotiation room exists.
- Schools are B-rated — typically a magnet for longer-tenancy family renters. What's the average tenant stay here, and is there a school-zone premium baked into asking?
- Crime grade is F in this area — have there been break-ins, vandalism, or insurance claims at this property in the last 3 years? What carrier currently insures it and at what premium?
- What's the average days-on-market for RENTAL listings here right now (not sales)? A rising rental-DOM trend means longer vacancies and softer asking-rent achievability than the comps imply.
- What's the recent tenant-quality profile in this submarket — average credit score on applications, eviction rate, late-payment / NSF rate, and stable-employment percentage? A property-management company in the area should have these aggregated.
- How much new for-sale + rental construction is in the pipeline within 1–3 miles? Heavy new supply typically softens prices + rents 12–24 months out; constrained supply supports both.
Investment metrics
- 1% rule
- 1.22% ✓
- Cap rate
- 9.57%
- Cash-on-cash
- 11.69%
- DSCR
- 1.52
- GRM
- 6.8
CMA / ARV
- ARV (on-the-fly)
- $158,592
- Comps found
- 12
Show comp detail 12 sales within ~0.75 mi
| Address | Dist | Beds/Ba | Sqft | Sold | Price | $/sf | Match |
|---|---|---|---|---|---|---|---|
| 1509 James St | 0.20mi | 3/1.0 | 1,284 (-4%) | 2mo | $70,000 | $55 | 82 |
| 1507 Viosca St | 0.10mi | 3/1.0 | 1,428 (+6%) | 5mo | $94,900 | $66 | 81 |
| 2400 Broadway Dr | 0.31mi | 3/1.0 | 1,295 (-4%) | 0mo | $164,999 | $127 | 79 |
| 2424 Broadway Dr | 0.26mi | 3/2.0 | 1,367 (+2%) | 4mo | $136,500 | $100 | 78 |
| 1536 James St | 0.21mi | 3/1.0 | 1,250 (-7%) | 3mo | $127,386 | $102 | 76 |
| 1515 Debra St | 0.14mi | 4/2.0 (+1) | 1,269 (-6%) | 6mo | $149,999 | $118 | 70 |
| 1105 Len St | 0.36mi | 3/2.0 | 1,300 (-3%) | 4mo | $147,400 | $113 | 70 |
| 2406 Waverly Dr | 0.67mi | 3/1.5 | 1,258 (-6%) | 0mo | $169,900 | $135 | 56 |
| 2407 Douglas Dr | 0.64mi | 3/2.0 | 1,486 (+11%) | 2mo | $179,900 | $121 | 47 |
| 2602 Ashland Ave | 0.74mi | 3/2.0 | 1,480 (+10%) | 1mo | $210,000 | $142 | 44 |
| 3007 Gaines St | 0.69mi | 3/1.0 | 1,142 (-15%) | 1mo | $131,229 | $115 | 42 |
| 2905 Rebel | 0.60mi | 4/2.0 (+1) | 1,180 (-12%) | 6mo | $145,000 | $123 | 38 |
Match score weights: distance 35% · size 25% · config 20% · recency 20%. Top-matched comps best support the ARV.
Projected returns pro-forma
-3.0% appreciation · 6.56% rent growth · sell at horizon
- IRR
- 5.1%
- Equity multiple
- 1.20×
- Total profit
- $6,398
- Equity at exit
- $16,700
- IRR
- 17.5%
- Equity multiple
- 2.69×
- Total profit
- $53,094
- Equity at exit
- $9,684
Cash invested: $31,360 (down + closing). Projections, not guarantees.
Landlord ↔ Tenant lean methodology
- Overall (STATE)
- 90 Strongly Landlord-Friendly
- State Louisiana
- 90 Strongly Landlord-Friendly · R+12
- County
- — inherits STATE
- City
- — inherits STATE
ZIP-level market 71111
- Home prices YoY
- -34.8%
- Rents YoY
- 6.6%
- Active inventory
- 421
- Price-to-rent
- 6.8×
Monthly cashflow live
- Estimated rent
- $1,366 high interval (Pro) →
- Mortgage (P&I)
- −$587
- Tax est. 1.5%
- −$140 /mo · $1,680/yr
- Insurance
- −$47
- HOA
- −$0
- Vacancy / Maint / Mgmt
- −$287
- Net cashflow
- $305
Break-even live
UW: 25.0% down · 7.5% · 30yr · 1.5% tax · 5.0% vac · 8.0% maint · 8.0% mgmt
Financing live
Cash to close
- Down payment
- $28,000
- Closing costs
- $3,360
- Reserves months
- —
- Total cash needed
- —
Loan-product check · same deal, 3 products live
Conventional
25% down · 7.5% · 30yr
- Down + closing
- —
- Monthly P&I
- —
- Monthly cashflow
- —
- DSCR
- —
- Eligible?
- —
Personal DTI + credit; lowest rate.
DSCR
20% down · 8.5% · 30yr
- Down + closing
- —
- Monthly P&I
- —
- Monthly cashflow
- —
- DSCR
- —
- Eligible?
- —
No personal income docs; deal must DSCR.
Hard money
10% down · 12.0% · 12mo
- Down + closing
- —
- Monthly P&I
- —
- Monthly cashflow
- —
- DSCR
- —
- Eligible?
- —
Short-term bridge; refi at stabilization.
Rent comps 20 comps
| Address | Beds | Baths | Sqft | Rent | $/sqft | DOM | Units | Dist |
|---|---|---|---|---|---|---|---|---|
| 1518 Viosca St Bossier City, LA | 3.0 | 2.0 | 1434 | $1,200 | $0.84 | 20d | 1 | 0.05mi |
| 1525 Debra St Bossier City, LA | 3.0 | 1.0 | 1033 | $975 | $0.94 | 20d | 1 | 0.14mi |
| 1005 Clarence St Bossier City, LA | 3.0 | 2.0 | 1203 | $1,300 | $1.08 | 43d | 1 | 0.30mi |
| 2400 Broadway Dr Bossier City, LA | 3.0 | 1.0 | 1295 | $1,450 | $1.12 | 13d | 1 | 0.31mi |
| 2505 Douglas Dr Bossier City, LA | 4.0 | 2.0 | 1640 | $1,700 | $1.04 | 43d | 1 | 0.63mi |
| 2804 Hood Dr Bossier City, LA | 3.0 | 1.0 | 1027 | $1,250 | $1.22 | 13d | 1 | 0.70mi |
| 3009 Gaines St Bossier City, LA | 3.0 | 1.0 | 1060 | $1,200 | $1.13 | 20d | 1 | 0.73mi |
| 3200 Cottonwood St Bossier City, LA | 4.0 | 2.0 | 1116 | $1,075 | $0.96 | 20d | 1 | 0.73mi |
| 1735 Green St Bossier City, LA | 4.0 | 2.0 | 1488 | $1,775 | $1.19 | 43d | 1 | 0.95mi |
| 2579 Airline Dr Bossier City, LA | 1.0–2.0 | 1.0–1.5 | 847 | $1,213 | $1.43 | 13d | 6 | 1.07mi |
| 3325 E Texas St Bossier City, LA | 1.0–2.0 | 1.0–2.0 | 810 | $950 | $1.17 | 20d | 1 | 1.19mi |
| 2601 Airline Dr Bossier City, LA | 1.0–2.0 | 1.0–2.0 | 746 | $1,510 | $2.02 | 13d | 10 | 1.20mi |
| 413 Montgomery St Bossier City, LA | 3.0 | 1.0 | 1152 | $1,000 | $0.87 | 13d | 1 | 1.29mi |
| 100 Crossroads Blvd Bossier City, LA | 1.0–2.0 | 1.0–2.0 | 858 | $1,299 | $1.51 | 43d | 1 | 1.30mi |
| 205 Royal St Bossier City, LA | 2.0 | 1.5 | 1100 | $1,100 | $1.00 | 43d | 1 | 1.33mi |
| 305 Orleans St Bossier City, LA | 2.0 | 1.5 | 1021 | $1,000 | $0.98 | 20d | 1 | 1.39mi |
| 4056 Beech St Bossier City, LA | 4.0 | 1.0 | 1391 | $1,400 | $1.01 | 20d | 1 | 1.42mi |
| 301 Edwards St Bossier City, LA | 2.0 | 1.0 | 900 | $1,175 | $1.31 | 20d | 1 | 1.43mi |
| 1225 Delhi St Bossier City, LA | 3.0 | 1.0 | 1092 | $800 | $0.73 | 20d | 1 | 1.44mi |
| 400 John Wesley Blvd Bossier City, LA | 2.0 | 1.5 | 935 | $842 | $0.90 | 13d | 2 | 1.44mi |
Listing history 5 events
-
2026-06-18days on market $112,000 Active 4 DOM
-
2026-06-17days on market $112,000 Active 3 DOM
-
2026-06-16days on market $112,000 Active 2 DOM
-
2026-06-15remarks 495-char remark
-
2026-06-15$112,000 Active 1 DOM
ⓘ Source: listings_history table (triggers on properties + properties_extension) + one-shot
backfill from property_details.listing_events for pre-trigger history.
Climate risk First Street
- Flood 2/10 Low FEMA zone X (unshaded) · 7% chance over 30 yrs
- Wildfire 1/10 Low
- Heat 7/10 Severe 7 d/yr ≥110°F today · 22 d/yr by 30 yrs out
- Wind 6/10 Major 63% chance of damaging wind over 30 yrs
- Air quality 2/10 Low 1 unhealthy d/yr today · 2 by 30 yrs out
Nearby sold comps map
Loading sold comps map…
Walkable amenities ~0.75 mi
Loading nearby amenities…
Taxation est. · year 1
- Rental income
- $16,398
- − Mortgage interest
- −$6,274
- − Property taxes
- −$1,680
- − Insurance
- −$560
- − Repairs & maintenance
- −$1,312
- − Management
- −$1,312
- − Depreciation
- −$3,258
- Taxable income
- $2,002
- Est. tax owed @ 24.0%
- −$480
- After-tax cash flow
- $3,185/yr
For passive investors: Depreciation is non-cash, so a rental often shows a tax loss while cash-flowing — sheltering income. Rental losses are passive: they offset passive income freely, and up to $25,000/yr can offset ordinary (W-2) income if you actively participate and your MAGI is under $100k (phasing out to $0 by $150k); unused losses carry forward. On sale, claimed depreciation is recaptured at up to 25%, and gains may owe capital-gains tax (a 1031 exchange can defer both). Figures are a year-1 estimate at your 24.0% rate — not tax advice; consult a CPA.
Schools (NCES district)
- District
- Bossier Parish
- NCES district ID
- 2200270
- Math proficiency
- 40% ▼ -32.00%
- Reading proficiency
- 47% ▼ -28.00%
- Median HH income
- $51,326
- Composite
- 37.5/100
- National rank
- #4402
- State rank
- #17 of 98 in LA
Livability — Bossier City
- Score
- 71/100
- State rank
- #47
- US rank
- #7044
Category grades
Schools grade is shown separately in the Schools card above.
Census & demographics
- Census place
- Bossier City, LA
- County
- Bossier Parish · 98,704 people
- City population
- 91,925
- Metro
- Shreveport-Bossier City, LA
- Population (ZIP)
- 43,925
- Household income
- $65,292
- Rent vs Own
- Severe rent burden
- 1942.0
Population outlook (Bossier County) Hauer SSP2
- Today (2025)
- 143,247 people
- By 2030
- 151,802 · +6.0%
- By 2040
- 168,194 · +17.4%
- By 2050
- 183,533 · +28.1%
- By 2075
- 217,009 · +51.5%
- By 2100
- 230,091 · +60.6%
Race, ethnicity, and origin ACS 2023
- Neighborhood character
- Diverse neighborhood (Simpson 0.60)
- Race & ethnicity
- White 56% Black 29% Hispanic / Latino 9% Two or more races 8% Asian 3%
- Hispanic origin (detail)
- Mexican 5%
- Common ancestry
- Lithuanian 2% Iranian 1% Slovak 1%
- Foreign-born
- 5% · Canada, Vietnam
- Languages at home
- 90% English-only · Spanish 7% Vietnamese 1% French/Haitian/Cajun 1%
Political lean MEDSL · Bossier
- 2024 margin
- Solid R (+43.3) · D 27.7% · R 71.0% · Other 1.3%
- 2008→2024 swing
- +0.3pp no change · 2008: -43.7pp · 2024: -43.3pp
- All cycles
- 2024: R+43.3 2020: R+41.0 2016: R+45.8 2012: R+45.4 2008: R+43.7
Not yet ingested
- Civics
- —
Market trends
- HPI YoY
- ▼ -79.78%
- Current HPI
- 149.4336
- Rent YoY
- ▲ 6.56%
- Metro
- Shreveport-Bossier City, LA
- State GDP YoY
- ▲ 3.29%
- F500 in state
- 10
Industry mix (Fortune 500 HQ in LA)
| Industry | F500 HQs | Revenue |
|---|---|---|
| Telecommunications | 2 | $23B |
|
||
| Utilities | 1 | $12B |
|
||
| Wholesale / Distribution | 1 | $5B |
|
||
| Advertising | 1 | $2B |
|
||
Price history
1 event — show timeline
- 2026-06-12 Listed $112,000 NTREIS
Property tax history
-0.7%/yrLatest (2023): $130 · -4.2% YoY. Source: county tax records.
Cash-flow waterfall
monthlySold comps — $/sqft
last 12 mo · ≤1 miLoading sold comps…