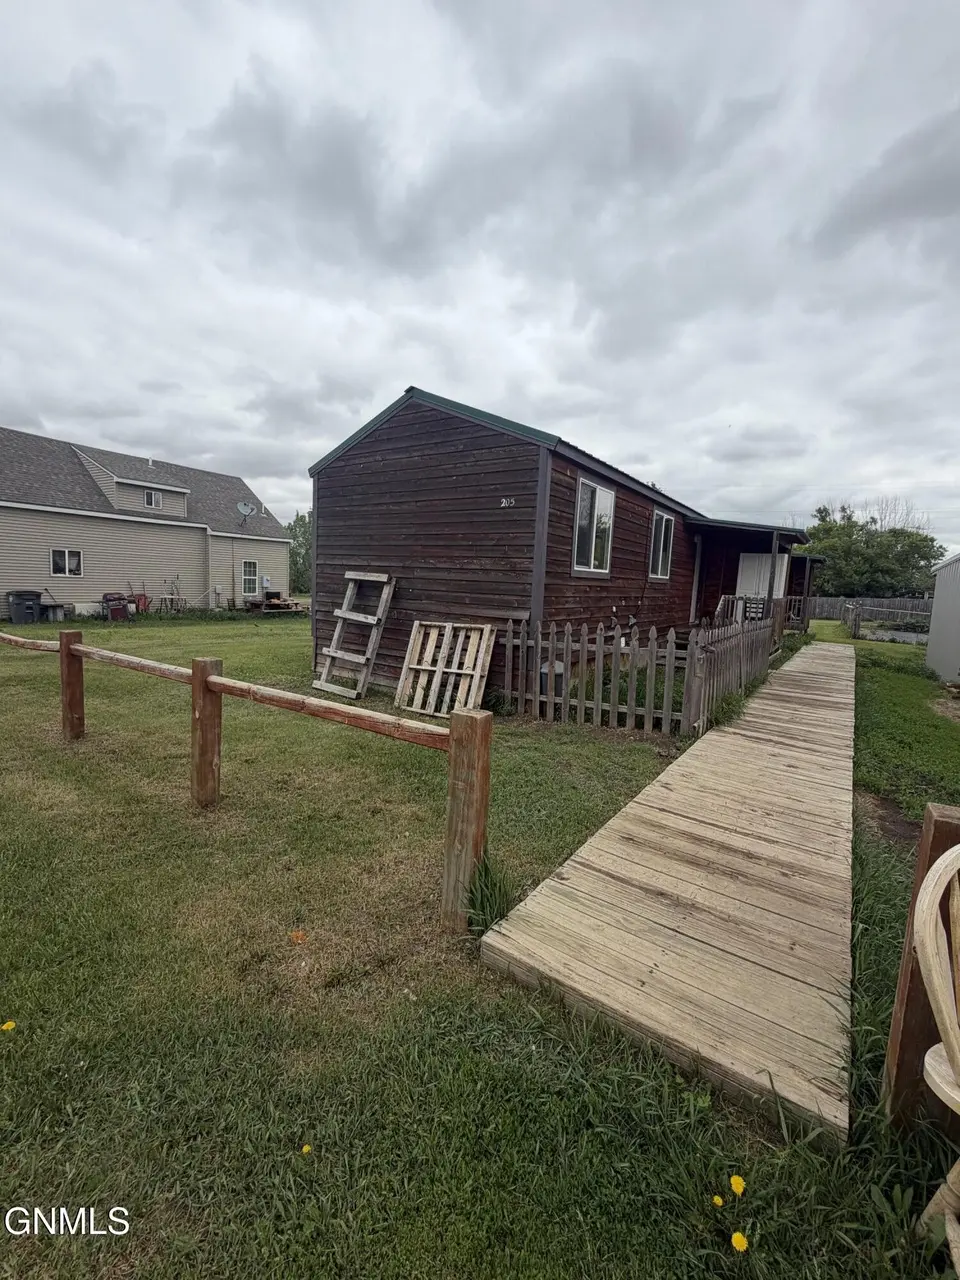
205 Adams St · Noonan, ND
Flood risk 1/10 · Minimal
- FEMA flood zone
- X
- Chance of flooding over 30 yrs
- 0.0%
- Est. flood insurance / yr
- $473 – $860
Fire risk 4/10 · Minor
- Est. fire insurance / yr
- $1,289 – $2,393
Heat risk 1/10 · Minimal
- Hot days now (above 93°F)
- 7 days/yr
- Hot days in 30 yrs
- 13 days/yr
Wind risk 1/10 · Minimal
- Chance of severe wind over 30 yrs
- —
Air-quality risk 6/10 · Moderate
- Unhealthy air days now
- 8 days/yr
- Unhealthy air days in 30 yrs
- 9 days/yr
Risk factors via First Street. Map © Google.
Why this score? — see what drove the B grade
The composite is a weighted blend of 9 inputs, each scored 0–100. Each bar is that input's sub-score; the figure is the points it added to the 100-point composite (weight × sub-score).
- Cash flow +30.0/30.0
- 1% rule +10.0/10.0
- DSCR +10.0/10.0
- ARV discount +7.5/15.0
- Appreciation +5.0/10.0
- Schools +3.4/10.0
- Livability +2.9/5.0
- Rent growth +2.5/5.0
- Condition / age +2.2/5.0
$55,000
🖨 Deal sheet 📄 Offer letter ✓ Due diligence
Key facts
- 7,000 sq ft lot
- Built 2014
- Listed 13 days
Property features AI
Exterior
- Parking: Driveway
- Utilities: Public water; Public sewer; Electricity connected; Water connected; Sewer connected; Cable available; Phone available; Natural gas not available
- Home design: Manufactured on land (single wide); One story
- Construction: Wood siding; Shingle roof; No basement or foundation details listed
- Exterior features: Landscaped, level rectangular lot; Gravel road frontage on a city street; Publicly maintained road
Interior
- Kitchen: Microwave; Oven; Refrigerator
- Flooring: Vinyl; Wood; Laminate
- Bathrooms: Two three-quarter bathrooms
- Heating & cooling: Electric heating; Radiant heating; Wall/window air conditioning units
- Interior features: Vaulted ceilings; Awning(s)
- Laundry & utility: Washer; Dryer
Neighborhood map
What this means for you Summary
Snapshot
- This is a 2-bed/2.0-bath manufactured listed at $55k. Condition is rated fair.
Deal economics
- At list price, monthly cash flow is $497 ($6k/yr) — positive.
- The deal already cash-flows at list — no discount required.
- Meets the 1% rule at list price ($1k rent vs $55k).
Location & tenants
- Location reads 57/100 on livability (#308 in ND) — a working-class tenant base; expect higher turnover. Strengths: cost of living A+; Watch: employment D, health & safety D, schools F.
- Divide County 1 (rural): math 30% / reading 43% proficiency, ranked #121 of 169 in ND (top 72%) — families likely to look elsewhere, expect single-tenant / working-renter base with shorter leases.
- Market conditions: 8 active listings in the ZIP.
Forward outlook
- In year one you build about $2k of equity ($380 loan paydown + $2k appreciation (3.0% local appreciation)).
- Divide County population projected at +85% by 2050 — long-run rental-demand tailwind backs the buy-and-hold thesis.
- At projected returns (3.0% appreciation + 3.0% rent growth), your $15k cash investment doubles in ~2 years — after that, you're playing with house money.
Negotiation context
- Only 14 days on market — expect competitive offers; lowballing is unlikely to land.
Questions for the listing agent
- Have any recent inspections been done? Can we get a copy of the seller's disclosures and any deferred-maintenance estimates?
- Is there a deadline driving the sale (1031 exchange, divorce, estate, relocation)? That informs how much negotiation room exists.
- Schools are F-rated, which usually means shorter tenancies and higher turnover. Who's the typical renter profile here, and what's been the actual vacancy rate?
- What's the average days-on-market for RENTAL listings here right now (not sales)? A rising rental-DOM trend means longer vacancies and softer asking-rent achievability than the comps imply.
- What's the recent tenant-quality profile in this submarket — average credit score on applications, eviction rate, late-payment / NSF rate, and stable-employment percentage? A property-management company in the area should have these aggregated.
- How much new for-sale + rental construction is in the pipeline within 1–3 miles? Heavy new supply typically softens prices + rents 12–24 months out; constrained supply supports both.
Investment metrics
- 1% rule
- 2.02% ✓
- Cap rate
- 17.13%
- Cash-on-cash
- 38.71%
- DSCR
- 2.72
- GRM
- 4.1
CMA / ARV
No comps found within radius.
Projected returns pro-forma
3.0% appreciation · 3.0% rent growth · sell at horizon
- IRR
- 44.2%
- Equity multiple
- 3.49×
- Total profit
- $38,285
- Equity at exit
- $24,730
- IRR
- 44.1%
- Equity multiple
- 6.97×
- Total profit
- $91,977
- Equity at exit
- $38,112
Cash invested: $15,400 (down + closing). Projections, not guarantees.
Landlord ↔ Tenant lean methodology
- Overall (STATE)
- 82 Strongly Landlord-Friendly
- State North Dakota
- 82 Strongly Landlord-Friendly · R+20
- County
- — inherits STATE
- City
- — inherits STATE
ZIP-level market 58765
- Active inventory
- 8
- Price-to-rent
- 4.1×
Monthly cashflow live
- Estimated rent
- $1,110 medium interval (Pro) →
- Mortgage (P&I)
- −$288
- Tax est. 1.5%
- −$69 /mo · $825/yr
- Insurance
- −$23
- HOA
- −$0
- Vacancy / Maint / Mgmt
- −$233
- Net cashflow
- $497
Break-even live
UW: 25.0% down · 7.5% · 30yr · 1.5% tax · 5.0% vac · 8.0% maint · 8.0% mgmt
Financing live
Cash to close
- Down payment
- $13,750
- Closing costs
- $1,650
- Reserves months
- —
- Total cash needed
- —
Loan-product check · same deal, 3 products live
Conventional
25% down · 7.5% · 30yr
- Down + closing
- —
- Monthly P&I
- —
- Monthly cashflow
- —
- DSCR
- —
- Eligible?
- —
Personal DTI + credit; lowest rate.
DSCR
20% down · 8.5% · 30yr
- Down + closing
- —
- Monthly P&I
- —
- Monthly cashflow
- —
- DSCR
- —
- Eligible?
- —
No personal income docs; deal must DSCR.
Hard money
10% down · 12.0% · 12mo
- Down + closing
- —
- Monthly P&I
- —
- Monthly cashflow
- —
- DSCR
- —
- Eligible?
- —
Short-term bridge; refi at stabilization.
Listing history 10 events
-
2026-06-18days on market $55,000 Active 14 DOM
-
2026-06-17days on market $55,000 Active 13 DOM
-
2026-06-16days on market $55,000 Active 12 DOM
-
2026-06-15days on market $55,000 Active 11 DOM
-
2026-06-13days on market $55,000 Active 9 DOM
-
2026-06-12days on market $55,000 Active 8 DOM
-
2026-06-09days on market $55,000 Active 5 DOM
-
2026-06-08days on market $55,000 Active 4 DOM
-
2026-06-07days on market $55,000 Active 3 DOM
-
2026-06-05$55,000 Active 1 DOM
ⓘ Source: listings_history table (triggers on properties + properties_extension) + one-shot
backfill from property_details.listing_events for pre-trigger history.
Climate risk First Street
- Flood 1/10 Low FEMA zone X · 0% chance over 30 yrs
- Wildfire 4/10 Moderate
- Heat 1/10 Low 7 d/yr ≥93°F today · 13 d/yr by 30 yrs out
- Wind 1/10 Low
- Air quality 6/10 Major 8 unhealthy d/yr today · 9 by 30 yrs out
Nearby sold comps map
Loading sold comps map…
Walkable amenities ~0.75 mi
Loading nearby amenities…
Taxation est. · year 1
- Rental income
- $13,320
- − Mortgage interest
- −$3,081
- − Property taxes
- −$825
- − Insurance
- −$275
- − Repairs & maintenance
- −$1,066
- − Management
- −$1,066
- − Depreciation
- −$1,600
- Taxable income
- $5,408
- Est. tax owed @ 24.0%
- −$1,298
- After-tax cash flow
- $4,664/yr
For passive investors: Depreciation is non-cash, so a rental often shows a tax loss while cash-flowing — sheltering income. Rental losses are passive: they offset passive income freely, and up to $25,000/yr can offset ordinary (W-2) income if you actively participate and your MAGI is under $100k (phasing out to $0 by $150k); unused losses carry forward. On sale, claimed depreciation is recaptured at up to 25%, and gains may owe capital-gains tax (a 1031 exchange can defer both). Figures are a year-1 estimate at your 24.0% rate — not tax advice; consult a CPA.
Condition & rehab AI · 13 photos
This manufactured home has a fair condition with average interior and exterior features. Painting and landscaping would significantly enhance its curb appeal and value.
Repairs flagged
- Minor wooden deck — slight wear
- Minor wooden siding — slight wear
Value-add opportunities
- Both painting — enhances curb appeal and interior aesthetics
- Both landscaping — improves curb appeal and enhances property value
Renovation cost estimate screening
| Repair item | Severity | Est. cost |
|---|---|---|
| wooden deck · slight wear | Minor | $500–3,000 |
| wooden siding · slight wear | Minor | $500–3,000 |
| Total estimated repair cost · 2 items | $1,000–6,000 |
Value-add ROI direction
- Both painting — enhances curb appeal and interior aesthetics ↑
- Both landscaping — improves curb appeal and enhances property value ↑
ⓘ Cost ranges are severity-bucket heuristics (US national rule-of-thumb). Get contractor quotes + a written scope before underwriting a rehab budget.
Schools (NCES district)
- District
- Divide County 1
- NCES district ID
- 3805160
- Math proficiency
- 30% ▼ -4.00%
- Reading proficiency
- 43% ▼ -4.00%
- Median HH income
- $52,720
- Composite
- 34.4/100
- National rank
- #10182
- State rank
- #121 of 169 in ND
Livability — Noonan
- Score
- 57/100
- State rank
- #308
- US rank
- #22022
Category grades
Schools grade is shown separately in the Schools card above.
Census & demographics
- Census place
- Noonan, ND
- Population (ZIP)
- 305
Population outlook (Divide County) Hauer SSP2
- Today (2025)
- 3,235 people
- By 2030
- 3,697 · +14.3%
- By 2040
- 4,763 · +47.2%
- By 2050
- 5,975 · +84.7%
- By 2075
- 9,534 · +194.7%
- By 2100
- 12,784 · +295.2%
Race, ethnicity, and origin ACS 2023
- Neighborhood character
- Predominantly White (89%)
- Race & ethnicity
- White 89% Two or more races 10%
- Common ancestry
- Portuguese 42% English 4% Italian 3%
- Foreign-born
- 6% · Canada
- Languages at home
- 99% English-only · Other Asian/Pacific 1%
Political lean MEDSL · Divide
- 2024 margin
- Solid R (+55.4) · D 21.2% · R 76.5% · Other 2.3%
- 2008→2024 swing
- -40.7pp toward R · 2008: -14.7pp · 2024: -55.4pp
- All cycles
- 2024: R+55.4 2020: R+53.2 2016: R+52.0 2012: R+30.3 2008: R+14.7
Not yet ingested
- Civics
- —
Market trends
- HPI YoY
- —
- Current HPI
- —
- Rent YoY
- —
- Metro
- —
- State GDP YoY
- ▲ 2.09%
- F500 in state
- 2
Industry mix (Fortune 500 HQ in ND)
| Industry | F500 HQs | Revenue |
|---|---|---|
| Utilities / Construction | 1 | $6B |
|
||
Price history
1 event — show timeline
- 2026-06-04 Listed $55,000 GNMLS
Cash-flow waterfall
monthlySold comps — $/sqft
last 12 mo · ≤1 miLoading sold comps…