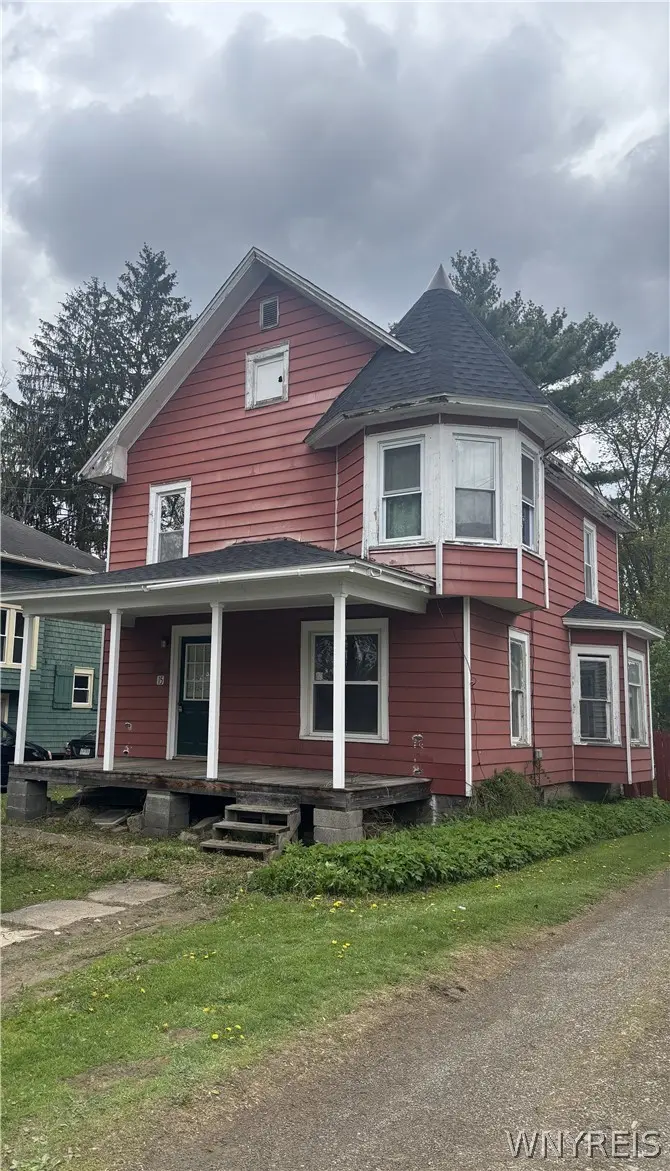
15 Washburn Ave · Franklinville, NY
Flood risk 1/10 · Minimal
- FEMA flood zone
- X
- Chance of flooding over 30 yrs
- 0.0%
- Est. flood insurance / yr
- $473 – $860
Fire risk 1/10 · Minimal
- Est. fire insurance / yr
- $691 – $1,283
Heat risk 1/10 · Minimal
- Hot days now (above 88°F)
- 7 days/yr
- Hot days in 30 yrs
- 18 days/yr
Wind risk 1/10 · Minimal
- Chance of severe wind over 30 yrs
- —
Air-quality risk 2/10 · Minimal
- Unhealthy air days now
- 0 days/yr
- Unhealthy air days in 30 yrs
- 1 days/yr
Risk factors via First Street. Map © Google.
Why this score? — see what drove the B+ grade
The composite is a weighted blend of 9 inputs, each scored 0–100. Each bar is that input's sub-score; the figure is the points it added to the 100-point composite (weight × sub-score).
- Cash flow +30.0/30.0
- 1% rule +10.0/10.0
- DSCR +10.0/10.0
- Appreciation +8.0/10.0
- ARV discount +7.5/15.0
- Schools +4.9/10.0
- Livability +3.1/5.0
- Rent growth +2.5/5.0
- Condition / age +2.5/5.0
$45,000
🖨 Deal sheet (PDF) 📄 Offer letter ✓ Due diligence
Listing remarks
Attention investors and DIY enthusiasts! This 3-bedroom, 1-bath home is a true diamond in the rough, offering a prime opportunity to build massive sweat equity. While the interior is a blank canvas awaiting your creative vision and mechanical updates, the most important "big ticket" item is already done—a brand-new roof was professionally installed in 2024. Featuring a solid block foundation, full basement, and a spacious 2-story layout, this property provides the structural bones needed for a successful transformation. Located on a central village lot in an agricultural district, you’re just steps away from local schools and amenities. Whether you're looking for yo
Key facts
- Brand new roof
- Full basement
- Central village lot
Tags
Property features AI
Exterior
- Parking: No garage
- Utilities: Public water connected; Sewer connected
- Home design: Two-story house; Existing/resale property
- Construction: Aluminum siding; Block foundation
- Exterior features: Dirt driveway; Rectangular lot; Agricultural zoning/character
Interior
- Kitchen: Country-style kitchen; Breakfast bar; Refrigerator
- Bedrooms: Total rooms: 9 (includes entry foyer and other rooms)
- Flooring: Hardwood; Varies
- Bathrooms: 1 full bathroom
- Heating & cooling: Gas forced-air heating
- Interior features: Entrance foyer; Breakfast bar; Country kitchen; Full basement
- Laundry & utility: Gas water heater
Neighborhood map
What this means for you Summary
Snapshot
- This is a 3-bed/1.0-bath single-family listed at $45k.
Deal economics
- At list price, monthly cash flow is $535 ($6k/yr) — positive.
- The deal already cash-flows at list — no discount required.
- Meets the 1% rule at list price ($1k rent vs $45k).
- Recommended offer: $44k (3.0% below list) — sets the bar for market timing.
Location & tenants
- Location reads 62/100 on livability (#856 in NY) — a middle-class / working-renter tenant base. Strengths: cost of living A+, housing A+, crime A-; Watch: employment C-, schools D+, amenities F.
- Franklinville Central School District (rural): math 60% / reading 57% proficiency, ranked #281 of 590 in NY (top 48%) — acceptable for families but not a draw, mixed tenant base, ~2y average lease.
- Market conditions: 33 active listings in the ZIP; 128 units permitted in Cattaraugus County in 2024 (21 in 5+ unit buildings).
Forward outlook
- In year one you build about $3k of equity ($311 loan paydown + $3k appreciation (5.9% local appreciation)).
- Cattaraugus County population projected at -28% by 2050 — secular population decline; favor cash flow + early exit over multi-decade hold.
- At projected returns (5.9% appreciation + 3.0% rent growth), your $13k cash investment doubles in ~2 years — after that, you're playing with house money.
- By year 10, paydown + projected appreciation supports a ~$31k cash-out refi (75% LTV) — recoverable capital for the next deal without selling this one.
Negotiation context
- It's been on market 46 days — a 3% lower offer ($44k) is reasonable based on typical stale-listing flexibility.
- Current owner paid $17k; list at $45k implies a 165% gain — meaningful room to come down on a strong offer.
Risks & watch-outs
- Watch-outs: built in 1920 — expect roof / HVAC / electrical / plumbing capex.
Questions for the listing agent
- It's been on market 46 days. Have you received any prior offers? Is the seller open to a 3% concession, seller financing, or rate buy-down credit?
- Built in 1920 — when were the roof, HVAC, electrical panel, plumbing, and water heater last replaced?
- Is there a deadline driving the sale (1031 exchange, divorce, estate, relocation)? That informs how much negotiation room exists.
- Schools are D-rated, which usually means shorter tenancies and higher turnover. Who's the typical renter profile here, and what's been the actual vacancy rate?
- What's the average days-on-market for RENTAL listings here right now (not sales)? A rising rental-DOM trend means longer vacancies and softer asking-rent achievability than the comps imply.
- What's the recent tenant-quality profile in this submarket — average credit score on applications, eviction rate, late-payment / NSF rate, and stable-employment percentage? A property-management company in the area should have these aggregated.
- How much new for-sale + rental construction is in the pipeline within 1–3 miles? Heavy new supply typically softens prices + rents 12–24 months out; constrained supply supports both.
Investment metrics
- 1% rule
- 2.38% ✓
- Cap rate
- 20.55%
- Cash-on-cash
- 50.93%
- DSCR
- 3.27
- GRM
- 3.5
CMA / ARV
- ARV (median comp)
- $127,222
- List price
- $45,000
- Delta
- -64.63%
- Verdict
- UNDERPRICED
- Comps
- 20 within 1.0 mi
Show comp detail 7 sales within ~0.75 mi
| Address | Dist | Beds/Ba | Sqft | Sold | Price | $/sf | Match |
|---|---|---|---|---|---|---|---|
| 25 Riggs St | 0.27mi | 3/1.0 | 1,248 (+9%) | 7mo | $129,000 | $103 | 67 |
| 34 Church St | 0.24mi | 3/1.5 | 1,268 (+11%) | 10mo | $158,000 | $125 | 61 |
| 12 Mill St | 0.47mi | 3/1.5 | 1,128 (-1%) | 18mo | $155,000 | $137 | 59 |
| 30 Howard St | 0.16mi | 3/1.0 | 987 (-14%) | 13mo | $111,000 | $112 | 59 |
| 4 4th Ave | 0.46mi | 2/1.5 (-1) | 1,065 (-7%) | 9mo | $90,100 | $85 | 52 |
| 7829 Pine St | 0.41mi | 2/1.0 (-1) | 1,016 (-11%) | 17mo | $121,500 | $120 | 43 |
| 16 Pennsylvania Ave | 0.51mi | 3/1.0 | 1,302 (+14%) | 14mo | $109,900 | $84 | 42 |
Match score weights: distance 35% · size 25% · config 20% · recency 20%. Top-matched comps best support the ARV.
Projected returns pro-forma
5.93% appreciation · 3.0% rent growth · sell at horizon
- IRR
- 59.6%
- Equity multiple
- 4.72×
- Total profit
- $46,876
- Equity at exit
- $28,085
- IRR
- 56.5%
- Equity multiple
- 9.83×
- Total profit
- $111,297
- Equity at exit
- $50,755
Cash invested: $12,600 (down + closing). Projections, not guarantees.
Landlord ↔ Tenant lean methodology
- Overall (STATE)
- 15 Strongly Tenant-Friendly
- State New York
- 15 Strongly Tenant-Friendly · D+10
- County
- — inherits STATE
- City
- — inherits STATE
ZIP-level market 14737
- Home prices YoY
- 2.0%
- Active inventory
- 33
- Price-to-rent
- 3.5×
Monthly cashflow live
- Estimated rent
- $1,071 medium interval (Pro) →
- Mortgage (P&I)
- −$236
- Tax est. 1.5%
- −$56 /mo · $675/yr
- Insurance
- −$19
- HOA
- −$0
- Vacancy / Maint / Mgmt
- −$225
- Net cashflow
- $535
Break-even live
Sensitivity live
| Price | -10% $566 | -5% $550 | +0% $535 | +5% $519 | +10% $504 |
|---|---|---|---|---|---|
| Rent | -10% $450 | -5% $492 | +0% $535 | +5% $577 | +10% $619 |
| Rate | -1.0pp $557 | -0.5pp $546 | base $535 | +0.5pp $523 | +1.0pp $511 |
UW: 25.0% down · 7.5% · 30yr · 1.5% tax · 5.0% vac · 8.0% maint · 8.0% mgmt
Financing live
Cash to close
- Down payment
- $11,250
- Closing costs
- $1,350
- Reserves months
- —
- Total cash needed
- —
Loan-product check · same deal, 3 products live
Conventional
25% down · 7.5% · 30yr
- Down + closing
- —
- Monthly P&I
- —
- Monthly cashflow
- —
- DSCR
- —
- Eligible?
- —
Personal DTI + credit; lowest rate.
DSCR
20% down · 8.5% · 30yr
- Down + closing
- —
- Monthly P&I
- —
- Monthly cashflow
- —
- DSCR
- —
- Eligible?
- —
No personal income docs; deal must DSCR.
Hard money
10% down · 12.0% · 12mo
- Down + closing
- —
- Monthly P&I
- —
- Monthly cashflow
- —
- DSCR
- —
- Eligible?
- —
Short-term bridge; refi at stabilization.
Listing history 17 events
-
2026-06-21days on market $45,000 Active 46 DOM
-
2026-06-18days on market $45,000 Active 44 DOM
-
2026-06-17days on market $45,000 Active 43 DOM
-
2026-06-16days on market $45,000 Active 42 DOM
-
2026-06-15days on market $45,000 Active 41 DOM
-
2026-06-13days on market $45,000 Active 39 DOM
-
2026-06-12days on market $45,000 Active 38 DOM
-
2026-06-09days on market $45,000 Active 35 DOM
-
2026-06-08days on market $45,000 Active 34 DOM
-
2026-06-07days on market $45,000 Active 33 DOM
-
2026-06-07days on market $45,000 Active 32 DOM
-
2026-06-04days on market $45,000 Active 29 DOM
-
2026-06-02days on market $45,000 Active 28 DOM
-
2026-06-01days on market $45,000 Active 27 DOM
-
2026-05-31days on market $45,000 Active 26 DOM
-
2026-05-05$45,000 Active 803-char remark
-
2010-09-15soldstatus $17,000
ⓘ Source: listings_history table (triggers on properties + properties_extension) + one-shot
backfill from property_details.listing_events for pre-trigger history.
Climate risk First Street
- Flood 1/10 Low FEMA zone X · 0% chance over 30 yrs
- Wildfire 1/10 Low
- Heat 1/10 Low 7 d/yr ≥88°F today · 18 d/yr by 30 yrs out
- Wind 1/10 Low
- Air quality 2/10 Low 0 unhealthy d/yr today · 1 by 30 yrs out
Nearby sold comps map
Loading sold comps map…
Walkable amenities ~0.75 mi
Loading nearby amenities…
Taxation est. · year 1
- Rental income
- $12,847
- − Mortgage interest
- −$2,521
- − Property taxes
- −$675
- − Insurance
- −$225
- − Repairs & maintenance
- −$1,028
- − Management
- −$1,028
- − Depreciation
- −$1,309
- Taxable income
- $6,061
- Est. tax owed @ 24.0%
- −$1,455
- After-tax cash flow
- $4,962/yr
For passive investors: Depreciation is non-cash, so a rental often shows a tax loss while cash-flowing — sheltering income. Rental losses are passive: they offset passive income freely, and up to $25,000/yr can offset ordinary (W-2) income if you actively participate and your MAGI is under $100k (phasing out to $0 by $150k); unused losses carry forward. On sale, claimed depreciation is recaptured at up to 25%, and gains may owe capital-gains tax (a 1031 exchange can defer both). Figures are a year-1 estimate at your 24.0% rate — not tax advice; consult a CPA.
Schools (NCES district)
- District
- Franklinville Central School District
- NCES district ID
- 3611490
- Math proficiency
- 60% ▲ 11.00%
- Reading proficiency
- 57% ▲ 16.00%
- Median HH income
- $41,110
- Composite
- 49.0/100
- National rank
- #2068
- State rank
- #281 of 590 in NY
Livability — Franklinville
- Score
- 62/100
- State rank
- #856
- US rank
- #16514
Category grades
Schools grade is shown separately in the Schools card above.
Census & demographics
- Census place
- Franklinville, NY
- Population (ZIP)
- 4,071
Population outlook (Cattaraugus County) Hauer SSP2
- Today (2025)
- 71,623 people
- By 2030
- 67,751 · -5.4%
- By 2040
- 59,488 · -16.9%
- By 2050
- 51,601 · -28.0%
- By 2075
- 35,025 · -51.1%
- By 2100
- 21,243 · -70.3%
Race, ethnicity, and origin ACS 2023
- Neighborhood character
- Predominantly White (85%)
- Race & ethnicity
- White 85% Two or more races 9% Hispanic / Latino 5% Native American 1%
- Common ancestry
- Romanian 10% Iranian 2% Lithuanian 2%
- Foreign-born
- 2% · Canada
- Languages at home
- 97% English-only · German/W. Germanic 1%
Political lean MEDSL · Cattaraugus
- 2024 margin
- Solid R (+32.8) · D 33.6% · R 66.4%
- 2008→2024 swing
- -22.2pp toward R · 2008: -10.6pp · 2024: -32.8pp
- All cycles
- 2024: R+32.8 2020: R+29.5 2016: R+34.4 2012: R+13.4 2008: R+10.6
Not yet ingested
- Civics
- —
Market trends
- HPI YoY
- ▲ 5.93%
- Current HPI
- 305.4492
- Rent YoY
- —
- Metro
- —
- State GDP YoY
- ▲ 2.60%
- F500 in state
- 92
Industry mix (Fortune 500 HQ in NY)
| Industry | F500 HQs | Revenue |
|---|---|---|
| Financial Services | 10 | $950B |
|
||
| Consumer Goods | 9 | $162B |
|
||
| Insurance | 4 | $225B |
|
||
| Telecommunications | 2 | $144B |
|
||
| Pharmaceuticals | 2 | $112B |
|
||
| Media / Entertainment | 2 | $69B |
|
||
Price history
+164.7% since first listed2 events — show timeline
- 2026-05-05 Listed $45,000 WNYREIS
- 2010-09-15 Sold (Public Records) $17,000 Public Records
Property tax history
+2.0%/yrLatest (2025): $2,374 · +2.5% YoY. Source: county tax records.
Cash-flow waterfall
monthlySold comps — $/sqft
last 12 mo · ≤1 miLoading sold comps…