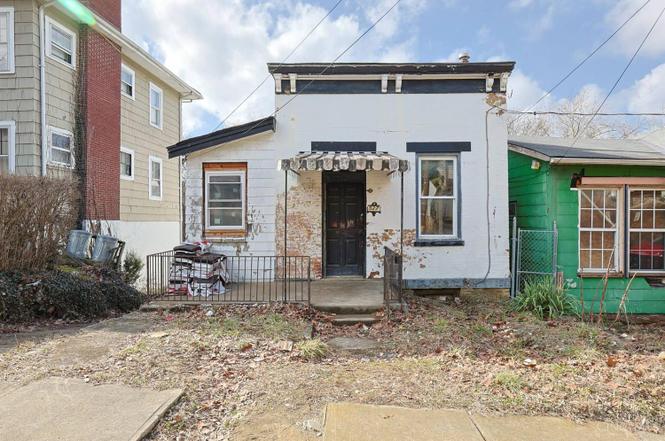
527 Glenwood Ave · Cincinnati, OH
Flood risk 1/10 · Minimal
- FEMA flood zone
- X (unshaded)
- Chance of flooding over 30 yrs
- 0.0%
- Est. flood insurance / yr
- $473 – $860
Fire risk 1/10 · Minimal
- Est. fire insurance / yr
- $713 – $1,323
Heat risk 4/10 · Minor
- Hot days now (above 103°F)
- 7 days/yr
- Hot days in 30 yrs
- 19 days/yr
Wind risk 2/10 · Minimal
- Chance of severe wind over 30 yrs
- 1.0%
Air-quality risk 3/10 · Minor
- Unhealthy air days now
- 2 days/yr
- Unhealthy air days in 30 yrs
- 3 days/yr
Risk factors via First Street. Map © Google.
Why this score? — see what drove the B grade
The composite is a weighted blend of 9 inputs, each scored 0–100. Each bar is that input's sub-score; the figure is the points it added to the 100-point composite (weight × sub-score).
- Cash flow +30.0/30.0
- 1% rule +10.0/10.0
- DSCR +10.0/10.0
- ARV discount +7.5/15.0
- Livability +4.0/5.0
- Rent growth +3.9/5.0
- Schools +2.5/10.0
- Condition / age +2.5/5.0
- Appreciation +0.0/10.0
$52,000
🖨 Deal sheet 📄 Offer letter ✓ Due diligence
Listing remarks MLS
Investors! Located steps from the University and Cincinnati Children's Hospitals, this partially framed property sits in a desirable section of Avondale. Perfect for knowledgeable investors next investment, this site offers unmatched location appeal paired with a blank slate ready for your vision. Some framing work has been started in many rooms, additionally some new wiring and plumbing has been run, lead pipes removed, and drains cleared. All of this giving you a head start - but the real value lies in the total remodel potential. Nearby revitalized homes, thriving campuses, and an active rental market give a rare chance to create a customized masterpiece in the heart of it all.
Key facts
- Drains cleared
- Lead pipes removed
- 4,966 sq ft lot
Tags
Property features AI
Finance
- Other: Lot approximately 0.114 acres (about 30 x 164); Second floor area listed as 720
- HOA & community: No HOA
Exterior
- Parking: Driveway
- Utilities: Public water; Public sewer; Gas at street
- Home design: Traditional single-family home; Two levels; Stone foundation
- Construction: Brick and wood siding construction
- Exterior features: Shingle roof; Double-hung vinyl windows; One inoperable fireplace
Interior
- Kitchen: Kitchen (9 x 12)
- Bedrooms: Two bedrooms total; Primary bedroom on level 1 (14 x 13); Second bedroom on level 2 (14 x 13)
- Bathrooms: Two full bathrooms; Full bath on level 1; Full bath on level 2
- Heating & cooling: Forced air heating
- Interior features: Six total rooms; Partial basement
Neighborhood map
What this means for you Summary
Snapshot
- This is a 2-bed/1.0-bath single-family listed at $52k.
Deal economics
- At list price, monthly cash flow is $1k ($13k/yr) — positive.
- The deal already cash-flows at list — no discount required.
- Meets the 1% rule at list price ($2k rent vs $52k).
- Recommended offer: $49k (6.0% below list) — sets the bar for market timing.
- Cap rate 32.1% vs local median 3.9% in Cincinnati — top-decile yield for the area; either an underpriced asset or a hidden risk that comps aren't pricing in. Stress-test before assuming the spread holds.
Location & tenants
- Location reads 80/100 on livability (#130 in OH, #1,856 nationally) — a professional / high-income tenant draw. Strengths: amenities A+, commute A+, cost of living A+; Watch: employment D, crime F.
- Cincinnati Public Schools (urban): math 25% / reading 36% proficiency, ranked #581 of 656 in OH (top 89%) — families likely to look elsewhere, expect single-tenant / working-renter base with shorter leases; 70% free/reduced lunch — lower-income household profile, screen leases tightly.
- Market conditions: Rents rising fast (+5.5%/yr); 49 active listings in the ZIP; 13 comparable units currently listed for rent nearby; rentals leasing fast (median 4d on market — plan ~1-2 weeks tenant-placement turnaround); lower-income renter base — watch delinquency; 801 units permitted in Hamilton County in 2024 (190 in 5+ unit buildings).
- At $1,879/mo this rent would consume 70% of the median local household income ($32k/yr) (locally 1730% of renters already pay >50% of income on rent) — very limited rent-growth headroom before tenants either downsize or default.
Forward outlook
- Local home prices are declining (-3.0%/yr); year-one equity from $360 of loan paydown is wiped out by about $2k of value loss. Plan a longer hold.
- At projected returns (-3.0% appreciation + 5.5% rent growth), your $15k cash investment doubles in ~2 years — after that, you're playing with house money.
Negotiation context
- It's been on market 88 days — a 6% lower offer ($49k) is reasonable based on typical stale-listing flexibility.
- 6 sale attempts since 22y ago; this cycle's ask is 24% above the opening price — seller raised mid-cycle; expect resistance to lowballs.
- Current owner paid $20k; list at $52k implies a 160% gain — meaningful room to come down on a strong offer.
Risks & watch-outs
- Watch-outs: built in 1890 — expect roof / HVAC / electrical / plumbing capex.
Questions for the listing agent
- It's been on market 88 days. Have you received any prior offers? Is the seller open to a 6% concession, seller financing, or rate buy-down credit?
- Built in 1890 — when were the roof, HVAC, electrical panel, plumbing, and water heater last replaced?
- Why hasn't it sold? Are there any deal-killer items the seller is aware of (foundation, flood, title, zoning, code violations)?
- Is there a deadline driving the sale (1031 exchange, divorce, estate, relocation)? That informs how much negotiation room exists.
- Schools are B-rated — typically a magnet for longer-tenancy family renters. What's the average tenant stay here, and is there a school-zone premium baked into asking?
- Crime grade is F in this area — have there been break-ins, vandalism, or insurance claims at this property in the last 3 years? What carrier currently insures it and at what premium?
- What's the average days-on-market for RENTAL listings here right now (not sales)? A rising rental-DOM trend means longer vacancies and softer asking-rent achievability than the comps imply.
- What's the recent tenant-quality profile in this submarket — average credit score on applications, eviction rate, late-payment / NSF rate, and stable-employment percentage? A property-management company in the area should have these aggregated.
- How much new for-sale + rental construction is in the pipeline within 1–3 miles? Heavy new supply typically softens prices + rents 12–24 months out; constrained supply supports both.
Investment metrics
- 1% rule
- 3.61% ✓
- Cap rate
- 32.10%
- Cash-on-cash
- 92.16%
- DSCR
- 5.10
- GRM
- 2.3
CMA / ARV
- ARV (on-the-fly)
- $260,360
- Comps found
- 11
Show comp detail 11 sales within ~0.75 mi
| Address | Dist | Beds/Ba | Sqft | Sold | Price | $/sf | Match |
|---|---|---|---|---|---|---|---|
| 527 Glenwood Ave | 0.00mi | 2/1.0 | 2,264 (0%) | 6mo | $20,000 | $9 | 95 |
| 525 Glenwood Ave | 0.00mi | 3/2.0 (+1) | 2,142 (-5%) | 5mo | $20,000 | $9 | 78 |
| 3539 Eden Ave | 0.40mi | 3/2.5 (+1) | 2,398 (+6%) | 1mo | $475,000 | $198 | 60 |
| 3551 Eden Ave | 0.41mi | 3/2.5 (+1) | 2,398 (+6%) | 1mo | $475,000 | $198 | 59 |
| 3625 Canyon Dr | 0.21mi | 3/2.0 (+1) | 2,520 (+11%) | 6mo | $380,000 | $151 | 57 |
| 3535 Eden Ave | 0.41mi | 3/2.5 (+1) | 2,070 (-9%) | 2mo | $499,000 | $241 | 54 |
| 3541 Eden Ave | 0.44mi | 3/2.5 (+1) | 2,398 (+6%) | 13mo | $499,000 | $208 | 48 |
| 3973 Parker Pl | 0.72mi | 2/1.5 | 2,037 (-10%) | 11mo | $235,000 | $115 | 38 |
| 209 Wedgewood Ave | 0.65mi | 3/2.0 (+1) | 1,929 (-15%) | 7mo | $150,000 | $78 | 30 |
| 3961 Wess Park Dr | 0.70mi | 3/1.5 (+1) | 2,461 (+9%) | 24mo | $270,000 | $110 | 26 |
| 3528 Irving St | 0.58mi | 3/1.0 (+1) | 1,950 (-14%) | 24mo | $150,000 | $77 | 25 |
Match score weights: distance 35% · size 25% · config 20% · recency 20%. Top-matched comps best support the ARV.
Projected returns pro-forma
-3.0% appreciation · 5.55% rent growth · sell at horizon
- IRR
- 95.8%
- Equity multiple
- 5.65×
- Total profit
- $67,768
- Equity at exit
- $7,753
- IRR
- 99.0%
- Equity multiple
- 12.83×
- Total profit
- $172,223
- Equity at exit
- $4,496
Cash invested: $14,560 (down + closing). Projections, not guarantees.
Landlord ↔ Tenant lean methodology
- Overall (STATE)
- 73 Landlord-Friendly
- State Ohio
- 73 Landlord-Friendly · R+6
- County
- — inherits STATE
- City
- — inherits STATE
ZIP-level market 45229
- Home prices YoY
- -24.0%
- Rents YoY
- 5.5%
- Active inventory
- 49
- Price-to-rent
- 2.3×
Monthly cashflow live
- Estimated rent
- $1,879 high interval (Pro) →
- Mortgage (P&I)
- −$273
- Tax from tax record
- −$72 /mo · $863/yr
- Insurance
- −$22
- HOA
- −$0
- Vacancy / Maint / Mgmt
- −$395
- Net cashflow
- $1,118
Break-even live
UW: 25.0% down · 7.5% · 30yr · 1.5% tax · 5.0% vac · 8.0% maint · 8.0% mgmt
Financing live
Cash to close
- Down payment
- $13,000
- Closing costs
- $1,560
- Reserves months
- —
- Total cash needed
- —
Loan-product check · same deal, 3 products live
Conventional
25% down · 7.5% · 30yr
- Down + closing
- —
- Monthly P&I
- —
- Monthly cashflow
- —
- DSCR
- —
- Eligible?
- —
Personal DTI + credit; lowest rate.
DSCR
20% down · 8.5% · 30yr
- Down + closing
- —
- Monthly P&I
- —
- Monthly cashflow
- —
- DSCR
- —
- Eligible?
- —
No personal income docs; deal must DSCR.
Hard money
10% down · 12.0% · 12mo
- Down + closing
- —
- Monthly P&I
- —
- Monthly cashflow
- —
- DSCR
- —
- Eligible?
- —
Short-term bridge; refi at stabilization.
Rent comps 13 comps
| Address | Beds | Baths | Sqft | Rent | $/sqft | DOM | Units | Dist |
|---|---|---|---|---|---|---|---|---|
| 3564 Estes Pl Unit 2 Cincinnati, OH | 3.0 | 1.0 | 1662 | $1,500 | $0.90 | 1d | 1 | 0.26mi |
| 811 Lexington Ave Unit 1 Cincinnati, OH | 2.0 | 1.0 | 1674 | $1,250 | $0.75 | 4d | 1 | 0.47mi |
| 979 Burton Ave Cincinnati, OH | 3.0 | 1.0 | 1725 | $1,595 | $0.92 | 3d | 1 | 0.75mi |
| 3139 Gaff Ave Cincinnati, OH | 3.0 | 2.0 | 1711 | $1,795 | $1.05 | 16d | 1 | 1.03mi |
| 242 Stetson St Unit NA Cincinnati, OH | 3.0 | 2.5 | 2300 | $3,500 | $1.52 | 21d | 1 | 1.05mi |
| 961 Avondale Ave Cincinnati, OH | 2.0 | 1.0 | 1800 | $2,200 | $1.22 | 2d | 1 | 1.10mi |
| 850 Lincoln Ave Unit 2 Cincinnati, OH | 3.0 | 2.5 | 2465 | $2,400 | $0.97 | 23d | 1 | 1.22mi |
| 1607 Asmann Ave Cincinnati, OH | 1.0–4.0 | 1.0–1.5 | 1069 | $1,162 | $1.09 | 12d | 6 | 1.27mi |
| 2611 May St Cincinnati, OH | 2.0 | 2.5 | 1637 | $3,070 | $1.88 | 13d | 1 | 1.44mi |
| 3404 Whitfield Ave Cincinnati, OH | 2.0 | 1.0 | 1291 | $1,595 | $1.23 | 4d | 55 | 1.45mi |
| 651 William Howard Taft Rd Cincinnati, OH | 2.0 | 2.5 | 1637 | $3,070 | $1.88 | 23d | 1 | 1.46mi |
| 2601 May St Cincinnati, OH | 2.0–3.0 | 2.5–3.5 | 1737 | $2,595 | $1.49 | 1d | 12 | 1.49mi |
| 3116 Woodburn Ave Cincinnati, OH | 2.0 | 2.5 | 2110 | $3,500 | $1.66 | 4d | 1 | 1.50mi |
Listing history 10 events
-
2026-06-18days on market $52,000 Active 88 DOM
-
2026-06-17days on market $52,000 Active 87 DOM
-
2026-06-16days on market $52,000 Active 86 DOM
-
2026-06-15days on market $52,000 Active 85 DOM
-
2026-06-13days on market $52,000 Active 83 DOM
-
2026-06-13days on market $52,000 Active 82 DOM
-
2026-06-09days on market $52,000 Active 79 DOM
-
2026-06-08days on market $52,000 Active 78 DOM
-
2026-06-07remarks 699-char remark
-
2026-06-07$52,000 Active 77 DOM
ⓘ Source: listings_history table (triggers on properties + properties_extension) + one-shot
backfill from property_details.listing_events for pre-trigger history.
Tax reassessment forecast OH · Partial reset (capped growth)
- Current annual tax
- $863 · $72/mo
- Projected year-2 tax
- $863 · $72/mo
- Expected delta
- $0/yr ($0/mo · 0.0%)
ⓘ Screening estimate from a state-policy table — verify with the county assessor before closing.
Climate risk First Street
- Flood 1/10 Low FEMA zone X (unshaded) · 0% chance over 30 yrs
- Wildfire 1/10 Low
- Heat 4/10 Moderate 7 d/yr ≥103°F today · 19 d/yr by 30 yrs out
- Wind 2/10 Low 100% chance of damaging wind over 30 yrs
- Air quality 3/10 Moderate 2 unhealthy d/yr today · 3 by 30 yrs out
Nearby sold comps map
Loading sold comps map…
Walkable amenities ~0.75 mi
Loading nearby amenities…
Taxation est. · year 1
- Rental income
- $22,548
- − Mortgage interest
- −$2,913
- − Property taxes
- −$863
- − Insurance
- −$260
- − Repairs & maintenance
- −$1,804
- − Management
- −$1,804
- − Depreciation
- −$1,513
- Taxable income
- $13,392
- Est. tax owed @ 24.0%
- −$3,214
- After-tax cash flow
- $10,204/yr
For passive investors: Depreciation is non-cash, so a rental often shows a tax loss while cash-flowing — sheltering income. Rental losses are passive: they offset passive income freely, and up to $25,000/yr can offset ordinary (W-2) income if you actively participate and your MAGI is under $100k (phasing out to $0 by $150k); unused losses carry forward. On sale, claimed depreciation is recaptured at up to 25%, and gains may owe capital-gains tax (a 1031 exchange can defer both). Figures are a year-1 estimate at your 24.0% rate — not tax advice; consult a CPA.
Schools (NCES district)
- District
- Cincinnati Public Schools
- NCES district ID
- 3904375
- Math proficiency
- 25% ▼ -19.00%
- Reading proficiency
- 36% ▼ -14.00%
- Median HH income
- $35,743
- Composite
- 25.21/100
- National rank
- #7508
- State rank
- #581 of 656 in OH
Livability — Cincinnati
- Score
- 80/100
- State rank
- #130
- US rank
- #1856
Category grades
Schools grade is shown separately in the Schools card above.
Census & demographics
- Census place
- Cincinnati, OH
- County
- Hamilton County · 701,295 people
- City population
- 505,555
- Metro
- Cincinnati, OH-KY-IN
- Population (ZIP)
- 13,529
- Household income
- $32,263
- Rent vs Own
- Severe rent burden
- 1730.0
Population outlook (Hamilton County) Hauer SSP2
- Today (2025)
- 826,054 people
- By 2030
- 830,947 · +0.6%
- By 2040
- 832,319 · +0.8%
- By 2050
- 822,428 · -0.4%
- By 2075
- 788,688 · -4.5%
- By 2100
- 710,674 · -14.0%
Race, ethnicity, and origin ACS 2023
- Neighborhood character
- Predominantly Black (65%)
- Race & ethnicity
- Black 65% White 24% Two or more races 5% Hispanic / Latino 4% Asian 1%
- Common ancestry
- Italian 2% Iranian 1% Lithuanian 1%
- Foreign-born
- 5% · Canada
- Languages at home
- 93% English-only · Spanish 4% Russian/Polish/Slavic 1% Other Indo-European 1%
Political lean MEDSL · Hamilton
- 2024 margin
- D (+14.9) · D 57.0% · R 42.1%
- 2008→2024 swing
- +7.9pp toward D · 2008: 7.0pp · 2024: 14.9pp
- All cycles
- 2024: D+14.9 2020: D+15.9 2016: D+9.5 2012: D+4.9 2008: D+7.0
Not yet ingested
- Civics
- —
Market trends
- HPI YoY
- ▼ -80.34%
- Current HPI
- 254.492
- Rent YoY
- ▲ 5.55%
- Metro
- Cincinnati, OH-KY-IN
- State GDP YoY
- ▲ 1.98%
- F500 in state
- 48
Industry mix (Fortune 500 HQ in OH)
| Industry | F500 HQs | Revenue |
|---|---|---|
| Insurance | 3 | $145B |
|
||
| Industrial Machinery | 3 | $49B |
|
||
| Financial Services | 3 | $24B |
|
||
| Consumer Goods | 2 | $93B |
|
||
| Aerospace / Defense | 2 | $47B |
|
||
| Utilities | 2 | $33B |
|
||
Price history
+126.1% since first listed17 events — show timeline
- 2026-06-04 Relisted — Cincy MLS
- 2026-06-04 Price Changed $52,000 Cincy MLS
- 2026-05-05 Listing Removed — Cincy MLS
- 2026-04-13 Relisted — Cincy MLS
- 2026-03-10 Contingent — Cincy MLS
- 2026-02-20 Listed $42,000 Cincy MLS
- 2025-12-30 Sold (MLS) $20,000 Cincy MLS
- 2025-12-29 Contingent — Cincy MLS
- 2025-12-05 Price Changed $29,000 Cincy MLS
- 2025-11-07 Price Changed $32,000 Cincy MLS
- 2025-10-03 Price Changed $37,000 Cincy MLS
- 2025-09-02 Price Changed $39,500 Cincy MLS
- 2025-07-30 Listed $47,500 Cincy MLS
- 2022-08-25 Listing Removed — Cincy MLS
- 2022-06-07 Listed $95,000 Cincy MLS
- 2004-09-01 Sold (MLS) $16,000 Cincy MLS
- 2004-08-02 Listed $23,000 Cincy MLS
Property tax history
+4.4%/yrLatest (2025): $863 · +0.1% YoY. Source: county tax records.
Cash-flow waterfall
monthlySold comps — $/sqft
last 12 mo · ≤1 miLoading sold comps…