 Multi-family
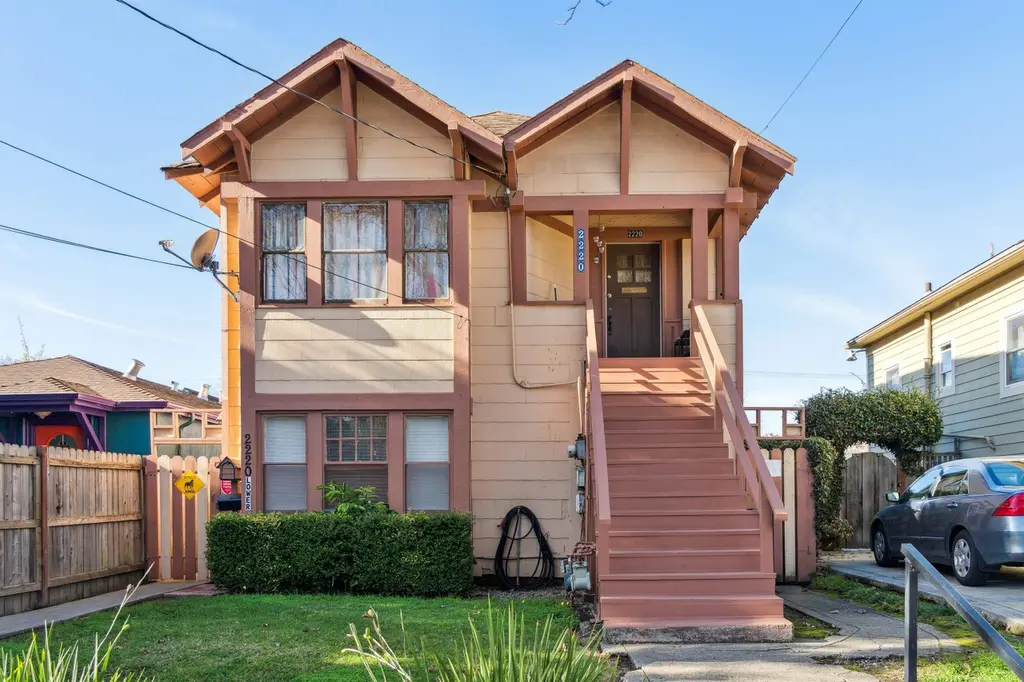
2220 7th St · Berkeley, CA
Flood risk 1/10 · Minimal
- FEMA flood zone
- X (unshaded)
- Chance of flooding over 30 yrs
- 0.0%
- Est. flood insurance / yr
- $507 – $1,088
Fire risk 1/10 · Minimal
- Est. fire insurance / yr
- $659 – $1,223
Heat risk 3/10 · Minor
- Hot days now (above 82°F)
- 7 days/yr
- Hot days in 30 yrs
- 15 days/yr
Wind risk 1/10 · Minimal
- Chance of severe wind over 30 yrs
- —
Air-quality risk 9/10 · Severe
- Unhealthy air days now
- 16 days/yr
- Unhealthy air days in 30 yrs
- 16 days/yr
Risk factors via First Street. Map © Google.
Why this score? — see what drove the D grade
The composite is a weighted blend of 9 inputs, each scored 0–100. Each bar is that input's sub-score; the figure is the points it added to the 100-point composite (weight × sub-score).
- ARV discount +15.0/15.0
- Cash flow +8.6/30.0
- Schools +5.7/10.0
- Livability +3.9/5.0
- Rent growth +3.1/5.0
- Condition / age +2.5/5.0
- DSCR +2.4/10.0
- 1% rule +1.9/10.0
- Appreciation +0.0/10.0
$899,000
🖨 Deal sheet 📄 Offer letter ✓ Due diligence
Multi-family units
County records classify this as Multi-Family (2-4 Unit). Listing-text estimate: 1 unit. estimate disagrees with records
Listing remarks MLS
Built in 1907, the property at 2220 7th St in Berkeley comprises 2 units in one two-story building. Located in one of the most desirable neighborhoods in Berkeley, near the 4th St shopping center and North Berkeley BART Station, the property is a great investment opportunity for a new owner.
Key facts
- Two story building
- 3,600 sq ft lot
- Built 1904
Tags
Neighborhood map
What this means for you Summary
Snapshot
- This is a 3-bed/2.0-bath multifamily listed at $899k.
Deal economics
- At list price, monthly cash flow is $-770 ($-9k/yr) — negative.
- To cash-flow at today's rent, offer at most $763k (15.1% below list).
- To meet the 1% rule (rent ≥ 1% of price), the offer needs to be $618k (31.3% below list).
- Recommended offer: $618k (31.3% below list) — sets the bar for 1% rule.
- Cap rate 5.3% vs local median 2.0% in Berkeley — top-decile yield for the area; either an underpriced asset or a hidden risk that comps aren't pricing in. Stress-test before assuming the spread holds.
Location & tenants
- Location reads 77/100 on livability (#74 in CA, #2,860 nationally) — a middle-class / working-renter tenant base. Strengths: schools A+, amenities A+, commute A+; Watch: crime F, cost of living F.
- Berkeley Unified (urban): math 61% / reading 67% proficiency, ranked #175 of 1,400 in CA (top 12%) — acceptable for families but not a draw, mixed tenant base, ~2y average lease.
- Market conditions: Rents rising (+2.2%/yr); 30 active listings in the ZIP; 30 comparable units currently listed for rent nearby; rentals leasing fast (median 4d on market — plan ~1-2 weeks tenant-placement turnaround); solid renter incomes; 1,742 units permitted in Alameda County in 2024 (856 in 5+ unit buildings).
- At $6,175/mo this rent would consume 72% of the median local household income ($102k/yr) (locally 764% of renters already pay >50% of income on rent) — very limited rent-growth headroom before tenants either downsize or default.
Forward outlook
- Local home prices are declining (-3.0%/yr); year-one equity from $6k of loan paydown is wiped out by about $27k of value loss. Plan a longer hold.
- Alameda County population projected at +34% by 2050 — long-run rental-demand tailwind backs the buy-and-hold thesis.
Negotiation context
- It's been on market 157 days — a 12% lower offer ($791k) is reasonable based on typical stale-listing flexibility.
Risks & watch-outs
- Watch-outs: built in 1904 — expect roof / HVAC / electrical / plumbing capex.
Questions for the listing agent
- What do current leases actually rent for vs. the listed asking? Can we see a recent rent roll and the last 12 months of T-12 income?
- It's been on market 157 days. Have you received any prior offers? Is the seller open to a 31% concession, seller financing, or rate buy-down credit?
- Built in 1904 — when were the roof, HVAC, electrical panel, plumbing, and water heater last replaced?
- Why hasn't it sold? Are there any deal-killer items the seller is aware of (foundation, flood, title, zoning, code violations)?
- Is there a deadline driving the sale (1031 exchange, divorce, estate, relocation)? That informs how much negotiation room exists.
- Schools are A-rated — typically a magnet for longer-tenancy family renters. What's the average tenant stay here, and is there a school-zone premium baked into asking?
- Crime grade is F in this area — have there been break-ins, vandalism, or insurance claims at this property in the last 3 years? What carrier currently insures it and at what premium?
- The area grade is low — what's the realistic commute time and amenity access for the typical tenant pool here? Any planned neighborhood developments (good or bad) we should know about?
- What's the average days-on-market for RENTAL listings here right now (not sales)? A rising rental-DOM trend means longer vacancies and softer asking-rent achievability than the comps imply.
- What's the recent tenant-quality profile in this submarket — average credit score on applications, eviction rate, late-payment / NSF rate, and stable-employment percentage? A property-management company in the area should have these aggregated.
- How much new apartment / multifamily construction is in the pipeline within 1–3 miles? Heavy new supply (>2% of stock underway) typically softens rents 12–24 months out; light construction supports rent growth.
Investment metrics
- 1% rule
- 0.69% ✗
- Cap rate
- 5.27%
- Cash-on-cash
- -3.67%
- DSCR
- 0.84
- GRM
- 12.1
CMA / ARV
- ARV (median comp)
- $1,427,862
- List price
- $899,000
- Delta
- -37.04%
- Verdict
- UNDERPRICED
- Comps
- 20 within 1.0 mi
Show comp detail 1 sale within ~0.75 mi
| Address | Dist | Beds/Ba | Sqft | Sold | Price | $/sf | Match |
|---|---|---|---|---|---|---|---|
| 1723 8th St | 0.52mi | 3/4.0 | 1,756 (+3%) | 14mo | $815,000 | $464 | 51 |
Match score weights: distance 35% · size 25% · config 20% · recency 20%. Top-matched comps best support the ARV.
Projected returns pro-forma
-3.0% appreciation · 2.24% rent growth · sell at horizon
- IRR
- -23.3%
- Equity multiple
- 0.21×
- Total profit
- $-199,631
- Equity at exit
- $134,044
- IRR
- -19.9%
- Equity multiple
- -0.02×
- Total profit
- $-256,919
- Equity at exit
- $77,729
Cash invested: $251,720 (down + closing). Projections, not guarantees.
Landlord ↔ Tenant lean methodology
- Overall (CITY)
- 0 Strongly Tenant-Friendly
- State California
- 18 Strongly Tenant-Friendly · D+13
- County
- — inherits STATE
- City Berkeley
- 0 Strongly Tenant-Friendly · D+78
ZIP-level market 94710
- Rents YoY
- 2.2%
- Active inventory
- 30
- Price-to-rent
- 24.3×
Monthly cashflow live
- Estimated rent
- $6,175 high interval (Pro) →
- Mortgage (P&I)
- −$4,714
- Tax from tax record
- −$559 /mo · $6,705/yr
- Insurance
- −$375
- HOA
- −$0
- Vacancy / Maint / Mgmt
- −$1,297
- Net cashflow
- $-770
Break-even live
2-unit breakdown (identical units grouped — click to expand)
| Units | Beds | Baths | Est. rent |
|---|---|---|---|
| 2× units | 2 | 1 | $6,176 |
| #1 | 2 | 1 | $3,088 |
| #2 | 2 | 1 | $3,088 |
| Total (2 units) | $6,175 | ||
UW: 25.0% down · 7.5% · 30yr · 1.5% tax · 5.0% vac · 8.0% maint · 8.0% mgmt
Financing live
Cash to close
- Down payment
- $224,750
- Closing costs
- $26,970
- Reserves months
- —
- Total cash needed
- —
Loan-product check · same deal, 3 products live
Conventional
25% down · 7.5% · 30yr
- Down + closing
- —
- Monthly P&I
- —
- Monthly cashflow
- —
- DSCR
- —
- Eligible?
- —
Personal DTI + credit; lowest rate.
DSCR
20% down · 8.5% · 30yr
- Down + closing
- —
- Monthly P&I
- —
- Monthly cashflow
- —
- DSCR
- —
- Eligible?
- —
No personal income docs; deal must DSCR.
Hard money
10% down · 12.0% · 12mo
- Down + closing
- —
- Monthly P&I
- —
- Monthly cashflow
- —
- DSCR
- —
- Eligible?
- —
Short-term bridge; refi at stabilization.
Rent comps 30 comps
| Address | Beds | Baths | Sqft | Rent | $/sqft | DOM | Units | Dist |
|---|---|---|---|---|---|---|---|---|
| 2010 Fifth St Berkeley, CA | 2.0 | 1.0–2.0 | 830 | $4,806 | $5.79 | 2d | 12 | 0.22mi |
| 651 Addison St Berkeley, CA | 2.0 | 2.0 | 1168 | $3,580 | $3.07 | 13d | 1 | 0.29mi |
| 1122 University Ave Berkeley, CA | 5.0 | 1.0–4.0 | 1129 | $4,814 | $4.26 | 1d | 20 | 0.39mi |
| 2148 Curtis St Berkeley, CA | 2.0 | 2.0 | 1100 | $3,900 | $3.55 | 43d | 1 | 0.39mi |
| 954 Cedar St Berkeley, CA | 3.0 | 2.0 | 1208 | $5,500 | $4.55 | 1d | 1 | 0.65mi |
| 1034 Grayson St Unit 1 Berkeley, CA | 3.0 | 3.0 | 1498 | $6,475 | $4.32 | 43d | 1 | 0.74mi |
| 1080 Jones St Berkeley, CA | 1.0–2.0 | 1.0–2.5 | 1046 | $5,787 | $5.53 | 1d | 7 | 0.78mi |
| 2726 Wallace St Berkeley, CA | 3.0 | 3.0 | 1856 | $6,300 | $3.39 | 2d | 1 | 0.79mi |
| 1317 Virginia St Unit 1 Berkeley, CA | 3.0 | 1.0 | 1250 | $3,995 | $3.20 | 5d | 1 | 0.79mi |
| 1415 10th St Berkeley, CA | 3.0 | 3.5 | 1477 | $3,650 | $2.47 | 11d | 1 | 0.90mi |
| 1316 Russell St Berkeley, CA | 4.0 | 2.5 | 2200 | $8,500 | $3.86 | 1d | 1 | 1.02mi |
| 3015 San Pablo Ave Berkeley, CA | 2.0 | 1.0–2.0 | 829 | $3,755 | $4.53 | 3d | 4 | 1.06mi |
| 1308 Stannage Ave Berkeley, CA | 3.0 | 1.0 | 1497 | $4,200 | $2.81 | 15d | 1 | 1.07mi |
| 1717 University Ave Berkeley, CA | 2.0–6.0 | 1.0–3.0 | 683 | $3,212 | $4.70 | 1d | 33 | 1.12mi |
| 2915 Stanton St Berkeley, CA | 3.0 | 2.0 | 1300 | $3,775 | $2.90 | 3d | 1 | 1.15mi |
| 6701 Shellmound St Emeryville, CA | 2.0 | 2.0 | 1145 | $4,003 | $3.50 | 2d | 5 | 1.17mi |
| 1200 65th St #226 Emeryville, CA | 2.0 | 1.0 | 1462 | $3,400 | $2.33 | 43d | 1 | 1.25mi |
| 1305 65th St Emeryville, CA | 2.0 | 4.0 | 1303 | $4,000 | $3.07 | 24d | 1 | 1.29mi |
| 1325 Sacramento St Unit 1557677P Berkeley, CA | 2.0 | 1.0 | 1140 | $6,165 | $5.41 | 12d | 1 | 1.30mi |
| 1114 Talbot Ave Albany, CA | 3.0 | 2.0 | 1569 | $4,700 | $3.00 | 18d | 1 | 1.32mi |
| 1465 65th St Emeryville, CA | 1.0–2.0 | 1.0–2.0 | 918 | $3,839 | $4.18 | 2d | 9 | 1.32mi |
| 1901 Dwight Way Berkeley, CA | 1.0–3.0 | 1.0–2.0 | 888 | $4,895 | $5.51 | 5d | 10 | 1.32mi |
| 2099 Martin Luther King Jr Way Berkeley, CA | 3.0 | 1.0–2.0 | 769 | $5,595 | $7.27 | 14d | 9 | 1.34mi |
| 1950 Addison St Berkeley, CA | 2.0 | 1.0–2.5 | 1014 | $7,837 | $7.72 | 1d | 10 | 1.37mi |
| 6401 Shellmound St Emeryville, CA | 3.0 | 1.0–2.0 | 913 | $3,663 | $4.01 | 1d | 7 | 1.38mi |
| 1039 Evelyn Ave Unit B Albany, CA | 3.0 | 2.0 | 2032 | $5,450 | $2.68 | 2d | 1 | 1.47mi |
| 6301 Shellmound St Emeryville, CA | 3.0 | 1.0–3.0 | 1233 | $4,850 | $3.93 | 2d | 1 | 1.48mi |
| 1251 63rd St Emeryville, CA | 3.0 | 2.0 | 1400 | $4,750 | $3.39 | 24d | 1 | 1.48mi |
| 2016 Dwight Way Unit 2020-A Berkeley, CA | 2.0 | 2.0 | 1058 | $4,250 | $4.02 | 11d | 1 | 1.49mi |
| 2028 Bancroft Way Berkeley, CA | 3.0 | 2.0 | 1086 | $6,595 | $6.07 | 1d | 1 | 1.49mi |
Listing history 15 events
-
2026-06-18days on market $899,000 Active 157 DOM
-
2026-06-17days on market $899,000 Active 156 DOM
-
2026-06-16days on market $899,000 Active 155 DOM
-
2026-06-15days on market $899,000 Active 154 DOM
-
2026-06-13days on market $899,000 Active 152 DOM
-
2026-06-13days on market $899,000 Active 151 DOM
-
2026-06-09days on market $899,000 Active 148 DOM
-
2026-06-08days on market $899,000 Active 147 DOM
-
2026-06-07days on market $899,000 Active 146 DOM
-
2026-06-04days on market $899,000 Active 143 DOM
-
2026-06-03days on market $899,000 Active 142 DOM
-
2026-06-02days on market $899,000 Active 141 DOM
-
2026-06-01days on market $899,000 Active 140 DOM
-
2026-05-31days on market $899,000 Active 139 DOM
-
2026-01-12$899,000 Active 292-char remark
Show marketing remark (292 chars)
Built in 1907, the property at 2220 7th St in Berkeley comprises 2 units in one two-story building. Located in one of the most desirable neighborhoods in Berkeley, near the 4th St shopping center and North Berkeley BART Station, the property is a great investment opportunity for a new owner.
ⓘ Source: listings_history table (triggers on properties + properties_extension) + one-shot
backfill from property_details.listing_events for pre-trigger history.
Tax reassessment forecast CA · Resets to sale price
- Current annual tax
- $6,705 · $559/mo
- Projected year-2 tax
- $6,832 · $569/mo
- Expected delta
- +$127/yr (+$11/mo · 1.9%)
ⓘ Screening estimate from a state-policy table — verify with the county assessor before closing.
Climate risk First Street
- Flood 1/10 Low FEMA zone X (unshaded) · 0% chance over 30 yrs
- Wildfire 1/10 Low
- Heat 3/10 Moderate 7 d/yr ≥82°F today · 15 d/yr by 30 yrs out
- Wind 1/10 Low
- Air quality 9/10 Extreme 16 unhealthy d/yr today · 16 by 30 yrs out
Nearby sold comps map
Loading sold comps map…
Walkable amenities ~0.75 mi
Loading nearby amenities…
Taxation est. · year 1
- Rental income
- $74,100
- − Mortgage interest
- −$50,358
- − Property taxes
- −$6,705
- − Insurance
- −$4,495
- − Repairs & maintenance
- −$5,928
- − Management
- −$5,928
- − Depreciation
- −$26,153
- Taxable loss
- −$25,467
- Est. tax savings @ 24.0%
- +$6,112
- After-tax cash flow
- $-3,123/yr
For passive investors: Depreciation is non-cash, so a rental often shows a tax loss while cash-flowing — sheltering income. Rental losses are passive: they offset passive income freely, and up to $25,000/yr can offset ordinary (W-2) income if you actively participate and your MAGI is under $100k (phasing out to $0 by $150k); unused losses carry forward. On sale, claimed depreciation is recaptured at up to 25%, and gains may owe capital-gains tax (a 1031 exchange can defer both). Figures are a year-1 estimate at your 24.0% rate — not tax advice; consult a CPA.
Schools (NCES district)
- District
- Berkeley Unified
- NCES district ID
- 0604740
- Math proficiency
- 61% ▲ 2.00%
- Reading proficiency
- 67% ▲ 2.00%
- Median HH income
- $66,202
- Composite
- 57.37/100
- National rank
- #2288
- State rank
- #175 of 1400 in CA
Livability — Berkeley
- Score
- 77/100
- State rank
- #74
- US rank
- #2860
Category grades
Schools grade is shown separately in the Schools card above.
Census & demographics
- Census place
- Berkeley, CA
- County
- Alameda County · 1,614,355 people
- City population
- 121,632
- Metro
- San Francisco-Oakland-Berkeley, CA
- Population (ZIP)
- 8,380
- Household income
- $102,227
- Rent vs Own
- Severe rent burden
- 764.0
Population outlook (Alameda County) Hauer SSP2
- Today (2025)
- 1,928,884 people
- By 2030
- 2,069,146 · +7.3%
- By 2040
- 2,338,405 · +21.2%
- By 2050
- 2,586,608 · +34.1%
- By 2075
- 3,061,911 · +58.7%
- By 2100
- 3,234,133 · +67.7%
Race, ethnicity, and origin ACS 2023
- Neighborhood character
- Highly diverse neighborhood (Simpson 0.70)
- Race & ethnicity
- White 48% Hispanic / Latino 20% Asian 13% Two or more races 13% Black 9% Native American 2%
- Hispanic origin (detail)
- Mexican 13% Puerto Rican 2%
- Common ancestry
- Scotch-Irish 4% Romanian 3% Slovak 3%
- Foreign-born
- 20% · Canada, China, South Korea
- Languages at home
- 73% English-only · Spanish 15% Chinese 3% Other Indo-European 3%
Political lean MEDSL · Alameda
- 2024 margin
- Solid D (+53.6) · D 74.6% · R 21.0% · Other 4.4%
- 2008→2024 swing
- -5.9pp toward R · 2008: 59.5pp · 2024: 53.6pp
- All cycles
- 2024: D+53.6 2020: D+62.5 2016: D+64.4 2012: D+59.8 2008: D+59.5
Not yet ingested
- Civics
- —
Market trends
- HPI YoY
- ▼ -444.39%
- Current HPI
- 283.2007
- Rent YoY
- ▲ 2.24%
- Metro
- San Francisco-Oakland-Berkeley, CA
- State GDP YoY
- ▲ 3.21%
- F500 in state
- 116
Industry mix (Fortune 500 HQ in CA)
| Industry | F500 HQs | Revenue |
|---|---|---|
| Technology | 27 | $1,492B |
|
||
| Financial Services | 3 | $174B |
|
||
| Retail | 3 | $44B |
|
||
| Insurance | 3 | $26B |
|
||
| Media / Entertainment | 2 | $115B |
|
||
| Pharmaceuticals / Biotech | 2 | $62B |
|
||
Price history
1 event — show timeline
- 2026-01-12 Listed $899,000 bridgeMLS, Bay East AOR, or Contra Costa AOR
Property tax history
+4.5%/yrLatest (2025): $6,705 · +18.5% YoY. Source: county tax records.
Cash-flow waterfall
monthlySold comps — $/sqft
last 12 mo · ≤1 miLoading sold comps…