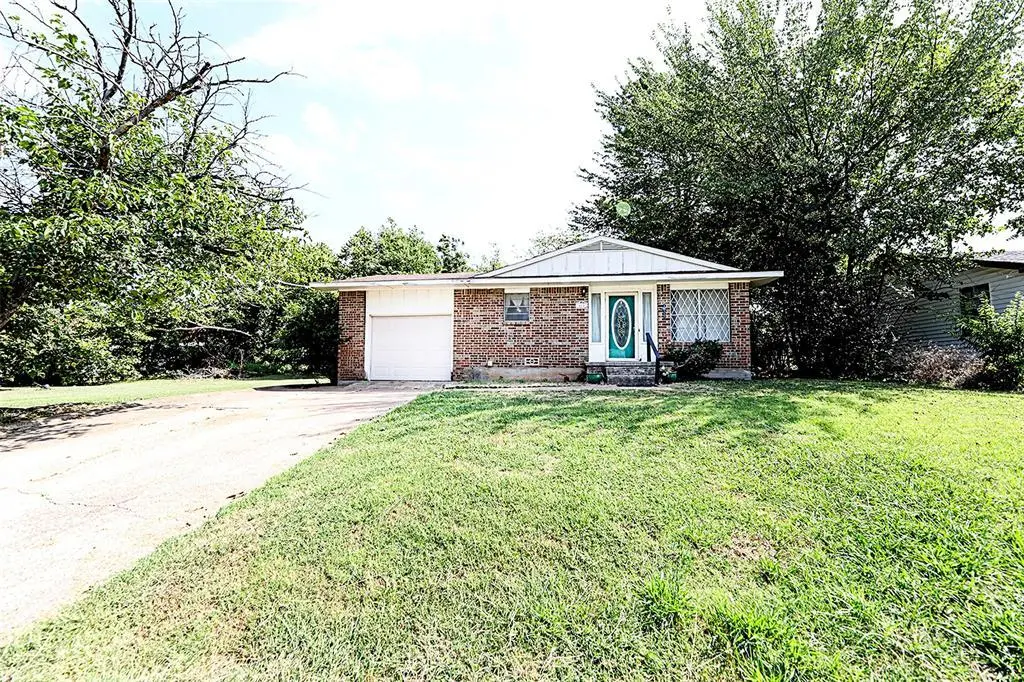
421 E Wilbarger St · Bowie, TX
Flood risk 1/10 · Minimal
- FEMA flood zone
- X (unshaded)
- Chance of flooding over 30 yrs
- 0.0%
- Est. flood insurance / yr
- $507 – $1,088
Fire risk 6/10 · Moderate
- Est. fire insurance / yr
- $1,222 – $2,270
Heat risk 6/10 · Moderate
- Hot days now (above 108°F)
- 7 days/yr
- Hot days in 30 yrs
- 19 days/yr
Wind risk 4/10 · Minor
- Chance of severe wind over 30 yrs
- 13.0%
Air-quality risk 1/10 · Minimal
- Unhealthy air days now
- 0 days/yr
- Unhealthy air days in 30 yrs
- 0 days/yr
Risk factors via First Street. Map © Google.
Why this score? — see what drove the C+ grade
The composite is a weighted blend of 9 inputs, each scored 0–100. Each bar is that input's sub-score; the figure is the points it added to the 100-point composite (weight × sub-score).
- Cash flow +23.4/30.0
- ARV discount +15.0/15.0
- DSCR +7.5/10.0
- 1% rule +6.1/10.0
- Schools +3.2/10.0
- Livability +3.2/5.0
- Rent growth +2.5/5.0
- Condition / age +2.5/5.0
- Appreciation +0.0/10.0
$119,000
🖨 Deal sheet 📄 Offer letter ✓ Due diligence
Listing remarks MLS
Charming Ranch-Style Fixer Upper in Established Neighborhood Less than 1 mile from Highway 287 for the perfect commute! Opportunity awaits with this ranch-style home nestled in a well-established neighborhood filled with mature trees and timeless character. Just under a mile from Highway 287, the location offers convenient access to schools, shopping, dining, and commuting routes. This property is ideal for buyers looking to put their personal touch on a home or for investors seeking their next project. With its classic single-story layout, spacious lot, and quiet surroundings, it provides the perfect foundation to create your dream home. Don’t miss the chance to own a home with great potential in a desirable location.
Key facts
- Single-story layout
- Convenient access
- Spacious lot
Tags
Neighborhood map
What this means for you Summary
Snapshot
- This is a 3-bed/1.5-bath single-family listed at $119k.
Deal economics
- At list price, monthly cash flow is $220 ($3k/yr) — positive.
- The deal already cash-flows at list — no discount required.
- Meets the 1% rule at list price ($1k rent vs $119k).
- Recommended offer: $105k (12.0% below list) — sets the bar for market timing.
- Cap rate 8.5% vs local median 3.1% in Bowie — top-decile yield for the area; either an underpriced asset or a hidden risk that comps aren't pricing in. Stress-test before assuming the spread holds.
Location & tenants
- Location reads 64/100 on livability (#796 in TX) — a middle-class / working-renter tenant base. Strengths: cost of living A+, housing A+; Watch: health & safety C-, schools D, amenities F.
- Bowie ISD (town): math 34% / reading 41% proficiency, ranked #469 of 826 in TX (top 57%) — families likely to look elsewhere, expect single-tenant / working-renter base with shorter leases.
- Market conditions: 238 active listings in the ZIP; 4 comparable units currently listed for rent nearby; rentals leasing fast (median 1d on market — plan ~1-2 weeks tenant-placement turnaround); 23 units permitted in Montague County in 2024 (0 in 5+ unit buildings).
Forward outlook
- Local home prices are declining (-3.0%/yr); year-one equity from $823 of loan paydown is wiped out by about $4k of value loss. Plan a longer hold.
- Montague County population projected at -15% by 2050 — secular population decline; favor cash flow + early exit over multi-decade hold.
Negotiation context
- It's been on market 304 days — a 12% lower offer ($105k) is reasonable based on typical stale-listing flexibility.
Risks & watch-outs
- Climate carrying-cost: major wildfire risk; extreme-heat days projected 7→19/yr by 2055 (HVAC capex compounding) — expect insurance premiums to compound above CPI over the hold.
Questions for the listing agent
- It's been on market 304 days. Have you received any prior offers? Is the seller open to a 12% concession, seller financing, or rate buy-down credit?
- Built in 1960 — when were the roof, HVAC, electrical panel, plumbing, and water heater last replaced?
- Why hasn't it sold? Are there any deal-killer items the seller is aware of (foundation, flood, title, zoning, code violations)?
- Is there a deadline driving the sale (1031 exchange, divorce, estate, relocation)? That informs how much negotiation room exists.
- Schools are D-rated, which usually means shorter tenancies and higher turnover. Who's the typical renter profile here, and what's been the actual vacancy rate?
- What's the average days-on-market for RENTAL listings here right now (not sales)? A rising rental-DOM trend means longer vacancies and softer asking-rent achievability than the comps imply.
- What's the recent tenant-quality profile in this submarket — average credit score on applications, eviction rate, late-payment / NSF rate, and stable-employment percentage? A property-management company in the area should have these aggregated.
- How much new for-sale + rental construction is in the pipeline within 1–3 miles? Heavy new supply typically softens prices + rents 12–24 months out; constrained supply supports both.
Investment metrics
- 1% rule
- 1.11% ✓
- Cap rate
- 8.51%
- Cash-on-cash
- 7.92%
- DSCR
- 1.35
- GRM
- 7.5
CMA / ARV
- ARV (median comp)
- $153,949
- List price
- $119,000
- Delta
- -22.70%
- Verdict
- UNDERPRICED
- Comps
- 20 within 1.0 mi
Show comp detail 9 sales within ~0.75 mi
| Address | Dist | Beds/Ba | Sqft | Sold | Price | $/sf | Match |
|---|---|---|---|---|---|---|---|
| 605 E Wilbarger | 0.18mi | 3/1.5 | 1,190 (-5%) | 11mo | $125,000 | $105 | 75 |
| 401 Miller St | 0.46mi | 3/2.0 | 1,150 (-8%) | 6mo | $200,000 | $174 | 58 |
| 204 Taylor St | 0.44mi | 3/1.0 | 1,134 (-9%) | 8mo | $49,000 | $43 | 56 |
| 719 Small St | 0.57mi | 3/1.0 | 1,325 (+6%) | 7mo | $115,000 | $87 | 55 |
| 206 Rock St | 0.38mi | 2/1.0 (-1) | 1,176 (-6%) | 13mo | $175,000 | $149 | 55 |
| 207 N Mill St | 0.47mi | 2/1.0 (-1) | 1,095 (-12%) | 8mo | $144,900 | $132 | 43 |
| 209 Washington St | 0.35mi | 3/2.0 | 1,410 (+13%) | 23mo | $99,900 | $71 | 41 |
| 602 Ray St | 0.60mi | 3/2.0 | 1,400 (+12%) | 23mo | $224,000 | $160 | 30 |
| 410 Elba St | 0.65mi | 4/2.5 (+1) | 1,420 (+14%) | 10mo | $199,500 | $140 | 30 |
Match score weights: distance 35% · size 25% · config 20% · recency 20%. Top-matched comps best support the ARV.
Projected returns pro-forma
-3.0% appreciation · 3.0% rent growth · sell at horizon
- IRR
- -4.2%
- Equity multiple
- 0.84×
- Total profit
- $-5,251
- Equity at exit
- $17,743
- IRR
- 5.5%
- Equity multiple
- 1.41×
- Total profit
- $13,555
- Equity at exit
- $10,289
Cash invested: $33,320 (down + closing). Projections, not guarantees.
Landlord ↔ Tenant lean methodology
- Overall (STATE)
- 87 Strongly Landlord-Friendly
- State Texas
- 87 Strongly Landlord-Friendly · R+5
- County
- — inherits STATE
- City
- — inherits STATE
ZIP-level market 76230
- Home prices YoY
- -27.1%
- Active inventory
- 238
- Price-to-rent
- 7.5×
Monthly cashflow live
- Estimated rent
- $1,322 medium interval (Pro) →
- Mortgage (P&I)
- −$624
- Tax from tax record
- −$151 /mo · $1,807/yr
- Insurance
- −$50
- HOA
- −$0
- Vacancy / Maint / Mgmt
- −$278
- Net cashflow
- $220
Break-even live
UW: 25.0% down · 7.5% · 30yr · 1.5% tax · 5.0% vac · 8.0% maint · 8.0% mgmt
Financing live
Cash to close
- Down payment
- $29,750
- Closing costs
- $3,570
- Reserves months
- —
- Total cash needed
- —
Loan-product check · same deal, 3 products live
Conventional
25% down · 7.5% · 30yr
- Down + closing
- —
- Monthly P&I
- —
- Monthly cashflow
- —
- DSCR
- —
- Eligible?
- —
Personal DTI + credit; lowest rate.
DSCR
20% down · 8.5% · 30yr
- Down + closing
- —
- Monthly P&I
- —
- Monthly cashflow
- —
- DSCR
- —
- Eligible?
- —
No personal income docs; deal must DSCR.
Hard money
10% down · 12.0% · 12mo
- Down + closing
- —
- Monthly P&I
- —
- Monthly cashflow
- —
- DSCR
- —
- Eligible?
- —
Short-term bridge; refi at stabilization.
Rent comps 4 comps
| Address | Beds | Baths | Sqft | Rent | $/sqft | DOM | Units | Dist |
|---|---|---|---|---|---|---|---|---|
| 418 Elba St Bowie, TX | 3.0 | 2.0 | 1200 | $1,400 | $1.17 | 1d | 1 | 0.65mi |
| 903 N Lamb St Bowie, TX | 3.0 | 1.0 | 1269 | $1,450 | $1.14 | 1d | 1 | 0.82mi |
| 1003 Rock St Unit 7 Bowie, TX | 2.0 | 1.0 | 900 | $950 | $1.06 | 10d | 1 | 0.93mi |
| 911 U.S. 81 Unit D Bowie, TX | 3.0 | 2.0 | 1200 | $1,350 | $1.12 | 1d | 1 | 1.44mi |
Listing history 15 events
-
2026-06-18days on market $119,000 Active 304 DOM
-
2026-06-17days on market $119,000 Active 303 DOM
-
2026-06-16days on market $119,000 Active 302 DOM
-
2026-06-15days on market $119,000 Active 301 DOM
-
2026-06-13days on market $119,000 Active 299 DOM
-
2026-06-12pricedays on market $119,000 Active 298 DOM
-
2026-06-09days on market $137,000 Active 295 DOM
-
2026-06-08days on market $137,000 Active 294 DOM
-
2026-06-08days on market $137,000 Active 293 DOM
-
2026-06-07days on market $137,000 Active 292 DOM
-
2026-06-03days on market $137,000 Active 289 DOM
-
2026-06-02days on market $137,000 Active 288 DOM
-
2026-06-01days on market $137,000 Active 287 DOM
-
2026-05-31days on market $137,000 Active 286 DOM
-
2025-08-18$137,000 Active 735-char remark
Show marketing remark (735 chars)
Charming Ranch-Style Fixer Upper in Established Neighborhood Less than 1 mile from Highway 287 for the perfect commute! Opportunity awaits with this ranch-style home nestled in a well-established neighborhood filled with mature trees and timeless character. Just under a mile from Highway 287, the location offers convenient access to schools, shopping, dining, and commuting routes. This property is ideal for buyers looking to put their personal touch on a home or for investors seeking their next project. With its classic single-story layout, spacious lot, and quiet surroundings, it provides the perfect foundation to create your dream home. Don’t miss the chance to own a home with great potential in a desirable location.
ⓘ Source: listings_history table (triggers on properties + properties_extension) + one-shot
backfill from property_details.listing_events for pre-trigger history.
Tax reassessment forecast TX · Resets to sale price
- Current annual tax
- $1,807 · $151/mo
- Projected year-2 tax
- $2,178 · $181/mo
- Expected delta
- +$370/yr (+$31/mo · 20.5%)
ⓘ Screening estimate from a state-policy table — verify with the county assessor before closing.
Climate risk First Street
- Flood 1/10 Low FEMA zone X (unshaded) · 0% chance over 30 yrs
- Wildfire 6/10 Major
- Heat 6/10 Major 7 d/yr ≥108°F today · 19 d/yr by 30 yrs out
- Wind 4/10 Moderate 13% chance of damaging wind over 30 yrs
- Air quality 1/10 Low 0 unhealthy d/yr today · 0 by 30 yrs out
Nearby sold comps map
Loading sold comps map…
Walkable amenities ~0.75 mi
Loading nearby amenities…
Taxation est. · year 1
- Rental income
- $15,862
- − Mortgage interest
- −$6,666
- − Property taxes
- −$1,807
- − Insurance
- −$595
- − Repairs & maintenance
- −$1,269
- − Management
- −$1,269
- − Depreciation
- −$3,462
- Taxable income
- $794
- Est. tax owed @ 24.0%
- −$191
- After-tax cash flow
- $2,449/yr
For passive investors: Depreciation is non-cash, so a rental often shows a tax loss while cash-flowing — sheltering income. Rental losses are passive: they offset passive income freely, and up to $25,000/yr can offset ordinary (W-2) income if you actively participate and your MAGI is under $100k (phasing out to $0 by $150k); unused losses carry forward. On sale, claimed depreciation is recaptured at up to 25%, and gains may owe capital-gains tax (a 1031 exchange can defer both). Figures are a year-1 estimate at your 24.0% rate — not tax advice; consult a CPA.
Schools (NCES district)
- District
- Bowie ISD
- NCES district ID
- 4810990
- Math proficiency
- 34% ▼ -8.00%
- Reading proficiency
- 41% ▼ -2.00%
- Median HH income
- $45,720
- Composite
- 31.99/100
- National rank
- #5836
- State rank
- #469 of 826 in TX
Livability — Bowie
- Score
- 64/100
- State rank
- #796
- US rank
- #14499
Category grades
Schools grade is shown separately in the Schools card above.
Census & demographics
- Census place
- Bowie, TX
- Population (ZIP)
- 9,885
Population outlook (Montague County) Hauer SSP2
- Today (2025)
- 18,216 people
- By 2030
- 17,603 · -3.4%
- By 2040
- 16,451 · -9.7%
- By 2050
- 15,424 · -15.3%
- By 2075
- 13,365 · -26.6%
- By 2100
- 10,998 · -39.6%
Race, ethnicity, and origin ACS 2023
- Neighborhood character
- Predominantly White (83%)
- Race & ethnicity
- White 83% Hispanic / Latino 12% Two or more races 7%
- Hispanic origin (detail)
- Mexican 12%
- Common ancestry
- Serbian 2% Romanian 2% Slovak 1%
- Foreign-born
- 4% · Canada
- Languages at home
- 89% English-only · Spanish 10% Other Indo-European 1%
Political lean MEDSL · Montague
- 2024 margin
- Solid R (+77.7) · D 10.9% · R 88.5%
- 2008→2024 swing
- -19.2pp toward R · 2008: -58.5pp · 2024: -77.7pp
- All cycles
- 2024: R+77.7 2020: R+76.6 2016: R+77.2 2012: R+70.1 2008: R+58.5
Not yet ingested
- Civics
- —
Market trends
- HPI YoY
- ▼ -75.69%
- Current HPI
- 204.0919
- Rent YoY
- —
- Metro
- —
- State GDP YoY
- ▲ 3.95%
- F500 in state
- 110
Industry mix (Fortune 500 HQ in TX)
| Industry | F500 HQs | Revenue |
|---|---|---|
| Energy | 16 | $1,198B |
|
||
| Technology | 5 | $198B |
|
||
| Engineering / Construction | 4 | $72B |
|
||
| Energy Services | 3 | $60B |
|
||
| Utilities | 3 | $41B |
|
||
| Healthcare | 2 | $330B |
|
||
Price history
1 event — show timeline
- 2025-08-18 Listed $137,000 NTREIS
Property tax history
+4.2%/yrLatest (2025): $1,807 · +6.1% YoY. Source: county tax records.
Cash-flow waterfall
monthlySold comps — $/sqft
last 12 mo · ≤1 miLoading sold comps…