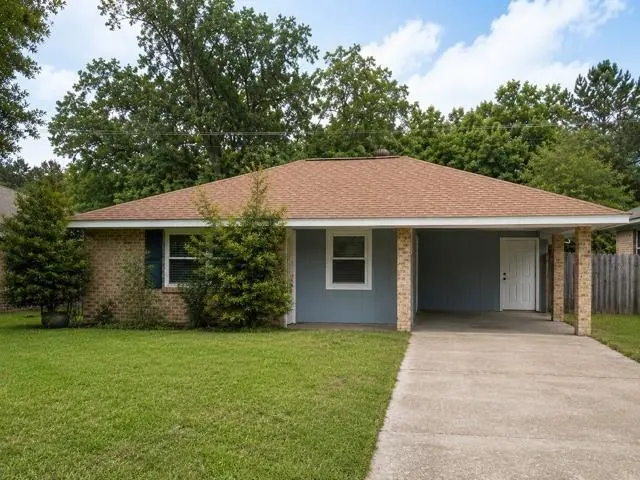
25623 Rosedown Dr · Denham Springs, LA
Flood risk 1/10 · Minimal
- FEMA flood zone
- AE
- Chance of flooding over 30 yrs
- 0.0%
- Est. flood insurance / yr
- $1,737 – $8,500
Fire risk 1/10 · Minimal
- Est. fire insurance / yr
- $1,269 – $2,357
Heat risk 8/10 · Major
- Hot days now (above 108°F)
- 7 days/yr
- Hot days in 30 yrs
- 21 days/yr
Wind risk 9/10 · Severe
- Chance of severe wind over 30 yrs
- 99.0%
Air-quality risk 3/10 · Minor
- Unhealthy air days now
- 2 days/yr
- Unhealthy air days in 30 yrs
- 3 days/yr
Risk factors via First Street. Map © Google.
Why this score? — see what drove the B+ grade
The composite is a weighted blend of 9 inputs, each scored 0–100. Each bar is that input's sub-score; the figure is the points it added to the 100-point composite (weight × sub-score).
- Cash flow +29.4/30.0
- ARV discount +15.0/15.0
- DSCR +10.0/10.0
- 1% rule +7.8/10.0
- Schools +4.0/10.0
- Livability +3.7/5.0
- Rent growth +3.5/5.0
- Condition / age +2.5/5.0
- Appreciation +0.0/10.0
$125,000
🖨 Deal sheet 📄 Offer letter ✓ Due diligence
Listing remarks MLS
Great 3 Bedroom 1.5 Bath home in the heart of Denham Springs. Come live close to some of your favorite restaurants and shops. Lots of storage inside and out, with an added metal shed in the yard. This property is part of a succession and must be on the market for at least 10 days before any offers will be considered. Inspections are for informational purposes only. The Succession cannot make any repairs nor compensate for repairs to be made. All Financed offers must be accompanied by a pre-approval letter from a lender, and all Cash offers must be accompanied by proof of funds letter or Bank Statement from a financial institution. Both sources have to be dated within 30 days of the Offer. All potential Buyers must have gone inside of the property in order to make an offer on the property. No sight unseen offers will be accepted. No offers can be assigned to another buyer.
Key facts
- Added metal shed
- Lots of storage
- Parking
Tags
Property features AI
Finance
- Other: Property condition listed as average
- Financial info: No investor or income/expense details provided
- HOA & community: HOA details not provided
Exterior
- Parking: Carport
- Security: Security details not provided
- Utilities: Public water; Public sewer
- Home design: Single-story home; Average condition; Home warranty included
- Construction: Brick construction; Asphalt shingle roof; Slab foundation; Built year not provided
- Exterior features: Covered patio/porch; Shed(s); City lot; Rectangular lot; Lot dimensions approximately 50 x 120
Interior
- Kitchen: Kitchen details not provided
- Bedrooms: Bedrooms count not specified
- Flooring: Flooring details not provided
- Bathrooms: One full bathroom; One half bathroom
- Heating & cooling: Central heating; Central air conditioning
- Interior features: Total of 5 rooms
- Laundry & utility: Laundry details not provided
Neighborhood map
What this means for you Summary
Snapshot
- This is a 3-bed/1.5-bath single-family listed at $125k.
Deal economics
- At list price, monthly cash flow is $19 ($223/yr) — positive.
- The deal already cash-flows at list — no discount required.
- Meets the 1% rule at list price ($2k rent vs $125k).
- Cap rate 10.6% vs local median 3.9% in Denham Springs — top-decile yield for the area; either an underpriced asset or a hidden risk that comps aren't pricing in. Stress-test before assuming the spread holds.
Location & tenants
- Location reads 74/100 on livability (#29 in LA, #4,939 nationally) — a middle-class / working-renter tenant base. Strengths: cost of living A+, housing A+, health & safety A+; Watch: crime C-, amenities F, commute F.
- Livingston Parish (suburban): math 40% / reading 52% proficiency, ranked #13 of 98 in LA (top 13%) — families likely to look elsewhere, expect single-tenant / working-renter base with shorter leases.
- Market conditions: Rents rising (+3.8%/yr); 976 active listings in the ZIP; 4 comparable units currently listed for rent nearby; rentals lingering (median 44d on market — plan ~5-8 weeks vacancy on turnover, expect pricing pressure); 50% of comp listings sitting > 30 days — soft ceiling on asking rent; solid renter incomes; 794 units permitted in Livingston Parish in 2024 (99 in 5+ unit buildings).
Forward outlook
- Local home prices are declining (-3.0%/yr); year-one equity from $864 of loan paydown is wiped out by about $4k of value loss. Plan a longer hold.
- Livingston County population projected at +27% by 2050 — long-run rental-demand tailwind backs the buy-and-hold thesis.
Negotiation context
- Only 11 days on market — expect competitive offers; lowballing is unlikely to land.
- 13 sale attempts since 18y ago with the ask held roughly flat each time — persistent listings suggest the price (not the market) is what's stuck; bring a comps-based counter.
- Current owner paid $105k; 19% above their basis — modest negotiation headroom, anchor on the comps not their cost.
Risks & watch-outs
- Watch-outs: flood insurance adds $427/mo.
- Climate carrying-cost: in FEMA flood zone AE (mandatory federal flood insurance); severe wind risk, 99% chance of damaging wind over 30y; extreme-heat days projected 7→21/yr by 2055 (HVAC capex compounding) — expect insurance premiums to compound above CPI over the hold.
Questions for the listing agent
- What's the actual annual flood-insurance premium (NFIP or private), and is the property in a SFHA with mandatory coverage?
- Is there a deadline driving the sale (1031 exchange, divorce, estate, relocation)? That informs how much negotiation room exists.
- Schools are B-rated — typically a magnet for longer-tenancy family renters. What's the average tenant stay here, and is there a school-zone premium baked into asking?
- What's the average days-on-market for RENTAL listings here right now (not sales)? A rising rental-DOM trend means longer vacancies and softer asking-rent achievability than the comps imply.
- What's the recent tenant-quality profile in this submarket — average credit score on applications, eviction rate, late-payment / NSF rate, and stable-employment percentage? A property-management company in the area should have these aggregated.
- How much new for-sale + rental construction is in the pipeline within 1–3 miles? Heavy new supply typically softens prices + rents 12–24 months out; constrained supply supports both.
Investment metrics
- 1% rule
- 1.28% ✓
- Cap rate
- 10.57%
- Cash-on-cash
- 15.26%
- DSCR
- 1.68
- GRM
- 6.5
CMA / ARV
- ARV (median comp)
- $152,424
- List price
- $125,000
- Delta
- -8.15%
- Verdict
- FAIR
- Comps
- 20 within 1.0 mi
Show comp detail 12 sales within ~0.75 mi
| Address | Dist | Beds/Ba | Sqft | Sold | Price | $/sf | Match |
|---|---|---|---|---|---|---|---|
| 25647 Rosedown Dr | 0.05mi | 3/2.0 | 1,150 (+2%) | 4mo | $155,000 | $135 | 90 |
| 8848 Asphodel St | 0.09mi | 3/2.0 | 1,123 (-1%) | 5mo | $164,000 | $146 | 88 |
| 8849 SW Asphodel St | 0.11mi | 3/2.0 | 1,114 (-2%) | 4mo | $160,000 | $144 | 87 |
| 8745 Fairoaks St | 0.10mi | 3/1.5 | 1,128 (-0%) | 10mo | $150,000 | $133 | 86 |
| 8703 Aspen Ct | 0.13mi | 3/2.0 | 1,160 (+2%) | 3mo | $160,000 | $138 | 86 |
| 25667 Rosedown Dr | 0.09mi | 3/1.5 | 1,152 (+2%) | 12mo | $139,000 | $121 | 83 |
| 8750 Fairoaks St | 0.11mi | 3/1.5 | 1,108 (-2%) | 12mo | $145,000 | $131 | 81 |
| 25452 Homestead Dr | 0.15mi | 3/2.0 | 1,160 (+2%) | 8mo | $160,000 | $138 | 80 |
| 8739 Aubin St | 0.12mi | 3/1.5 | 1,080 (-5%) | 13mo | $155,000 | $144 | 76 |
| 25482 Poirrier Ln | 0.20mi | 2/1.0 (-1) | 1,184 (+5%) | 2mo | $225,000 | $190 | 74 |
| 8729 Fairoaks St | 0.07mi | 3/1.5 | 1,031 (-9%) | 11mo | $145,000 | $141 | 72 |
| 8718 Montclair St | 0.08mi | 4/2.0 (+1) | 1,230 (+9%) | 6mo | $155,000 | $126 | 70 |
Match score weights: distance 35% · size 25% · config 20% · recency 20%. Top-matched comps best support the ARV.
Projected returns pro-forma
-3.0% appreciation · 3.83% rent growth · sell at horizon
- IRR
- -13.7%
- Equity multiple
- 0.50×
- Total profit
- $-17,467
- Equity at exit
- $18,638
- IRR
- -2.8%
- Equity multiple
- 0.80×
- Total profit
- $-7,023
- Equity at exit
- $10,808
Cash invested: $35,000 (down + closing). Projections, not guarantees.
Landlord ↔ Tenant lean methodology
- Overall (STATE)
- 90 Strongly Landlord-Friendly
- State Louisiana
- 90 Strongly Landlord-Friendly · R+12
- County
- — inherits STATE
- City
- — inherits STATE
ZIP-level market 70726
- Rents YoY
- 3.8%
- Active inventory
- 976
- Price-to-rent
- 6.5×
Monthly cashflow live
- Estimated rent
- $1,598 medium interval (Pro) →
- Mortgage (P&I)
- −$656
- Tax from tax record
- −$110 /mo · $1,316/yr
- Insurance
- −$52
- Flood insurance flood zone
- −$427 /mo · $5,118/yr
- HOA
- −$0
- Vacancy / Maint / Mgmt
- −$336
- Net cashflow
- $19
Break-even live
UW: 25.0% down · 7.5% · 30yr · 1.5% tax · 5.0% vac · 8.0% maint · 8.0% mgmt
Financing live
Cash to close
- Down payment
- $31,250
- Closing costs
- $3,750
- Reserves months
- —
- Total cash needed
- —
Loan-product check · same deal, 3 products live
Conventional
25% down · 7.5% · 30yr
- Down + closing
- —
- Monthly P&I
- —
- Monthly cashflow
- —
- DSCR
- —
- Eligible?
- —
Personal DTI + credit; lowest rate.
DSCR
20% down · 8.5% · 30yr
- Down + closing
- —
- Monthly P&I
- —
- Monthly cashflow
- —
- DSCR
- —
- Eligible?
- —
No personal income docs; deal must DSCR.
Hard money
10% down · 12.0% · 12mo
- Down + closing
- —
- Monthly P&I
- —
- Monthly cashflow
- —
- DSCR
- —
- Eligible?
- —
Short-term bridge; refi at stabilization.
Rent comps 4 comps
| Address | Beds | Baths | Sqft | Rent | $/sqft | DOM | Units | Dist |
|---|---|---|---|---|---|---|---|---|
| 8708 Montclair St Denham Springs, LA | 3.0 | 2.0 | 1184 | $1,600 | $1.35 | 21d | 1 | 0.05mi |
| 26218 Louisiana 16 Unit 3 Denham Springs, LA | 2.0 | 1.0 | 830 | $995 | $1.20 | 43d | 1 | 0.67mi |
| 8275 Vincent Rd Denham Springs, LA | 1.0–3.0 | 1.0–2.0 | 958 | $1,495 | $1.56 | 14d | 20 | 0.68mi |
| 2630 Kelli Dr Unit 1 Denham Springs, LA | 2.0 | 1.5 | 1100 | $1,250 | $1.14 | 43d | 1 | 1.13mi |
Listing history 22 events
-
2026-05-31statusdays on market $125,000 Pending 11 DOM
-
2026-05-07$140,000 Active 1062-char remark
-
2026-05-07$140,000 Active 1064-char remark
-
2017-02-27soldstatus $109,900
-
2017-02-24soldstatus Sold
-
2017-02-02status Pending
-
2017-01-31status Active
-
2017-01-30status Pending
-
2017-01-19$116,500 Active
-
2017-01-19$116,500
-
2014-07-25soldstatus $104,900
-
2014-07-24soldstatus
-
2014-02-10$106,900
-
2014-02-10$106,900
-
2012-09-03$102,500
-
2009-10-19soldstatus
-
2009-10-14soldstatus
-
2009-08-18$99,500
-
2009-08-18$99,500
-
2008-09-14$111,900
-
2008-09-14$111,900
-
2006-06-16soldstatus
ⓘ Source: listings_history table (triggers on properties + properties_extension) + one-shot
backfill from property_details.listing_events for pre-trigger history.
Tax reassessment forecast LA · Resets to sale price
- Current annual tax
- $1,316 · $110/mo
- Projected year-2 tax
- $1,316 · $110/mo
- Expected delta
- $0/yr ($0/mo · 0.0%)
ⓘ Screening estimate from a state-policy table — verify with the county assessor before closing.
Climate risk First Street
- Flood 1/10 Low FEMA zone AE · 0% chance over 30 yrs
- Wildfire 1/10 Low
- Heat 8/10 Severe 7 d/yr ≥108°F today · 21 d/yr by 30 yrs out
- Wind 9/10 Extreme 99% chance of damaging wind over 30 yrs
- Air quality 3/10 Moderate 2 unhealthy d/yr today · 3 by 30 yrs out
Nearby sold comps map
Loading sold comps map…
Walkable amenities ~0.75 mi
Loading nearby amenities…
Taxation est. · year 1
- Rental income
- $19,176
- − Mortgage interest
- −$7,002
- − Property taxes
- −$1,316
- − Insurance
- −$5,744
- − Repairs & maintenance
- −$1,534
- − Management
- −$1,534
- − Depreciation
- −$3,636
- Taxable loss
- −$1,590
- Est. tax savings @ 24.0%
- +$382
- After-tax cash flow
- $605/yr
For passive investors: Depreciation is non-cash, so a rental often shows a tax loss while cash-flowing — sheltering income. Rental losses are passive: they offset passive income freely, and up to $25,000/yr can offset ordinary (W-2) income if you actively participate and your MAGI is under $100k (phasing out to $0 by $150k); unused losses carry forward. On sale, claimed depreciation is recaptured at up to 25%, and gains may owe capital-gains tax (a 1031 exchange can defer both). Figures are a year-1 estimate at your 24.0% rate — not tax advice; consult a CPA.
Schools (NCES district)
- District
- Livingston Parish
- NCES district ID
- 2201020
- Math proficiency
- 40% ▼ -38.00%
- Reading proficiency
- 52% ▼ -32.00%
- Median HH income
- $56,755
- Composite
- 40.07/100
- National rank
- #3811
- State rank
- #13 of 98 in LA
Livability — Denham Springs
- Score
- 74/100
- State rank
- #29
- US rank
- #4939
Category grades
Schools grade is shown separately in the Schools card above.
Census & demographics
- County
- Livingston Parish · 87,496 people
- City population
- 63,575
- Metro
- Baton Rouge, LA
- Population (ZIP)
- 63,575
- Household income
- $78,621
- Rent vs Own
- Severe rent burden
- 1211.0
Population outlook (Livingston County) Hauer SSP2
- Today (2025)
- 158,511 people
- By 2030
- 168,241 · +6.1%
- By 2040
- 186,252 · +17.5%
- By 2050
- 201,516 · +27.1%
- By 2075
- 231,217 · +45.9%
- By 2100
- 241,697 · +52.5%
Race, ethnicity, and origin ACS 2023
- Neighborhood character
- Predominantly White (74%)
- Race & ethnicity
- White 74% Black 13% Hispanic / Latino 9% Two or more races 6%
- Hispanic origin (detail)
- Mexican 3%
- Common ancestry
- Lithuanian 9% Serbian 1% Italian 1%
- Foreign-born
- 6% · Canada
- Languages at home
- 91% English-only · Spanish 6% Other Indo-European 1%
Political lean MEDSL · Livingston
- 2024 margin
- Solid R (+68.5) · D 15.1% · R 83.6% · Other 1.3%
- 2008→2024 swing
- +3.4pp toward D · 2008: -71.9pp · 2024: -68.5pp
- All cycles
- 2024: R+68.5 2020: R+70.0 2016: R+72.5 2012: R+70.4 2008: R+71.9
Not yet ingested
- Civics
- —
Market trends
- HPI YoY
- ▼ -104.37%
- Current HPI
- 170.2207
- Rent YoY
- ▲ 3.83%
- Metro
- Baton Rouge, LA
- State GDP YoY
- ▲ 3.29%
- F500 in state
- 10
Industry mix (Fortune 500 HQ in LA)
| Industry | F500 HQs | Revenue |
|---|---|---|
| Telecommunications | 2 | $23B |
|
||
| Utilities | 1 | $12B |
|
||
| Wholesale / Distribution | 1 | $5B |
|
||
| Advertising | 1 | $2B |
|
||
Price history
-6.2% since first listed26 events — show timeline
- 2026-06-15 Sold (MLS) $105,000 GSREIN
- 2026-06-15 Sold (MLS) $105,000 AcadianaMLS
- 2026-05-30 Pending — AcadianaMLS
- 2026-05-30 Pending — GSREIN
- 2026-05-19 Listed $125,000 GSREIN
- 2026-05-19 Listed $125,000 AcadianaMLS
- 2026-05-07 Listed $140,000 AcadianaMLS
- 2017-02-27 Sold (Public Records) $109,900 Public Records
- 2017-02-24 Sold (MLS) — GBRMLS
- 2017-02-02 Pending — GBRMLS
- 2017-01-31 Relisted — GBRMLS
- 2017-01-30 Pending — GBRMLS
- 2017-01-19 Listed $116,500 GBRMLS
- 2017-01-19 Listed $116,500 AcadianaMLS
- 2014-07-25 Sold (Public Records) $104,900 Public Records
- 2014-07-24 Sold (MLS) — GBRMLS
- 2014-02-10 Listed $106,900 AcadianaMLS
- 2014-02-10 Listed $106,900 GBRMLS
- 2012-09-03 Listed $102,500 GBRMLS
- 2009-10-19 Sold (Public Records) — Public Records
- 2009-10-14 Sold (MLS) — GBRMLS
- 2009-08-18 Listed $99,500 GBRMLS
- 2009-08-18 Listed $99,500 AcadianaMLS
- 2008-09-14 Listed $111,900 AcadianaMLS
- 2008-09-14 Listed $111,900 GBRMLS
- 2006-06-16 Sold (Public Records) — Public Records
Property tax history
+1.2%/yrLatest (2024): $1,316 · +21.1% YoY. Source: county tax records.
Cash-flow waterfall
monthlySold comps — $/sqft
last 12 mo · ≤1 miLoading sold comps…