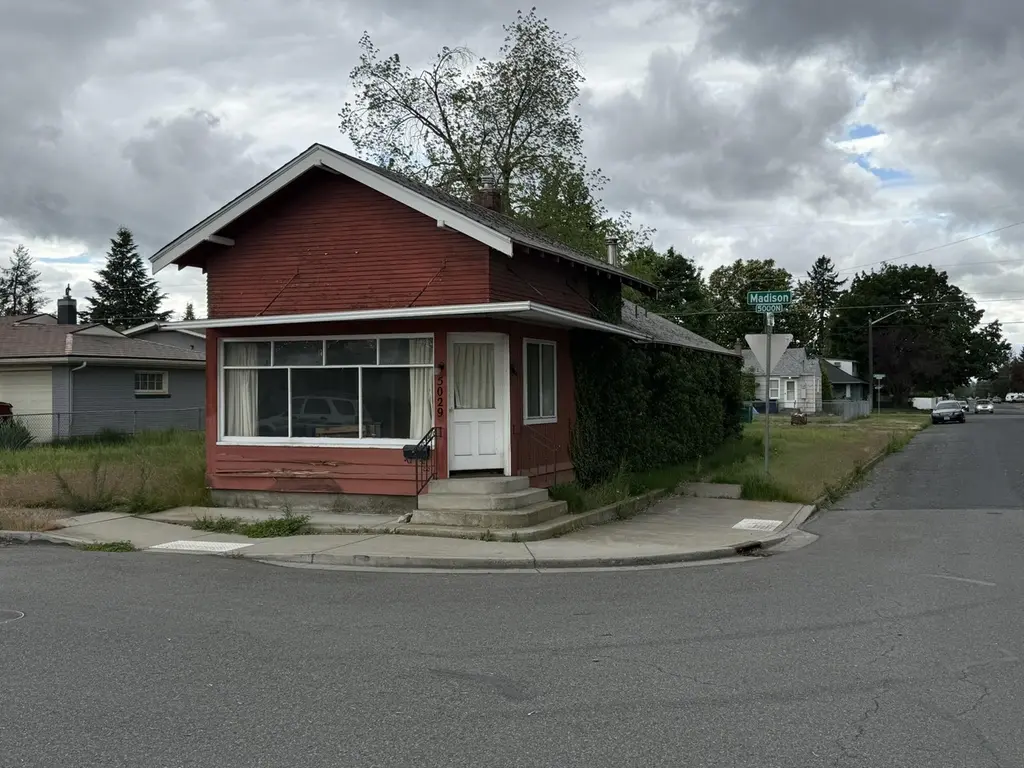
5029 N Madison St · Spokane, WA
Flood risk 1/10 · Minimal
- FEMA flood zone
- X (unshaded)
- Chance of flooding over 30 yrs
- 0.0%
- Est. flood insurance / yr
- $473 – $860
Fire risk 1/10 · Minimal
- Est. fire insurance / yr
- $604 – $1,122
Heat risk 3/10 · Minor
- Hot days now (above 94°F)
- 7 days/yr
- Hot days in 30 yrs
- 15 days/yr
Wind risk 1/10 · Minimal
- Chance of severe wind over 30 yrs
- —
Air-quality risk 10/10 · Severe
- Unhealthy air days now
- 19 days/yr
- Unhealthy air days in 30 yrs
- 21 days/yr
Risk factors via First Street. Map © Google.
Why this score? — see what drove the C grade
The composite is a weighted blend of 9 inputs, each scored 0–100. Each bar is that input's sub-score; the figure is the points it added to the 100-point composite (weight × sub-score).
- Cash flow +17.0/30.0
- ARV discount +15.0/15.0
- DSCR +5.3/10.0
- 1% rule +5.0/10.0
- Schools +4.6/10.0
- Livability +4.0/5.0
- Rent growth +3.3/5.0
- Condition / age +2.5/5.0
- Appreciation +0.0/10.0
$139,900
🖨 Deal sheet 📄 Offer letter ✓ Due diligence
Listing remarks
INVESTOR SPECIAL - BRING YOUR TOOL BELT! Once upon a time, the home was used for a neighborhood market, a dress shop, then a jewelry store. Owner has never lived in the property, it has been a residential rental for several years. Tax records indicate it was originally built in 1928 and there is 1,100 sq/ft on the main level with a basement. Buyer responsibility to verify with jurisdictions on buyers intended use. Multiple Offers - Highest and Best due by 5/18/26 12:00pm.
Key facts
- 6,448 sq ft lot
- Built 1928
- Listed 3 days
Property features AI
Finance
- Financial info: Annual tax noted
Exterior
- Parking: No designated parking
- Utilities: Public water and sewer (implied by city street frontage)
- Home design: Single-family residence; One-story structure; Residential property
- Construction: Wood siding; Composition roof; Built with a foundation (basement present)
- Exterior features: Level, corner lot; Paved road and city street frontage
Interior
- Bedrooms: 2 bedrooms
- Heating & cooling: Natural gas forced air heating
- Interior features: Full finished basement (1,100 below-grade finished area)
Neighborhood map
What this means for you Summary
Snapshot
- This is a 1-bed/1.0-bath single-family listed at $140k.
Deal economics
- At list price, monthly cash flow is $94 ($1k/yr) — positive.
- The deal already cash-flows at list — no discount required.
- Meets the 1% rule at list price ($1k rent vs $140k).
- Cap rate 7.1% vs local median 3.2% in Spokane — top-decile yield for the area; either an underpriced asset or a hidden risk that comps aren't pricing in. Stress-test before assuming the spread holds.
Location & tenants
- Location reads 80/100 on livability (#93 in WA, #1,822 nationally) — a professional / high-income tenant draw. Strengths: amenities A+, commute A+, housing A+; Watch: crime F.
- Spokane School District (urban): math 47% / reading 58% proficiency, ranked #136 of 291 in WA (top 47%) — acceptable for families but not a draw, mixed tenant base, ~2y average lease.
- Zoned schools: Shadle Park High School (1,382 students, 60% FRL).
- Market conditions: Rents rising (+3.2%/yr); 324 active listings in the ZIP; 14 comparable units currently listed for rent nearby; rentals at typical pace (median 23d on market — plan ~3-4 weeks tenant-placement turnaround); solid renter incomes; 3,608 units permitted in Spokane County in 2024 (1,792 in 5+ unit buildings).
Forward outlook
- Local home prices are declining (-3.0%/yr); year-one equity from $967 of loan paydown is wiped out by about $4k of value loss. Plan a longer hold.
- Spokane County population projected at +13% by 2050 — modest demand growth; plan on rents tracking national, not racing it.
Negotiation context
- Only 3 days on market — expect competitive offers; lowballing is unlikely to land.
- Current owner paid $23k; list at $140k implies a 508% gain — meaningful room to come down on a strong offer.
Risks & watch-outs
- Watch-outs: built in 1928 — expect roof / HVAC / electrical / plumbing capex.
Questions for the listing agent
- Built in 1928 — when were the roof, HVAC, electrical panel, plumbing, and water heater last replaced?
- Is there a deadline driving the sale (1031 exchange, divorce, estate, relocation)? That informs how much negotiation room exists.
- Schools are B-rated — typically a magnet for longer-tenancy family renters. What's the average tenant stay here, and is there a school-zone premium baked into asking?
- Crime grade is F in this area — have there been break-ins, vandalism, or insurance claims at this property in the last 3 years? What carrier currently insures it and at what premium?
- What's the average days-on-market for RENTAL listings here right now (not sales)? A rising rental-DOM trend means longer vacancies and softer asking-rent achievability than the comps imply.
- What's the recent tenant-quality profile in this submarket — average credit score on applications, eviction rate, late-payment / NSF rate, and stable-employment percentage? A property-management company in the area should have these aggregated.
- How much new for-sale + rental construction is in the pipeline within 1–3 miles? Heavy new supply typically softens prices + rents 12–24 months out; constrained supply supports both.
Investment metrics
- 1% rule
- 1.00% ✓
- Cap rate
- 7.10%
- Cash-on-cash
- 2.88%
- DSCR
- 1.13
- GRM
- 8.3
CMA / ARV
- ARV (on-the-fly)
- $276,100
- Comps found
- 12
Show comp detail 12 sales within ~0.75 mi
| Address | Dist | Beds/Ba | Sqft | Sold | Price | $/sf | Match |
|---|---|---|---|---|---|---|---|
| 4601 N Adams St | 0.31mi | 2/1.0 (+1) | 1,072 (-2%) | 2mo | $225,000 | $210 | 75 |
| 4601 N Jefferson St | 0.29mi | 2/1.0 (+1) | 1,154 (+5%) | 4mo | $300,000 | $260 | 70 |
| 4609 N Madison St | 0.27mi | 2/1.0 (+1) | 1,005 (-9%) | 1mo | $252,000 | $251 | 67 |
| 4723 N Post St | 0.26mi | 2/1.0 (+1) | 993 (-10%) | 2mo | $285,000 | $287 | 65 |
| 4727 N Stevens St | 0.40mi | 2/1.0 (+1) | 1,153 (+5%) | 9mo | $275,000 | $239 | 61 |
| 4708 N Stevens St | 0.45mi | 2/1.0 (+1) | 990 (-10%) | 8mo | $230,000 | $232 | 51 |
| 1327 W Joseph Ave | 0.42mi | 2/1.0 (+1) | 960 (-13%) | 5mo | $310,000 | $323 | 50 |
| 4218 N Jefferson St | 0.50mi | 2/1.0 (+1) | 1,224 (+11%) | 7mo | $299,900 | $245 | 47 |
| 3928 N Jefferson St | 0.69mi | 1/1.0 | 1,206 (+10%) | 8mo | $255,000 | $211 | 45 |
| 5307 N Walnut St | 0.34mi | 2/1.0 (+1) | 944 (-14%) | 13mo | $298,000 | $316 | 44 |
| 4028 N Post St | 0.66mi | 2/1.0 (+1) | 1,008 (-8%) | 9mo | $299,000 | $297 | 43 |
| 4218 N Hawthorne St | 0.52mi | 2/1.0 (+1) | 1,248 (+14%) | 7mo | $275,000 | $220 | 42 |
Match score weights: distance 35% · size 25% · config 20% · recency 20%. Top-matched comps best support the ARV.
Projected returns pro-forma
-3.0% appreciation · 3.23% rent growth · sell at horizon
- IRR
- -11.4%
- Equity multiple
- 0.58×
- Total profit
- $-16,304
- Equity at exit
- $20,860
- IRR
- -1.8%
- Equity multiple
- 0.87×
- Total profit
- $-4,945
- Equity at exit
- $12,096
Cash invested: $39,172 (down + closing). Projections, not guarantees.
Landlord ↔ Tenant lean methodology
- Overall (STATE)
- 28 Tenant-Leaning
- State Washington
- 28 Tenant-Leaning · D+8
- County
- — inherits STATE
- City
- — inherits STATE
ZIP-level market 99205
- Rents YoY
- 3.2%
- Active inventory
- 324
- Price-to-rent
- 8.3×
Monthly cashflow live
- Estimated rent
- $1,400 high interval (Pro) →
- Mortgage (P&I)
- −$734
- Tax from tax record
- −$220 /mo · $2,636/yr
- Insurance
- −$58
- HOA
- −$0
- Vacancy / Maint / Mgmt
- −$294
- Net cashflow
- $94
Break-even live
UW: 25.0% down · 7.5% · 30yr · 1.5% tax · 5.0% vac · 8.0% maint · 8.0% mgmt
Financing live
Cash to close
- Down payment
- $34,975
- Closing costs
- $4,197
- Reserves months
- —
- Total cash needed
- —
Loan-product check · same deal, 3 products live
Conventional
25% down · 7.5% · 30yr
- Down + closing
- —
- Monthly P&I
- —
- Monthly cashflow
- —
- DSCR
- —
- Eligible?
- —
Personal DTI + credit; lowest rate.
DSCR
20% down · 8.5% · 30yr
- Down + closing
- —
- Monthly P&I
- —
- Monthly cashflow
- —
- DSCR
- —
- Eligible?
- —
No personal income docs; deal must DSCR.
Hard money
10% down · 12.0% · 12mo
- Down + closing
- —
- Monthly P&I
- —
- Monthly cashflow
- —
- DSCR
- —
- Eligible?
- —
Short-term bridge; refi at stabilization.
Rent comps 14 comps
| Address | Beds | Baths | Sqft | Rent | $/sqft | DOM | Units | Dist |
|---|---|---|---|---|---|---|---|---|
| 532 W Columbia Ave Unit 534 Spokane Spokane, WA | 2.0 | 2.0 | 1400 | $1,645 | $1.18 | 23d | 1 | 0.54mi |
| 3909 N Wall St Spokane, WA | 1.0–2.0 | 1.0–2.0 | 775 | $1,790 | $2.31 | 13d | 4 | 0.74mi |
| 714 W Kiernan Ave Unit A Spokane, WA | 2.0 | 1.0 | 1160 | $1,195 | $1.03 | 23d | 1 | 0.86mi |
| 6511 N Cedar Rd Unit D-12 Spokane, WA | 1.0 | 2.0 | 1050 | $1,500 | $1.43 | 23d | 1 | 0.99mi |
| 6029 N Mayfair St Unit 7 Spokane, WA | 1.0 | 1.0 | 725 | $1,025 | $1.41 | 13d | 1 | 1.05mi |
| 6619 N Cedar Rd Unit C-22 Spokane, WA | 1.0 | 1.0 | 825 | $1,315 | $1.59 | 23d | 1 | 1.05mi |
| 6619 N Cedar Rd Unit C-23 Spokane, WA | 1.0 | 1.0 | 825 | $1,315 | $1.59 | 13d | 1 | 1.05mi |
| 6203 N Astor St Spokane, WA | 2.0 | 1.0 | 1100 | $1,400 | $1.27 | 13d | 1 | 1.26mi |
| 6203 N Astor St Unit 2 Spokane, WA | 2.0 | 1.5 | 1100 | $1,400 | $1.27 | 21d | 1 | 1.26mi |
| 139 W Gray Ct Unit 110 Spokane, WA | 2.0 | 1.0 | 935 | $1,295 | $1.39 | 23d | 1 | 1.26mi |
| 510 E Dalke Ave Spokane, WA | 2.0 | 1.0 | 1500 | $1,595 | $1.06 | 21d | 1 | 1.29mi |
| 6107 N Standard St Spokane, WA | 2.0 | 1.5 | 850 | $2,350 | $2.76 | 23d | 1 | 1.38mi |
| 824 E North Ave Unit 824 Spokane, WA | 2.0 | 1.0 | 770 | $1,195 | $1.55 | 23d | 1 | 1.43mi |
| 121 E Wedgewood Ave Spokane, WA | 1.0–3.0 | 1.0–1.5 | 833 | $1,005 | $1.21 | 13d | 17 | 1.47mi |
Listing history 3 events
-
2026-05-18status Pending
-
2026-05-15$139,900 Active
-
1977-09-01soldstatus $23,000
ⓘ Source: listings_history table (triggers on properties + properties_extension) + one-shot
backfill from property_details.listing_events for pre-trigger history.
Tax reassessment forecast WA · Resets to sale price
- Current annual tax
- $2,636 · $220/mo
- Projected year-2 tax
- $2,636 · $220/mo
- Expected delta
- $0/yr ($0/mo · 0.0%)
ⓘ Screening estimate from a state-policy table — verify with the county assessor before closing.
Climate risk First Street
- Flood 1/10 Low FEMA zone X (unshaded) · 0% chance over 30 yrs
- Wildfire 1/10 Low
- Heat 3/10 Moderate 7 d/yr ≥94°F today · 15 d/yr by 30 yrs out
- Wind 1/10 Low
- Air quality 10/10 Extreme 19 unhealthy d/yr today · 21 by 30 yrs out
Nearby sold comps map
Loading sold comps map…
Walkable amenities ~0.75 mi
Loading nearby amenities…
Taxation est. · year 1
- Rental income
- $16,795
- − Mortgage interest
- −$7,837
- − Property taxes
- −$2,636
- − Insurance
- −$700
- − Repairs & maintenance
- −$1,344
- − Management
- −$1,344
- − Depreciation
- −$4,070
- Taxable loss
- −$1,134
- Est. tax savings @ 24.0%
- +$272
- After-tax cash flow
- $1,401/yr
For passive investors: Depreciation is non-cash, so a rental often shows a tax loss while cash-flowing — sheltering income. Rental losses are passive: they offset passive income freely, and up to $25,000/yr can offset ordinary (W-2) income if you actively participate and your MAGI is under $100k (phasing out to $0 by $150k); unused losses carry forward. On sale, claimed depreciation is recaptured at up to 25%, and gains may owe capital-gains tax (a 1031 exchange can defer both). Figures are a year-1 estimate at your 24.0% rate — not tax advice; consult a CPA.
Schools (NCES district)
- District
- Spokane School District
- NCES district ID
- 5308250
- Math proficiency
- 47% ▲ 1.00%
- Reading proficiency
- 58% ▲ 1.00%
- Median HH income
- $43,187
- Composite
- 46.1/100
- National rank
- #5477
- State rank
- #136 of 291 in WA
Livability — Spokane
- Score
- 80/100
- State rank
- #93
- US rank
- #1822
Category grades
Schools grade is shown separately in the Schools card above.
Census & demographics
- Census place
- Spokane, WA
- County
- Spokane County · 496,401 people
- City population
- 298,820
- Metro
- Spokane-Spokane Valley, WA
- Population (ZIP)
- 43,169
- Household income
- $77,374
- Rent vs Own
- Severe rent burden
- 965.0
Population outlook (Spokane County) Hauer SSP2
- Today (2025)
- 531,314 people
- By 2030
- 549,278 · +3.4%
- By 2040
- 577,822 · +8.8%
- By 2050
- 598,188 · +12.6%
- By 2075
- 630,744 · +18.7%
- By 2100
- 622,360 · +17.1%
Race, ethnicity, and origin ACS 2023
- Neighborhood character
- Predominantly White (81%)
- Race & ethnicity
- White 81% Two or more races 10% Hispanic / Latino 7% Asian 2% Black 1% Native American 1%
- Hispanic origin (detail)
- Mexican 4%
- Common ancestry
- Portuguese 5% Slovak 3% Romanian 2%
- Foreign-born
- 3% · Canada, Philippines
- Languages at home
- 94% English-only · Spanish 2% Other Asian/Pacific 1% Russian/Polish/Slavic 1%
Political lean MEDSL · Spokane
- 2024 margin
- Toss-up / Even · D 46.0% · R 51.0% · Other 3.0%
- 2008→2024 swing
- -3.8pp toward R · 2008: -1.1pp · 2024: -5.0pp
- All cycles
- 2024: R+5.0 2020: R+4.3 2016: R+8.3 2012: R+6.3 2008: R+1.1
Not yet ingested
- Civics
- —
Market trends
- HPI YoY
- ▼ -475.69%
- Current HPI
- 377.1519
- Rent YoY
- ▲ 3.23%
- Metro
- Spokane-Spokane Valley, WA
- State GDP YoY
- ▲ 4.65%
- F500 in state
- 22
Industry mix (Fortune 500 HQ in WA)
| Industry | F500 HQs | Revenue |
|---|---|---|
| Retail | 2 | $269B |
|
||
| Technology / Retail | 1 | $638B |
|
||
| Technology | 1 | $245B |
|
||
| Telecommunications | 1 | $38B |
|
||
| Food / Beverage | 1 | $36B |
|
||
| Automotive / Trucks | 1 | $34B |
|
||
Price history
+508.3% since first listed3 events — show timeline
- 2026-05-18 Pending — SPOKANEMLS as Distributed by MLS Grid
- 2026-05-15 Listed $139,900 SPOKANEMLS as Distributed by MLS Grid
- 1977-09-01 Sold (Public Records) $23,000 Public Records
Property tax history
+6.1%/yrLatest (2026): $2,636 · +0.7% YoY. Source: county tax records.
Cash-flow waterfall
monthlySold comps — $/sqft
last 12 mo · ≤1 miLoading sold comps…