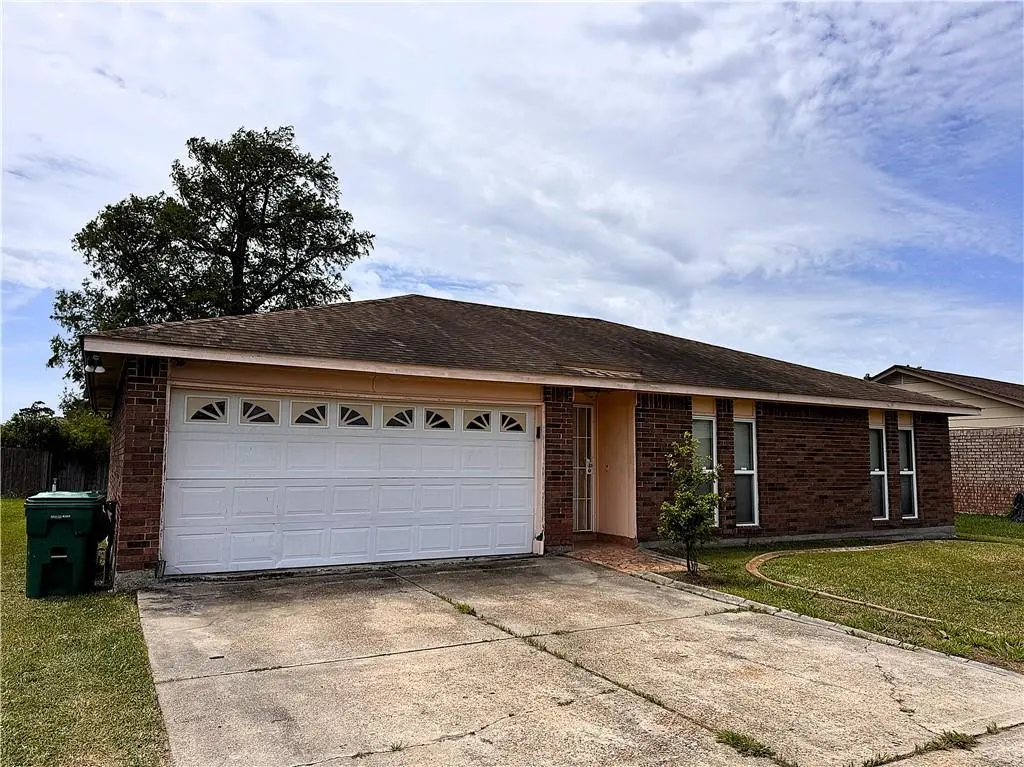
2476 Paige Janette Dr · Woodmere, LA
Flood risk 8/10 · Major
- FEMA flood zone
- X
- Chance of flooding over 30 yrs
- 0.6%
- Est. flood insurance / yr
- $507 – $1,088
Fire risk 1/10 · Minimal
- Est. fire insurance / yr
- $1,269 – $2,357
Heat risk 10/10 · Severe
- Hot days now (above 108°F)
- 7 days/yr
- Hot days in 30 yrs
- 21 days/yr
Wind risk 10/10 · Severe
- Chance of severe wind over 30 yrs
- 99.0%
Air-quality risk 3/10 · Minor
- Unhealthy air days now
- 3 days/yr
- Unhealthy air days in 30 yrs
- 4 days/yr
Risk factors via First Street. Map © Google.
Why this score? — see what drove the B- grade
The composite is a weighted blend of 9 inputs, each scored 0–100. Each bar is that input's sub-score; the figure is the points it added to the 100-point composite (weight × sub-score).
- Cash flow +26.0/30.0
- ARV discount +15.0/15.0
- DSCR +8.8/10.0
- 1% rule +6.6/10.0
- Livability +3.1/5.0
- Schools +2.5/10.0
- Condition / age +2.5/5.0
- Rent growth +1.5/5.0
- Appreciation +0.0/10.0
$159,900
🖨 Deal sheet 📄 Offer letter ✓ Due diligence
Listing remarks MLS
3 bedroom 2 bath home. Spacious living and kitchen area. Convenient location. Home in need of some repairs and updating.
Key facts
- Fenced yard
- Convenient location
- 6,969 sq ft lot
Tags
Property features AI
Exterior
- Parking: Attached garage with two spaces and garage door opener
- Utilities: Public water; Public sewer; Electric service (standard central systems for heating and cooling)
- Home design: Single-story; Brick construction; Shingle roof; Average condition; Slab foundation
- Construction: Brick construction; Shingle roof; Slab foundation; Built on a single story
- Exterior features: Covered concrete patio/porch; City lot; Rectangular lot; Lot dimensions approximately 70 x 100
Interior
- Kitchen: Dishwasher
- Bedrooms: 6 total rooms (includes bedrooms and living spaces)
- Bathrooms: 2 full bathrooms
- Heating & cooling: Central heating; Central air conditioning
- Interior features: Ceiling fan(s); Cable TV
- Laundry & utility: Washer hookup; Dryer hookup
Neighborhood map
What this means for you Summary
Snapshot
- This is a 3-bed/2.0-bath single-family listed at $160k.
Deal economics
- At list price, monthly cash flow is $334 ($4k/yr) — positive.
- The deal already cash-flows at list — no discount required.
- Meets the 1% rule at list price ($2k rent vs $160k).
- Recommended offer: $155k (3.0% below list) — sets the bar for market timing.
- Cap rate 9.3% vs local median 6.7% in Woodmere — top-decile yield for the area; either an underpriced asset or a hidden risk that comps aren't pricing in. Stress-test before assuming the spread holds.
Location & tenants
- Location reads 62/100 on livability (#216 in LA) — a middle-class / working-renter tenant base. Strengths: cost of living A+, housing A+; Watch: schools F, crime F, amenities F.
- Jefferson Parish (suburban): math 24% / reading 34% proficiency, ranked #44 of 98 in LA (top 45%) — low school quality limits family demand, transient renter base, plan for 1-2y turnover; 70% free/reduced lunch — lower-income household profile, screen leases tightly.
- Market conditions: Rents falling (-3.9%/yr); 187 active listings in the ZIP; 14 comparable units currently listed for rent nearby; rentals at typical pace (median 24d on market — plan ~3-4 weeks tenant-placement turnaround); 43% of comp listings sitting > 30 days — soft ceiling on asking rent; 518 units permitted in Jefferson Parish in 2024 (43 in 5+ unit buildings).
- This rent runs 36% of the median local income ($62k/yr) — at the standard rent-burdened threshold; future hikes will face affordability resistance.
Forward outlook
- Local home prices are declining (-3.0%/yr); year-one equity from $1k of loan paydown is wiped out by about $5k of value loss. Plan a longer hold.
Negotiation context
- It's been on market 51 days — a 3% lower offer ($155k) is reasonable based on typical stale-listing flexibility.
- 9 sale attempts since 12y ago with the ask held roughly flat each time — persistent listings suggest the price (not the market) is what's stuck; bring a comps-based counter.
Risks & watch-outs
- Watch-outs: flood insurance adds $66/mo.
- Climate carrying-cost: severe flood risk; severe wind risk, 99% chance of damaging wind over 30y; extreme-heat days projected 7→21/yr by 2055 (HVAC capex compounding) — expect insurance premiums to compound above CPI over the hold.
Questions for the listing agent
- It's been on market 51 days. Have you received any prior offers? Is the seller open to a 3% concession, seller financing, or rate buy-down credit?
- Built in 1977 — when were the roof, HVAC, electrical panel, plumbing, and water heater last replaced?
- What's the actual annual flood-insurance premium (NFIP or private), and is the property in a SFHA with mandatory coverage?
- Is there a deadline driving the sale (1031 exchange, divorce, estate, relocation)? That informs how much negotiation room exists.
- Schools are F-rated, which usually means shorter tenancies and higher turnover. Who's the typical renter profile here, and what's been the actual vacancy rate?
- Crime grade is F in this area — have there been break-ins, vandalism, or insurance claims at this property in the last 3 years? What carrier currently insures it and at what premium?
- What's the average days-on-market for RENTAL listings here right now (not sales)? A rising rental-DOM trend means longer vacancies and softer asking-rent achievability than the comps imply.
- What's the recent tenant-quality profile in this submarket — average credit score on applications, eviction rate, late-payment / NSF rate, and stable-employment percentage? A property-management company in the area should have these aggregated.
- How much new for-sale + rental construction is in the pipeline within 1–3 miles? Heavy new supply typically softens prices + rents 12–24 months out; constrained supply supports both.
Investment metrics
- 1% rule
- 1.16% ✓
- Cap rate
- 9.29%
- Cash-on-cash
- 10.72%
- DSCR
- 1.48
- GRM
- 7.2
CMA / ARV
- ARV (median comp)
- $218,082
- List price
- $159,900
- Delta
- -26.68%
- Verdict
- UNDERPRICED
- Comps
- 20 within 1.0 mi
Show comp detail 12 sales within ~0.75 mi
| Address | Dist | Beds/Ba | Sqft | Sold | Price | $/sf | Match |
|---|---|---|---|---|---|---|---|
| 2405 Tattersall Dr | 0.22mi | 3/2.0 | 1,365 (-0%) | 8mo | $228,250 | $167 | 82 |
| 2433 Lynnbrook Dr | 0.13mi | 4/2.0 (+1) | 1,437 (+5%) | 5mo | $189,000 | $132 | 77 |
| 2445 Tattersall Dr | 0.11mi | 3/2.0 | 1,500 (+9%) | 10mo | $220,000 | $147 | 71 |
| 3837 Eastview Dr | 0.35mi | 3/2.0 | 1,500 (+9%) | 5mo | $227,500 | $152 | 64 |
| 2800 Cardinal Dr | 0.75mi | 3/2.0 | 1,350 (-2%) | 1mo | $180,000 | $133 | 62 |
| 4057 N Dells St | 0.40mi | 3/2.0 | 1,300 (-5%) | 14mo | $200,000 | $154 | 61 |
| 3729 Eastview Dr | 0.50mi | 3/2.0 | 1,450 (+6%) | 10mo | $225,500 | $156 | 59 |
| 2764 Foliage Dr | 0.57mi | 3/2.0 | 1,300 (-5%) | 7mo | $260,000 | $200 | 58 |
| 4045 N Indigo Dr | 0.43mi | 3/2.0 | 1,501 (+9%) | 11mo | $242,000 | $161 | 55 |
| 4048 N Dells St | 0.41mi | 3/2.0 | 1,559 (+14%) | 4mo | $130,000 | $83 | 54 |
| 4056 S Windmere St | 0.55mi | 3/2.0 | 1,281 (-7%) | 14mo | $187,000 | $146 | 52 |
| 2932 Cardinal Dr | 0.48mi | 4/2.0 (+1) | 1,225 (-11%) | 5mo | $193,000 | $158 | 51 |
Match score weights: distance 35% · size 25% · config 20% · recency 20%. Top-matched comps best support the ARV.
Projected returns pro-forma
-3.0% appreciation · 0.0% rent growth · sell at horizon
- IRR
- -6.3%
- Equity multiple
- 0.78×
- Total profit
- $-10,063
- Equity at exit
- $23,842
- IRR
- -0.8%
- Equity multiple
- 0.95×
- Total profit
- $-2,251
- Equity at exit
- $13,825
Cash invested: $44,772 (down + closing). Projections, not guarantees.
Landlord ↔ Tenant lean methodology
- Overall (STATE)
- 90 Strongly Landlord-Friendly
- State Louisiana
- 90 Strongly Landlord-Friendly · R+12
- County
- — inherits STATE
- City
- — inherits STATE
ZIP-level market 70058
- Rents YoY
- -3.9%
- Active inventory
- 187
- Price-to-rent
- 7.2×
Monthly cashflow live
- Estimated rent
- $1,856 high interval (Pro) →
- Mortgage (P&I)
- −$839
- Tax from tax record
- −$161 /mo · $1,938/yr
- Insurance
- −$67
- Flood insurance flood zone
- −$66 /mo · $798/yr
- HOA
- −$0
- Vacancy / Maint / Mgmt
- −$390
- Net cashflow
- $334
Break-even live
UW: 25.0% down · 7.5% · 30yr · 1.5% tax · 5.0% vac · 8.0% maint · 8.0% mgmt
Financing live
Cash to close
- Down payment
- $39,975
- Closing costs
- $4,797
- Reserves months
- —
- Total cash needed
- —
Loan-product check · same deal, 3 products live
Conventional
25% down · 7.5% · 30yr
- Down + closing
- —
- Monthly P&I
- —
- Monthly cashflow
- —
- DSCR
- —
- Eligible?
- —
Personal DTI + credit; lowest rate.
DSCR
20% down · 8.5% · 30yr
- Down + closing
- —
- Monthly P&I
- —
- Monthly cashflow
- —
- DSCR
- —
- Eligible?
- —
No personal income docs; deal must DSCR.
Hard money
10% down · 12.0% · 12mo
- Down + closing
- —
- Monthly P&I
- —
- Monthly cashflow
- —
- DSCR
- —
- Eligible?
- —
Short-term bridge; refi at stabilization.
Rent comps 14 comps
| Address | Beds | Baths | Sqft | Rent | $/sqft | DOM | Units | Dist |
|---|---|---|---|---|---|---|---|---|
| 4016 S Dells St Harvey, LA | 4.0 | 2.0 | 1750 | $2,000 | $1.14 | 43d | 1 | 0.34mi |
| 3019 Aspin Dr Harvey, LA | 3.0 | 1.0 | 900 | $1,600 | $1.78 | 23d | 1 | 0.51mi |
| 3014 Destrehan Ave Harvey, LA | 2.0 | 2.0 | 1150 | $1,600 | $1.39 | 43d | 1 | 0.53mi |
| 2236 Litchwood Ln Harvey, LA | 4.0 | 2.0 | 1800 | $2,200 | $1.22 | 3d | 1 | 0.56mi |
| 2236 Litchwood Ln Harvey, LA | 4.0 | 2.0 | 1800 | $2,200 | $1.22 | 1d | 1 | 0.56mi |
| 2612 Susie Ct Marrero, LA | 3.0 | 2.0 | 1852 | $2,200 | $1.19 | 19d | 1 | 0.87mi |
| 2632 Dove Ave Unit NA Marrero, LA | 3.0 | 2.0 | 1250 | $1,650 | $1.32 | 43d | 1 | 1.02mi |
| 5118 Ehret Rd Unit B Marrero, LA | 3.0 | 2.5 | 1275 | $1,800 | $1.41 | 4d | 1 | 1.28mi |
| 2713 W Friendship Dr Harvey, LA | 3.0 | 2.0 | 1750 | $1,850 | $1.06 | 23d | 1 | 1.30mi |
| 2325 Wilton St Unit A Marrero, LA | 2.0 | 1.0 | 1000 | $1,200 | $1.20 | 43d | 1 | 1.37mi |
| 2323 N Harper Dr Harvey, LA | 3.0 | 2.0 | 1678 | $3,000 | $1.79 | 43d | 1 | 1.40mi |
| 5007 Towering Oaks Ave Marrero, LA | 3.0 | 2.0 | 1400 | $1,700 | $1.21 | 43d | 1 | 1.43mi |
| 5045 Dueling Oaks Ave Marrero, LA | 3.0 | 2.0 | 1300 | $1,700 | $1.31 | 23d | 1 | 1.46mi |
| 2425 Ramsey Dr Marrero, LA | 4.0 | 2.0 | 1500 | $1,800 | $1.20 | 1d | 1 | 1.48mi |
Listing history 28 events
-
2026-06-18days on market $159,900 Active 51 DOM
-
2026-06-17days on market $159,900 Active 50 DOM
-
2026-06-16days on market $159,900 Active 49 DOM
-
2026-06-15days on market $159,900 Active 48 DOM
-
2026-06-13days on market $159,900 Active 46 DOM
-
2026-06-10days on market $159,900 Active 43 DOM
-
2026-06-09days on market $159,900 Active 42 DOM
-
2026-06-08days on market $159,900 Active 41 DOM
-
2026-06-07days on market $159,900 Active 40 DOM
-
2026-06-03days on market $159,900 Active 36 DOM
-
2026-06-02days on market $159,900 Active 35 DOM
-
2026-06-01days on market $159,900 Active 34 DOM
-
2026-05-31days on market $159,900 Active 33 DOM
-
2026-05-09status Pending 120-char remark
Show marketing remark (120 chars)
3 bedroom 2 bath home. Spacious living and kitchen area. Convenient location. Home in need of some repairs and updating.
-
2026-05-09historical Active Under Contract 120-char remark
Show marketing remark (120 chars)
3 bedroom 2 bath home. Spacious living and kitchen area. Convenient location. Home in need of some repairs and updating.
-
2026-04-28$159,900 Active 120-char remark
Show marketing remark (120 chars)
3 bedroom 2 bath home. Spacious living and kitchen area. Convenient location. Home in need of some repairs and updating.
-
2026-04-28$159,900 Active 120-char remark
Show marketing remark (120 chars)
3 bedroom 2 bath home. Spacious living and kitchen area. Convenient location. Home in need of some repairs and updating.
-
2020-05-19soldstatus $155,000
-
2020-05-15soldstatus $155,000 Closed
-
2020-03-12status Pending
-
2020-02-05status Active
-
2020-01-31historical
-
2020-01-28$155,000
-
2020-01-28$155,000 Active
-
2014-07-25soldstatus $98,000
-
2014-07-24soldstatus $98,000
-
2014-05-20$100,000
-
2014-05-20$100,000
ⓘ Source: listings_history table (triggers on properties + properties_extension) + one-shot
backfill from property_details.listing_events for pre-trigger history.
Tax reassessment forecast LA · Resets to sale price
- Current annual tax
- $1,938 · $161/mo
- Projected year-2 tax
- $1,938 · $161/mo
- Expected delta
- $0/yr ($0/mo · 0.0%)
ⓘ Screening estimate from a state-policy table — verify with the county assessor before closing.
Climate risk First Street
- Flood 8/10 Severe FEMA zone X · 60% chance over 30 yrs
- Wildfire 1/10 Low
- Heat 10/10 Extreme 7 d/yr ≥108°F today · 21 d/yr by 30 yrs out
- Wind 10/10 Extreme 99% chance of damaging wind over 30 yrs
- Air quality 3/10 Moderate 3 unhealthy d/yr today · 4 by 30 yrs out
Nearby sold comps map
Loading sold comps map…
Walkable amenities ~0.75 mi
Loading nearby amenities…
Taxation est. · year 1
- Rental income
- $22,278
- − Mortgage interest
- −$8,957
- − Property taxes
- −$1,938
- − Insurance
- −$1,597
- − Repairs & maintenance
- −$1,782
- − Management
- −$1,782
- − Depreciation
- −$4,652
- Taxable income
- $1,570
- Est. tax owed @ 24.0%
- −$377
- After-tax cash flow
- $3,626/yr
For passive investors: Depreciation is non-cash, so a rental often shows a tax loss while cash-flowing — sheltering income. Rental losses are passive: they offset passive income freely, and up to $25,000/yr can offset ordinary (W-2) income if you actively participate and your MAGI is under $100k (phasing out to $0 by $150k); unused losses carry forward. On sale, claimed depreciation is recaptured at up to 25%, and gains may owe capital-gains tax (a 1031 exchange can defer both). Figures are a year-1 estimate at your 24.0% rate — not tax advice; consult a CPA.
Schools (NCES district)
- District
- Jefferson Parish
- NCES district ID
- 2200840
- Math proficiency
- 24% ▼ -36.00%
- Reading proficiency
- 34% ▼ -30.00%
- Median HH income
- $48,421
- Composite
- 25.19/100
- National rank
- #7511
- State rank
- #44 of 98 in LA
Livability — Woodmere
- Score
- 62/100
- State rank
- #216
- US rank
- #16658
Category grades
Schools grade is shown separately in the Schools card above.
Census & demographics
- Census place
- Woodmere, LA
- County
- Jefferson Parish · 426,999 people
- Metro
- New Orleans-Metairie, LA
- Population (ZIP)
- 39,578
- Household income
- $62,416
- Rent vs Own
- Severe rent burden
- 1992.0
Population outlook (Jefferson County) Hauer SSP2
- Today (2025)
- 451,696 people
- By 2030
- 455,451 · +0.8%
- By 2040
- 458,308 · +1.5%
- By 2050
- 461,031 · +2.1%
- By 2075
- 476,351 · +5.5%
- By 2100
- 499,377 · +10.6%
Race, ethnicity, and origin ACS 2023
- Neighborhood character
- Diverse neighborhood (Simpson 0.60)
- Race & ethnicity
- Black 58% White 20% Hispanic / Latino 13% Asian 7% Two or more races 4%
- Hispanic origin (detail)
- Mexican 1% Dominican 1%
- Common ancestry
- Lithuanian 4% Hispanic 1%
- Foreign-born
- 13% · Canada, Vietnam
- Languages at home
- 81% English-only · Spanish 10% Vietnamese 5% French/Haitian/Cajun 2%
Political lean MEDSL · Jefferson
- 2024 margin
- R (+12.9) · D 42.5% · R 55.5% · Other 2.1%
- 2008→2024 swing
- +13.6pp toward D · 2008: -26.6pp · 2024: -12.9pp
- All cycles
- 2024: R+12.9 2020: R+11.1 2016: R+14.8 2012: R+18.4 2008: R+26.6
Not yet ingested
- Civics
- —
Market trends
- HPI YoY
- ▼ -96.82%
- Current HPI
- 156.1052
- Rent YoY
- ▼ -3.88%
- Metro
- New Orleans-Metairie, LA
- State GDP YoY
- ▲ 3.29%
- F500 in state
- 10
Industry mix (Fortune 500 HQ in LA)
| Industry | F500 HQs | Revenue |
|---|---|---|
| Telecommunications | 2 | $23B |
|
||
| Utilities | 1 | $12B |
|
||
| Wholesale / Distribution | 1 | $5B |
|
||
| Advertising | 1 | $2B |
|
||
Price history
+59.9% since first listed17 events — show timeline
- 2026-05-26 Relisted — AcadianaMLS
- 2026-05-26 Relisted — GSREIN
- 2026-05-09 Pending — AcadianaMLS
- 2026-05-09 Contingent — GSREIN
- 2026-04-28 Listed $159,900 GSREIN
- 2026-04-28 Listed $159,900 AcadianaMLS
- 2020-05-19 Sold (Public Records) $155,000 Public Records
- 2020-05-15 Sold (MLS) $155,000 GSREIN
- 2020-03-12 Pending — GSREIN
- 2020-02-05 Relisted — GSREIN
- 2020-01-31 Listing Removed — GSREIN
- 2020-01-28 Listed $155,000 GSREIN
- 2020-01-28 Listed $155,000 AcadianaMLS
- 2014-07-25 Sold (Public Records) $98,000 Public Records
- 2014-07-24 Sold (MLS) $98,000 GSREIN
- 2014-05-20 Listed $100,000 AcadianaMLS
- 2014-05-20 Listed $100,000 GSREIN
Property tax history
+4.8%/yrLatest (2025): $1,938 · +0.3% YoY. Source: county tax records.
Cash-flow waterfall
monthlySold comps — $/sqft
last 12 mo · ≤1 miLoading sold comps…