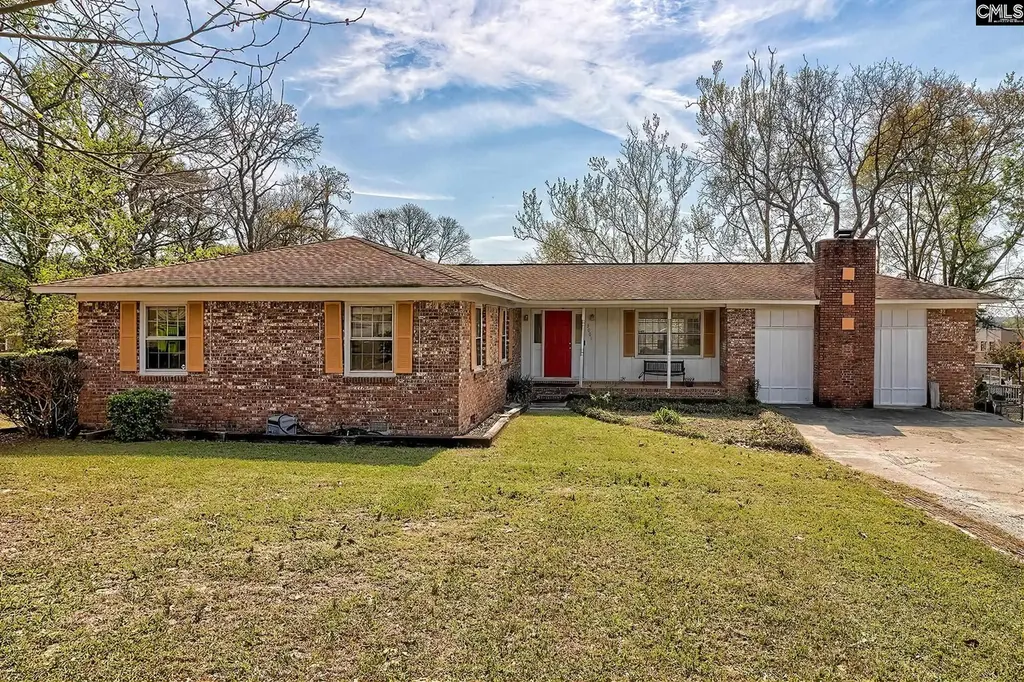
3001 Prestwick Cir · Dentsville, SC
Flood risk 1/10 · Minimal
- FEMA flood zone
- X (unshaded)
- Chance of flooding over 30 yrs
- 0.0%
- Est. flood insurance / yr
- $507 – $1,088
Fire risk 3/10 · Minor
- Est. fire insurance / yr
- $783 – $1,453
Heat risk 7/10 · Major
- Hot days now (above 108°F)
- 7 days/yr
- Hot days in 30 yrs
- 16 days/yr
Wind risk 6/10 · Moderate
- Chance of severe wind over 30 yrs
- 67.0%
Air-quality risk 3/10 · Minor
- Unhealthy air days now
- 3 days/yr
- Unhealthy air days in 30 yrs
- 3 days/yr
Risk factors via First Street. Map © Google.
Why this score? — see what drove the C- grade
The composite is a weighted blend of 9 inputs, each scored 0–100. Each bar is that input's sub-score; the figure is the points it added to the 100-point composite (weight × sub-score).
- Cash flow +21.0/30.0
- ARV discount +7.5/15.0
- DSCR +6.7/10.0
- 1% rule +4.7/10.0
- Schools +3.6/10.0
- Livability +3.6/5.0
- Rent growth +2.6/5.0
- Condition / age +2.5/5.0
- Appreciation +0.0/10.0
$199,900
🖨 Deal sheet 📄 Offer letter ✓ Due diligence
Listing remarks
Back on the market not fault to seller. Welcome to 3001 Prestwick Circle, this home offers solid bones, generous space, and strong potential. Located on a spacious . 59-acre lot with no HOA restrictions, this 2089 square foot home presents a rare opportunity combining size, location, and flexibility. The home features 4 bedrooms, 2 full baths, a dedicated den, and an expansive great room, providing plenty of room to live, work, and gather. Step outside to an elevated patio overlooking your private half-acre, ideal for relaxing, entertaining, or future projects limited only by your imagination. Original hardwood floors create a warm homey feeling , ready for your vision—whether you&rsq
Key facts
- Private half-acre
- Spacious lot
- No hoa restrictions
Tags
Property features AI
Finance
- Other: Cable TV available
Exterior
- Utilities: Public water; Public sewer
- Home design: Single-family property; Single-story layout (main level living and bedrooms)
- Construction: Brick exterior above foundation; Crawlspace foundation
- Exterior features: Covered front porch; Deck; Chain-link fencing in rear
Interior
- Kitchen: Formica countertops; Stained wood cabinets; Laminate flooring; Smooth-surface range; Refrigerator
- Bedrooms: Master bedroom on main level with private bath, tub/shower, ceiling fan, hardwood floors; Bedroom 2 on main level with shared bath and hardwood floors; Bedroom 3 on main level with shared bath and hardwood floors; Bedroom 4 on main level with shared bath
- Flooring: Hardwood floors in bedrooms; Carpet in great room; Laminate flooring in kitchen
- Bathrooms: Two full bathrooms (including master bath)
- Heating & cooling: Heat pump serving first level (heating and cooling)
- Interior features: One wood-burning fireplace; Refrigerator included; Smooth-surface range
- Laundry & utility: Main-level laundry in closet
Neighborhood map
What this means for you Summary
Snapshot
- This is a 3-bed/2.0-bath single-family listed at $200k.
Deal economics
- At list price, monthly cash flow is $281 ($3k/yr) — positive.
- The deal already cash-flows at list — no discount required.
- To meet the 1% rule (rent ≥ 1% of price), the offer needs to be $194k (2.7% below list).
- Recommended offer: $188k (6.0% below list) — sets the bar for market timing.
Location & tenants
- Location reads 71/100 on livability (#50 in SC) — a middle-class / working-renter tenant base. Strengths: cost of living A+, health & safety A+, housing A; Watch: amenities D+, crime F, commute F.
- Richland 02 (suburban): math 35% / reading 47% proficiency, ranked #29 of 80 in SC (top 36%) — families likely to look elsewhere, expect single-tenant / working-renter base with shorter leases.
- Zoned schools: Windsor Elementary (math 21% / reading 23%, grade F, #475 of 597 statewide, top 81%, 537 students, 100% FRL) — zoned schools average 100% FRL vs 38% district-wide (62 pts higher); higher-poverty schools than district average — tighter screening recommended.
- Zoned-school proficiency averages 22% at this address vs 41% district-wide (-19 pts) — the specific schools serving this property underperform the Richland 02 average; the district grade overstates school quality for this exact location.
- Market conditions: Rents flat; 341 active listings in the ZIP; 6 comparable units currently listed for rent nearby; rentals at typical pace (median 21d on market — plan ~3-4 weeks tenant-placement turnaround); 3,472 units permitted in Richland County in 2024 (1,096 in 5+ unit buildings).
- This rent runs 37% of the median local income ($62k/yr) — at the standard rent-burdened threshold; future hikes will face affordability resistance.
Forward outlook
- Local home prices are declining (-3.0%/yr); year-one equity from $1k of loan paydown is wiped out by about $6k of value loss. Plan a longer hold.
- Richland County population projected at +30% by 2050 — long-run rental-demand tailwind backs the buy-and-hold thesis.
Negotiation context
- It's been on market 63 days — a 6% lower offer ($188k) is reasonable based on typical stale-listing flexibility.
- 5 sale attempts with the ask held roughly flat each time — persistent listings suggest the price (not the market) is what's stuck; bring a comps-based counter.
- Current owner paid $131k; list at $200k implies a 53% gain — meaningful room to come down on a strong offer.
Risks & watch-outs
- Climate carrying-cost: major wind risk, 67% chance of damaging wind over 30y; extreme-heat days projected 7→16/yr by 2055 (HVAC capex compounding) — expect insurance premiums to compound above CPI over the hold.
Questions for the listing agent
- It's been on market 63 days. Have you received any prior offers? Is the seller open to a 6% concession, seller financing, or rate buy-down credit?
- Built in 1968 — when were the roof, HVAC, electrical panel, plumbing, and water heater last replaced?
- Why hasn't it sold? Are there any deal-killer items the seller is aware of (foundation, flood, title, zoning, code violations)?
- Is there a deadline driving the sale (1031 exchange, divorce, estate, relocation)? That informs how much negotiation room exists.
- Schools are D-rated, which usually means shorter tenancies and higher turnover. Who's the typical renter profile here, and what's been the actual vacancy rate?
- Crime grade is F in this area — have there been break-ins, vandalism, or insurance claims at this property in the last 3 years? What carrier currently insures it and at what premium?
- What's the average days-on-market for RENTAL listings here right now (not sales)? A rising rental-DOM trend means longer vacancies and softer asking-rent achievability than the comps imply.
- What's the recent tenant-quality profile in this submarket — average credit score on applications, eviction rate, late-payment / NSF rate, and stable-employment percentage? A property-management company in the area should have these aggregated.
- How much new for-sale + rental construction is in the pipeline within 1–3 miles? Heavy new supply typically softens prices + rents 12–24 months out; constrained supply supports both.
Investment metrics
- 1% rule
- 0.97% ✗
- Cap rate
- 7.98%
- Cash-on-cash
- 6.02%
- DSCR
- 1.27
- GRM
- 8.6
CMA / ARV
No comps found within radius.
Projected returns pro-forma
-3.0% appreciation · 0.21% rent growth · sell at horizon
- IRR
- -10.0%
- Equity multiple
- 0.64×
- Total profit
- $-19,875
- Equity at exit
- $29,806
- IRR
- -4.6%
- Equity multiple
- 0.73×
- Total profit
- $-15,095
- Equity at exit
- $17,284
Cash invested: $55,972 (down + closing). Projections, not guarantees.
Landlord ↔ Tenant lean methodology
- Overall (STATE)
- 90 Strongly Landlord-Friendly
- State South Carolina
- 90 Strongly Landlord-Friendly · R+6
- County
- — inherits STATE
- City
- — inherits STATE
ZIP-level market 29223
- Rents YoY
- 0.2%
- Active inventory
- 341
- Price-to-rent
- 8.6×
Monthly cashflow live
- Estimated rent
- $1,945 high interval (Pro) →
- Mortgage (P&I)
- −$1,048
- Tax from tax record
- −$124 /mo · $1,491/yr
- Insurance
- −$83
- HOA
- −$0
- Vacancy / Maint / Mgmt
- −$408
- Net cashflow
- $281
Break-even live
UW: 25.0% down · 7.5% · 30yr · 1.5% tax · 5.0% vac · 8.0% maint · 8.0% mgmt
Financing live
Cash to close
- Down payment
- $49,975
- Closing costs
- $5,997
- Reserves months
- —
- Total cash needed
- —
Loan-product check · same deal, 3 products live
Conventional
25% down · 7.5% · 30yr
- Down + closing
- —
- Monthly P&I
- —
- Monthly cashflow
- —
- DSCR
- —
- Eligible?
- —
Personal DTI + credit; lowest rate.
DSCR
20% down · 8.5% · 30yr
- Down + closing
- —
- Monthly P&I
- —
- Monthly cashflow
- —
- DSCR
- —
- Eligible?
- —
No personal income docs; deal must DSCR.
Hard money
10% down · 12.0% · 12mo
- Down + closing
- —
- Monthly P&I
- —
- Monthly cashflow
- —
- DSCR
- —
- Eligible?
- —
Short-term bridge; refi at stabilization.
Rent comps 6 comps
| Address | Beds | Baths | Sqft | Rent | $/sqft | DOM | Units | Dist |
|---|---|---|---|---|---|---|---|---|
| 117 Greenfield Rd Columbia, SC | 3.0 | 2.0 | 2055 | $1,981 | $0.96 | 23d | 1 | 0.50mi |
| 1659 Legrand Rd Columbia, SC | 2.0–3.0 | 2.0–2.5 | 1450 | $2,500 | $1.72 | 3d | 12 | 0.99mi |
| 1152 Rabon Pond Dr Columbia, SC | 3.0 | 2.5 | 1522 | $1,799 | $1.18 | 11d | 1 | 1.07mi |
| 1270 Polo Rd Columbia, SC | 1.0–3.0 | 1.0–2.0 | 1167 | $1,841 | $1.58 | 3d | 41 | 1.20mi |
| 2058 Mapleton Dr Columbia, SC | 3.0 | 2.5 | 1476 | $1,995 | $1.35 | 21d | 1 | 1.25mi |
| 381 Valley Heights Ln Columbia, SC | 3.0 | 2.5 | 1471 | $1,719 | $1.17 | 23d | 1 | 1.36mi |
Listing history 14 events
-
2026-05-13historical Active - Contingent
-
2026-05-08status Active
-
2026-05-08status Pending
-
2026-04-24historical Active - Contingent
-
2026-04-13status Active
-
2026-04-01historical Active - Contingent
-
2026-03-26$199,900 Active
-
2026-01-09status Active
-
2025-12-28status Pending
-
2025-11-10$209,000 Active
-
2006-05-26soldstatus $131,000
-
2005-11-02soldstatus $78,200
-
2002-02-08soldstatus $108,000
-
1995-08-22soldstatus $86,900
ⓘ Source: listings_history table (triggers on properties + properties_extension) + one-shot
backfill from property_details.listing_events for pre-trigger history.
Tax reassessment forecast SC · Resets to sale price
- Current annual tax
- $1,491 · $124/mo
- Projected year-2 tax
- $1,491 · $124/mo
- Expected delta
- $0/yr ($0/mo · 0.0%)
ⓘ Screening estimate from a state-policy table — verify with the county assessor before closing.
Climate risk First Street
- Flood 1/10 Low FEMA zone X (unshaded) · 0% chance over 30 yrs
- Wildfire 3/10 Moderate
- Heat 7/10 Severe 7 d/yr ≥108°F today · 16 d/yr by 30 yrs out
- Wind 6/10 Major 67% chance of damaging wind over 30 yrs
- Air quality 3/10 Moderate 3 unhealthy d/yr today · 3 by 30 yrs out
Nearby sold comps map
Loading sold comps map…
Walkable amenities ~0.75 mi
Loading nearby amenities…
Taxation est. · year 1
- Rental income
- $23,340
- − Mortgage interest
- −$11,198
- − Property taxes
- −$1,491
- − Insurance
- −$1,000
- − Repairs & maintenance
- −$1,867
- − Management
- −$1,867
- − Depreciation
- −$5,815
- Taxable income
- $102
- Est. tax owed @ 24.0%
- −$24
- After-tax cash flow
- $3,344/yr
For passive investors: Depreciation is non-cash, so a rental often shows a tax loss while cash-flowing — sheltering income. Rental losses are passive: they offset passive income freely, and up to $25,000/yr can offset ordinary (W-2) income if you actively participate and your MAGI is under $100k (phasing out to $0 by $150k); unused losses carry forward. On sale, claimed depreciation is recaptured at up to 25%, and gains may owe capital-gains tax (a 1031 exchange can defer both). Figures are a year-1 estimate at your 24.0% rate — not tax advice; consult a CPA.
Schools (NCES district)
- District
- Richland 02
- NCES district ID
- 4503390
- Math proficiency
- 35% ▼ -15.00%
- Reading proficiency
- 47% ▼ -5.00%
- Median HH income
- $59,684
- Composite
- 36.2/100
- National rank
- #4730
- State rank
- #29 of 80 in SC
Livability — Dentsville
- Score
- 71/100
- State rank
- #50
- US rank
- #6940
Category grades
Schools grade is shown separately in the Schools card above.
Census & demographics
- Census place
- Dentsville, SC
- County
- Richland County · 389,530 people
- City population
- 52,835
- Metro
- Columbia, SC
- Population (ZIP)
- 53,074
- Household income
- $62,408
- Rent vs Own
- Severe rent burden
- 2857.0
Population outlook (Richland County) Hauer SSP2
- Today (2025)
- 459,667 people
- By 2030
- 487,524 · +6.1%
- By 2040
- 542,035 · +17.9%
- By 2050
- 595,371 · +29.5%
- By 2075
- 732,998 · +59.5%
- By 2100
- 820,415 · +78.5%
Race, ethnicity, and origin ACS 2023
- Neighborhood character
- Diverse neighborhood (Simpson 0.60)
- Race & ethnicity
- Black 57% White 23% Hispanic / Latino 11% Two or more races 6% Asian 4%
- Hispanic origin (detail)
- Mexican 5% Puerto Rican 2%
- Common ancestry
- Slovak 1% Serbian 1% Italian 1%
- Foreign-born
- 10% · Canada, South Korea
- Languages at home
- 86% English-only · Spanish 8% Other Indo-European 2% Korean 1%
Political lean MEDSL · Richland
- 2024 margin
- Solid D (+34.6) · D 66.4% · R 31.8% · Other 1.8%
- 2008→2024 swing
- +5.7pp toward D · 2008: 28.9pp · 2024: 34.6pp
- All cycles
- 2024: D+34.6 2020: D+38.3 2016: D+32.9 2012: D+33.3 2008: D+28.9
Not yet ingested
- Civics
- —
Market trends
- HPI YoY
- ▼ -135.96%
- Current HPI
- 195.3158
- Rent YoY
- ▲ 0.21%
- Metro
- Columbia, SC
- State GDP YoY
- ▲ 4.51%
- F500 in state
- 2
Industry mix (Fortune 500 HQ in SC)
| Industry | F500 HQs | Revenue |
|---|---|---|
| Packaging | 1 | $7B |
|
||
Price history
+130.0% since first listed14 events — show timeline
- 2026-05-13 Contingent — Consolidated MLS
- 2026-05-08 Relisted — Consolidated MLS
- 2026-05-08 Pending — Consolidated MLS
- 2026-04-24 Contingent — Consolidated MLS
- 2026-04-13 Relisted — Consolidated MLS
- 2026-04-01 Contingent — Consolidated MLS
- 2026-03-26 Listed $199,900 Consolidated MLS
- 2026-01-09 Relisted — Consolidated MLS
- 2025-12-28 Pending — Consolidated MLS
- 2025-11-10 Listed $209,000 Consolidated MLS
- 2006-05-26 Sold (Public Records) $131,000 Public Records
- 2005-11-02 Sold (Public Records) $78,200 Public Records
- 2002-02-08 Sold (Public Records) $108,000 Public Records
- 1995-08-22 Sold (Public Records) $86,900 Public Records
Property tax history
+1.8%/yrLatest (2025): $1,491 · +2.9% YoY. Source: county tax records.
Cash-flow waterfall
monthlySold comps — $/sqft
last 12 mo · ≤1 miLoading sold comps…